Bitcoin Hits $100K, then Drops is the Bull Run Slowing Down?
13th February 2025 • 9 mins read
Bitcoin Market Analysis
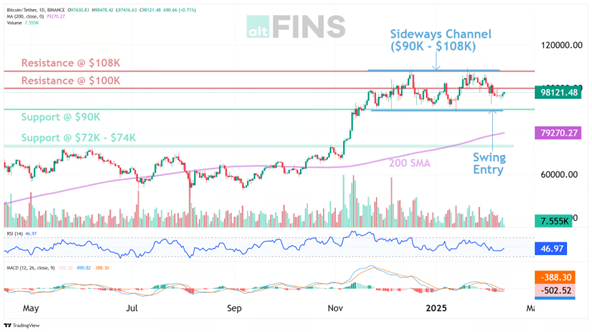
Over the past week, Bitcoin has experienced notable price movements. On February 6, 2025, BTC was trading around $95,800, reaching a weekly high of $100,000 on February 7, before facing rejection and pulling back. The lowest price during the week was $94,000, recorded on February 12. As of February 13, 2025, Bitcoin is trading at $97,524, reflecting a 2.23% increase from the previous week’s closing price.
Source: https://altfins.com/
The price remains above the 200-day SMA at $79,270, signaling a bullish trend. The MACD (Moving Average Convergence Divergence) indicator shows that while the MACD line is still below the signal line, the rising histogram suggests that bearish momentum may be slowing down, potentially signaling an upcoming shift in trend.
Over the past week, Bitcoin broke through the $100,000 resistance level, reaching a new all-time high (ATH) at $108,000, before facing rejection and pulling back. If Bitcoin can break above $108,000, it could target the next key resistance level at $120,000. However, failure to hold above this level may lead to further consolidation. On the downside, support is currently strong at $90,000, which has acted as a key level for buyers stepping in. If this support fails, the next major support is at $75,000, a level that has previously provided significant buying interest.
Bitcoin is trading within a sideways channel, signaling market indecision. Trend traders should wait for a breakout, while swing traders can buy near $90,000 support and sell near $108,000 resistance. A stop-loss at $88,000 helps manage risk. Momentum remains bearish, but the MACD histogram suggests a potential shift, while RSI remains neutral, leaving price direction dependent on macro factors and liquidity.

Source: https://cryptoquant.com | @Shayannv7
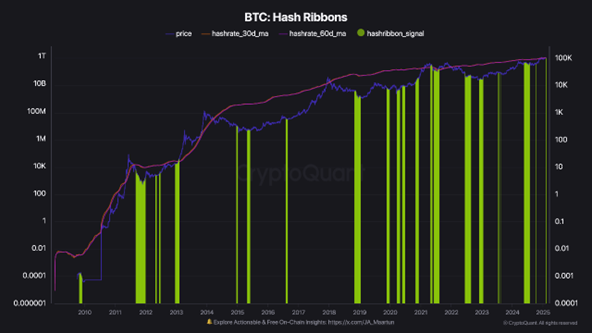
Meanwhile, the Hash Ribbons indicator, which tracks Bitcoin’s hash rate fluctuations to assess mining ecosystem health, is flashing signs of potential miner capitulation. Historically, this metric has identified optimal entry zones for mid-term and long-term accumulation, with past signals often preceding Bitcoin rallies. However, its accuracy was challenged once during the COVID-19 market shock, highlighting the influence of external factors. If the current signal holds, it may indicate a shift in miner behavior, but broader market conditions will ultimately dictate Bitcoin’s price trajectory.
Source: https://cryptoquant.com | @Darkfost
At the same time, Rekt Capital notes that Bitcoin has completed its first price discovery uptrend and is now attempting to reverse its first price discovery correction. According to historical trends, Bitcoin could soon enter a second price discovery uptrend, potentially leading to new all-time highs. He also highlights that this Bitcoin cycle has been characterized by re-accumulation ranges, where downside deviations below the range low (green) have historically presented outsized bargain opportunities. However, whether this pattern continues will depend on broader market conditions, including liquidity, macroeconomic factors, and investor sentiment.

Source: https://x.com/rektcapital/status/1889011952808312883/photo/1
Meanwhile, Cathie Wood predicts Bitcoin could reach $1.5 million by 2030, citing rising institutional adoption and increasing demand. Goldman Sachs also increased its spot Ether ETF holdings by 2,000% in Q4 2024, while its Bitcoin ETF holdings more than doubled to $1.5 billion, signaling continued institutional interest in crypto.

Source: https://altfins.com/
Ethereum (ETH) is currently trading within a Falling Wedge pattern, a formation that typically precedes a bullish breakout once the upper trendline is breached. However, ETH has also fallen below the 200-day Moving Average (200 SMA), signaling the onset of a downtrend. The short- and medium-term trends remain strongly bearish, while the long-term trend is neutral. Momentum is bearish but inflecting, as the MACD line remains below the signal line, though rising histogram bars suggest a potential shift towards an upswing. RSI-14 indicates that ETH is neither overbought nor oversold, making the price direction uncertain. Swing traders may attempt to trade within the wedge’s convergence lines, but most traders should wait for a confirmed breakout before entering a BUY order. Key support levels to watch are $2,400 and $2,100, while resistance zones stand at $3,200 and $3,550.
This Week’s Recap
- CPI inflation in January 2025 rose by 0.5% month-over-month, pushing the annual rate to 3%, above the expected 2.9%.
- Trump plans to appoint Brian Quintenz, head of policy at Andreessen Horowitz’s crypto division, as the new leader of the CFTC.
- Truflation reported a 0.47% drop in U.S. inflation on February 1, with declines in utilities, clothing, transportation, and housing, despite new tariffs taking effect, which are expected to impact prices over time.
- Franklin Templeton has expanded its tokenized money market fund, Franklin OnChain U.S. Government Money Fund (FOBXX), to the Solana blockchain.
- Analysts anticipate Coinbase’s Q4 2024 earnings will reflect significant growth, with trading volumes reaching approximately $430 billion, the highest since 2021. This surge is expected to result in a 109% year-over-year revenue increase, totaling around $2 billion
- Uniswap Labs has launched Unichain, an Ethereum Layer 2 solution, enhancing the UNI token’s price and social activity.
- Grayscale and NYSE Arca have filed for a Cardano ETF, positively impacting ADA’s price 15%.
- The SEC is seeking public comment on Solana ETF filings, the proposal aims to list and trade the Grayscale Solana Trust, which is expected to be converted into an ETF—following the same approach Grayscale used last year.
- Ethereum’s Total Value Locked (TVL) has risen to $52.8 billion, despite its price declining over 20% YTD, while its DeFi market share dropped to 54.51%, a three-month low
- Goldman Sachs has boosted its Bitcoin ETF holdings to $1.5 billion, from $701 million to $1.5 billion, representing a 114% increase in Q4 2024.
- U.S. Congress is expected to pass stablecoin regulation within six months, with Rep. Maxine Waters urging bipartisan support for the legislation.
- Ethereum led digital asset fund inflows with $793M, while transaction fees dipped below $1M, hitting $731,472 on Feb 8.
- FTX will begin repaying creditors on February 18, 2025, starting with smaller claims under $50,000, while larger claims will be processed in Q2, with total distributions expected between $11 billion and $13 billion in cash.
- MicroStrategy bought $742M in Bitcoin, increasing its total holdings to 478,740 BTC.
- Multiple U.S. states are considering adopting Bitcoin as a reserve asset, with legislation proposed to allocate up to 10% of public funds into Bitcoin. States such as Texas, Florida, Wyoming, Alabama, New Hampshire, Pennsylvania, Ohio, North Dakota, Oklahoma, Massachusetts, and Utah have introduced such legislation
- On-chain real-world assets (RWAs) like tokenized U.S. Treasuries, corporate credit, and real estate are gaining traction, with RWA tokenization surpassing $17 billion amid Bitcoin market uncertainty.
- The SEC has delayed its decision on BlackRock’s Ethereum ETF options trading until April 9, 2025, citing the need for additional time to review the proposal.
Mark Your Calendars
Economic Data Releases:
- February 13, 2025 (Thursday): The Producer Price Index (PPI) for January 2025
- February 14, 2025 (Friday): U.S. Import and Export Price Indexes for January 2025
- February 20, 2025 (Thursday): Initial Jobless Claims for the week ending February 15, 2025
Cryptocurrency Events:
- February 23 – March 2, 2025: The ETHDenver 2025 Hackathon will take place at the National Western Complex in Denver, Colorado. As the world’s largest blockchain-powered #BUIDLathon, ETHDenver gathers developers, entrepreneurs, and innovators from over 125 countries to collaborate on decentralized applications, blockchain solutions, and Web3 advancements.
Token Unlock
- February 14, 2025:
- SAND: $82.50M worth of tokens unlocking (8.41% of circulating supply). A large supply release may lead to market adjustments.
- February 15, 2025:
- STRK: $15.73M worth of tokens unlocking (2.48% of circulating supply). Investors should watch for price fluctuations.
- February 17, 2025:
- SEI: $12.91M worth of tokens unlocking (1.24% of circulating supply).
- AVAX: $42.69M worth of tokens unlocking (0.40% of circulating supply).
- February 18, 2025:
- ARB: $45.14M worth of tokens unlocking (2.13% of circulating supply).
- February 19, 2025:
- APE: $11.53M worth of tokens unlocking (2.16% of circulating supply).