Bitcoin and Ethereum Hit New Highs, Altcoins and DeFi Gain Traction
31st August 2025 • 12 mins read
Key Numbers:
Bitcoin $108,813 (-7.99%) Ethereum $4,484.83 (18.43%)
1-month return
Total Crypto Market Cap $3.87T (-1.77%)
2025 returns
Bitcoin 14.17% Ethereum 31.59% Gold +33.26%
NASDAQ 11.11% S&P500 9.83%
Key Takeaways
- Bitcoin set a new all time high above $124,000 on August 14 before easing into the low $110,000s, with price action shaped by CPI data, Powell’s Jackson Hole speech, and a large August 29 options expiry.
- Ethereum outperformed with a fresh peak near $4,950 on August 24, while U.S. spot ETH ETFs recorded $3.87 billion of net inflows versus a $751 million net outflow in Bitcoin ETFs.
- July CPI released August 12 showed +0.2% m/m and +2.7% y/y headline, with core +0.3% m/m and +3.1% y/y, keeping disinflation slower than hoped and capping momentum into late month.
- Powell’s Jackson Hole address on August 22 emphasized data dependence, balancing sticky inflation against softening labor markets, which compressed realized volatility and kept carry intact.
- Altcoin capitalization climbed from $800 billion in July to over $1.05 trillion mid August before consolidating near $1.01 trillion, with oracles (+47.2%) and Ethereum-related tokens (+25.6%) leading sector gains.
- DeFi TVL closed August at $152.75 billion, up more than $60 billion year-to-date, with Aave v3 holding $69 billion and stablecoin supply reaching $284.58 billion.
- Regulated participation deepened: CME ETH futures open interest crossed $10 billion, large-holder accounts expanded, and ETF pipelines widened to include Solana, Dogecoin, Avalanche, Cardano, and Polkadot.
- The U.S. Department of Commerce began distributing GDP data on blockchains via Chainlink and Pyth, a proof-of-concept that introduced signed macro reference data for programmable finance.
- Seasonality loomed as CoinGlass data showed September as Bitcoin’s weakest month historically, reinforcing a cautious posture into PCE and labor releases.
Market behavior in August is most coherently explained by macro communication, with microstructure acting as a transmission channel rather than a primary cause. Bitcoin advanced to a verified all time high above $124,000 in the first half, then retraced and stabilized in the low $110,000s into the close, while ether set a new all time high near $4,950 on August 24 before easing with the complex. A large August 29 options expiry concentrated open interest and hedging flows, which muted late month ranges, although the direction and timing of the fade aligned more closely with the July inflation print and Chair Powell’s Jackson Hole message. For context only, not as a forecast, September has historically been a weak month for bitcoin, with stronger average outcomes in October and November, which framed risk management at the margin as August ended.
The most important inputs into August price formation arrived from the inflation and policy calendar. The Bureau of Labor Statistics reported that July CPI rose 0.2% month over month and 2.7% year over year, with core up 0.3% month over month and 3.1% year over year, results released on August 12 that signaled slower disinflation in services and kept the debate focused on the timing and pace of any easing. The practical effect was a ceiling on momentum after mid month highs and a floor under risk from the absence of a hawkish surprise, which supported carry and kept funding orderly into month end.
Chair Powell’s Jackson Hole remarks on August 22 reinforced a cautious stance rather than a directional impulse. The speech placed decisions within a data dependent framework, balanced inflation persistence against labor market softening, and avoided a date certain for any cut, which typically compresses realized volatility as allocators await confirmation across CPI and PCE. That communication pattern was consistent with the calm, two sided tape observed into the final sessions.
Bitcoin Market Analysis
Bitcoin’s trajectory reflected the macro sequence and highlighted how regulated flow channels can translate policy tone into prices without disorderly liquidation. A new all time high above $124,000 was recorded on August 14, after which spot eased into the low $110,000s as the Jackson Hole window approached and attention turned to late month PCE, a path widely described as cooling rather than trend break. Stabilization near prior breakout zones indicated two sided interest even as enthusiasm to add new risk moderated.
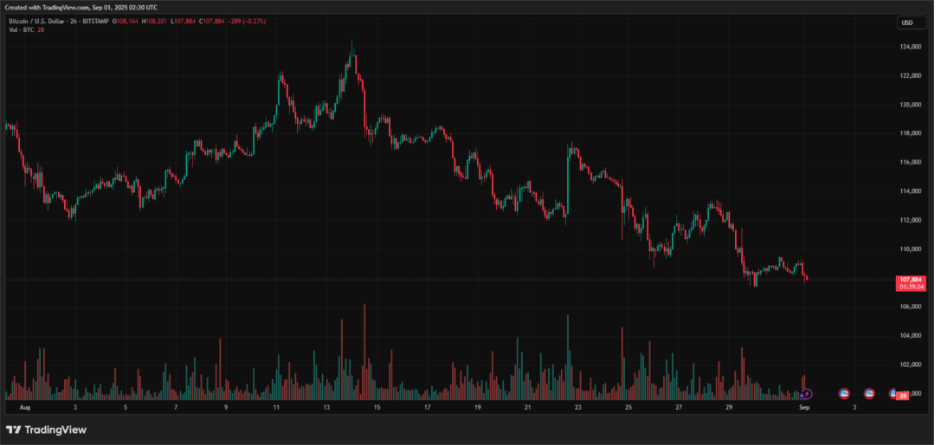
Source: https://www.tradingview.com/
Primary market behavior aligned with that read. Daily tables for U.S. spot bitcoin ETFs showed net redemptions clustering around August 20 to August 22, followed by a return to net inflow August 25 and August 26 at several issuers, a cadence that mapped to digestion after the peak and subsequent stabilization, without evidence of a structural exit.
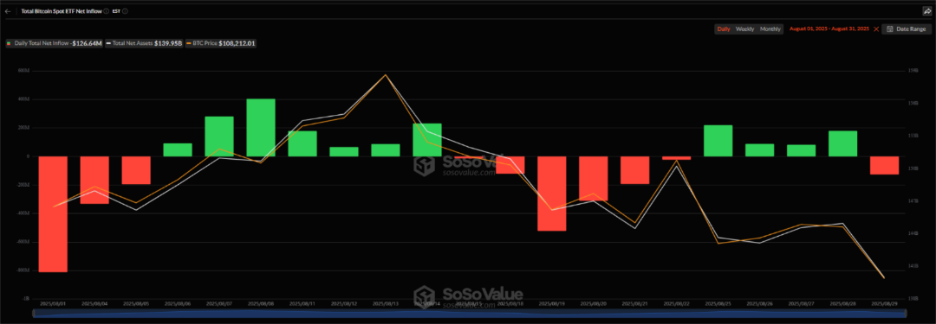
Source: https://sosovalue.com/dashboard/total-crypto-spot-etf-fund-flow
Listed options shaped the texture of the close. Coverage ahead of the August 29 settlement tallied more than $14.6B of combined bitcoin and ether notional expiring, with a tilt toward bitcoin downside protection, a setup that typically encourages pinning around crowded strikes as hedgers rebalance and that translates macro caution into narrower ranges.
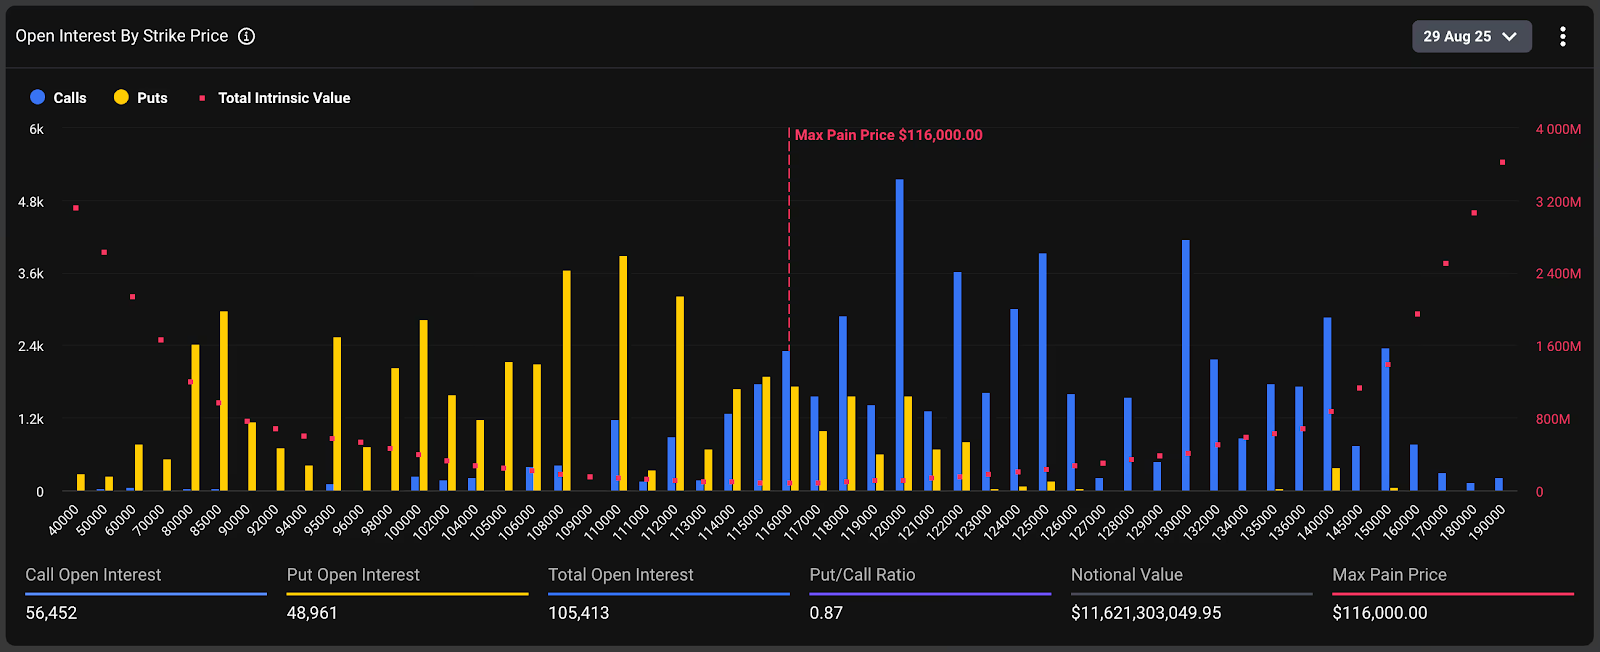
Source: https://www.deribit.com/statistics/BTC/metrics/options
From a macro-first perspective, these mechanics influenced price action without altering the broader thesis. The direction and timing of the late month drift tracked most closely to Jackson Hole and the PCE wait, with expiry providing the plumbing through which that caution expressed itself on screens. The August picture therefore remains one of a verified new high, an orderly redistribution of exposure, a temporary pause in ETF demand that later steadied, and compressed volatility into settlement.
Ethereum Market Analysis
Ether’s late month leadership combined discrete price milestones with evidence of institutional engagement through regulated wrappers and listed venues. On August 24, a new all time high near $4,950 was recorded, placing ether back in price discovery for the first time since the prior cycle. The marginal buyer and access path were identifiable, since regulated funds and exchange cleared futures dominated the flow that accompanied the move.
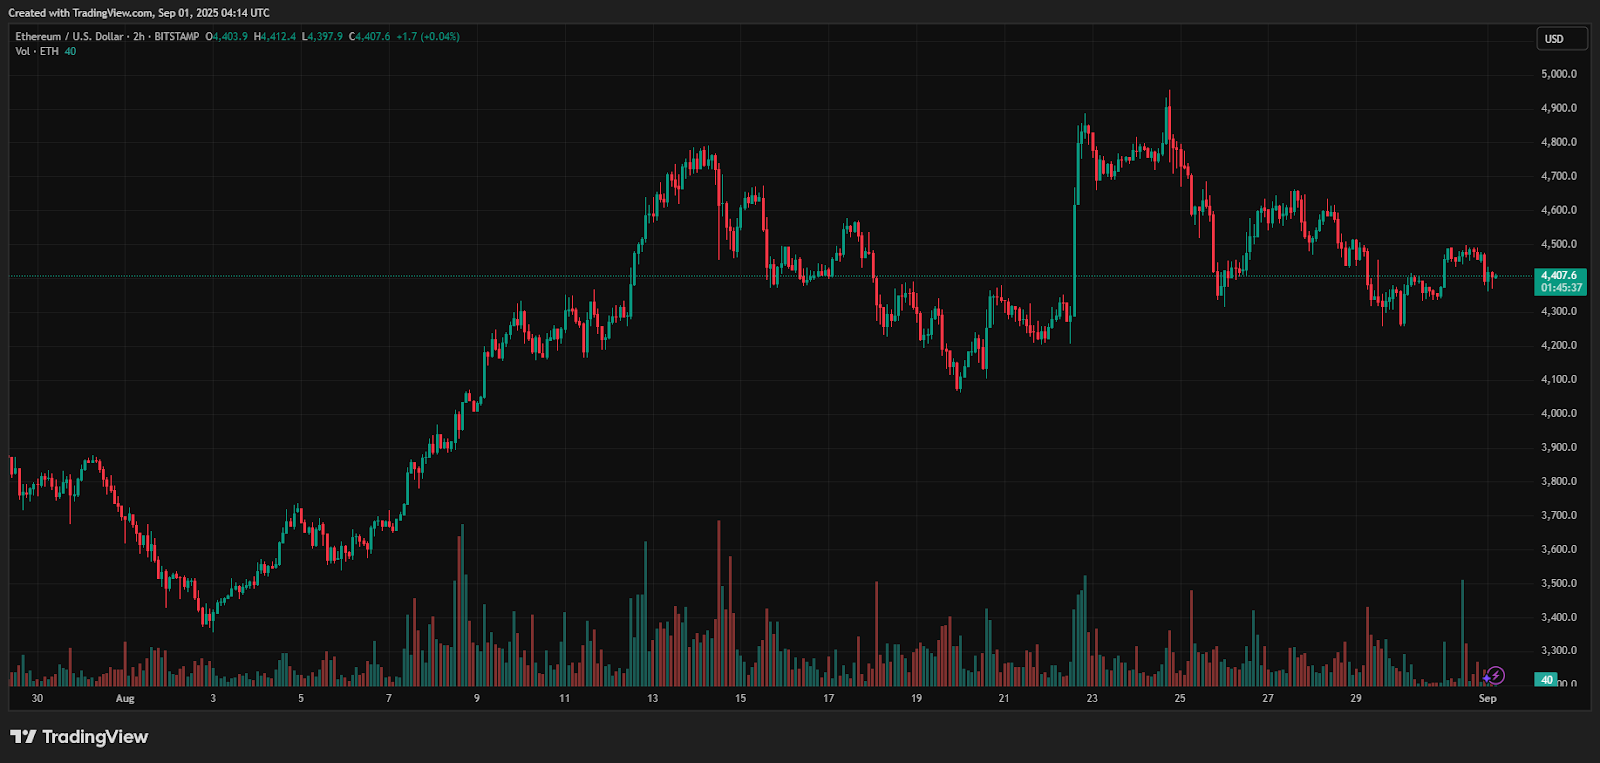
Source: https://www.tradingview.com/
Primary market prints captured a run of unusually large net inflow in U.S. spot ether ETFs during the final week, including approximately $443.9M on August 25, about $455M on August 26, and around $309.5M on August 27, which coincided with the new high and signaled persistent demand via regulated channels. The largest single-day inflow of the month was $1.02B on August 11, underscoring the scale of capital rotation into ether ETFs during the rally. Across the full month, ether ETFs recorded $3.87B in net inflows, while bitcoin ETFs saw a net outflow of $751M, highlighting that ether led liquidity flows in August.
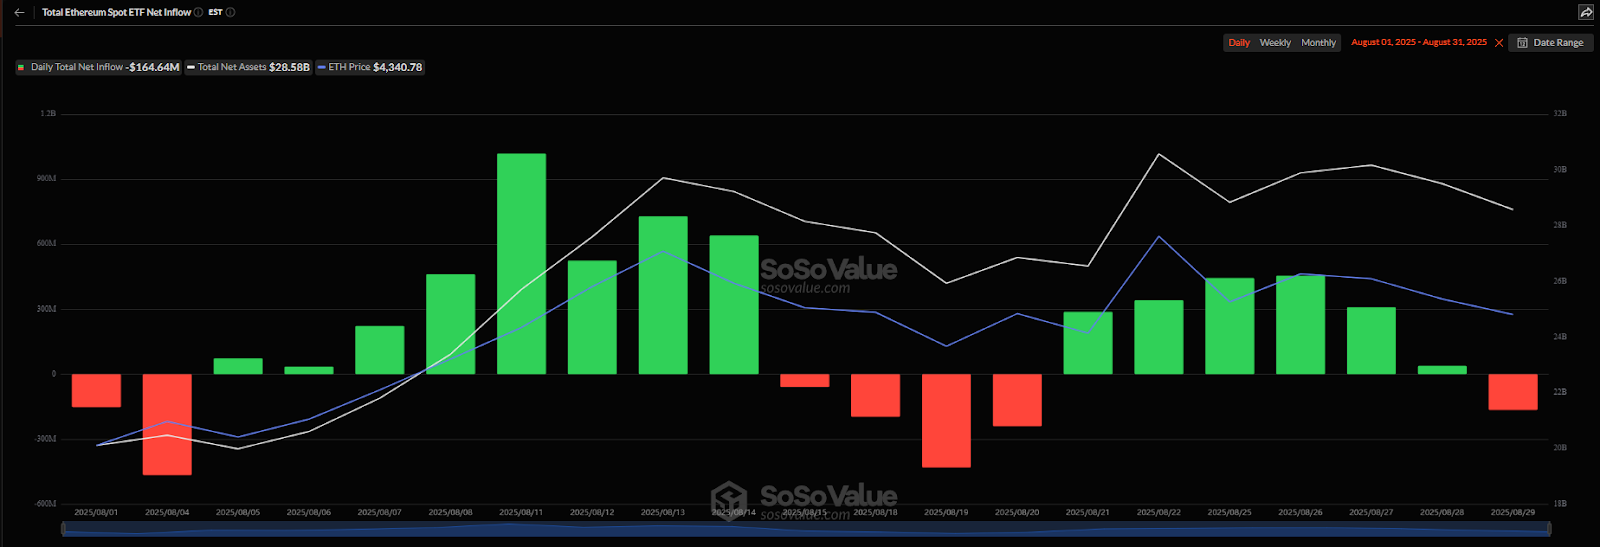
Source: https://sosovalue.com/assets/etf/
The futures footprint corroborated that institutional presence. Open interest in ether futures on CME climbed above $10B near August 28, alongside growth in large open interest holders, a combination that typically appears when professional participation broadens. Options positioning appeared more balanced in ether than in bitcoin into the August 29 event, which is consistent with less pronounced pinning when concurrent spot demand persists. The moderation into the close therefore read as macro driven caution that capped follow through after the high, not as a loss of structural sponsorship.
Altcoin Market Analysis
Outside the two largest assets, behavior remained selective, and catalyst driven. The most concrete late month theme concentrated in data infrastructure and oracle networks after official statements that government macroeconomic statistics would be distributed on public blockchains with Chainlink and Pyth named as providers. This created immediate attention in those ecosystems and introduced an architectural input for programmable finance that extends beyond a single month, positioning oracles as a structural narrative rather than a short-term trade. Altcoin market capitalization has also been in a rising trend since early July, climbing from the $800B range to more than $1.05T by mid-August before consolidating near $1.01T into the close, confirming that capital rotation extended beyond BTC and ETH even as leadership stayed narrow.
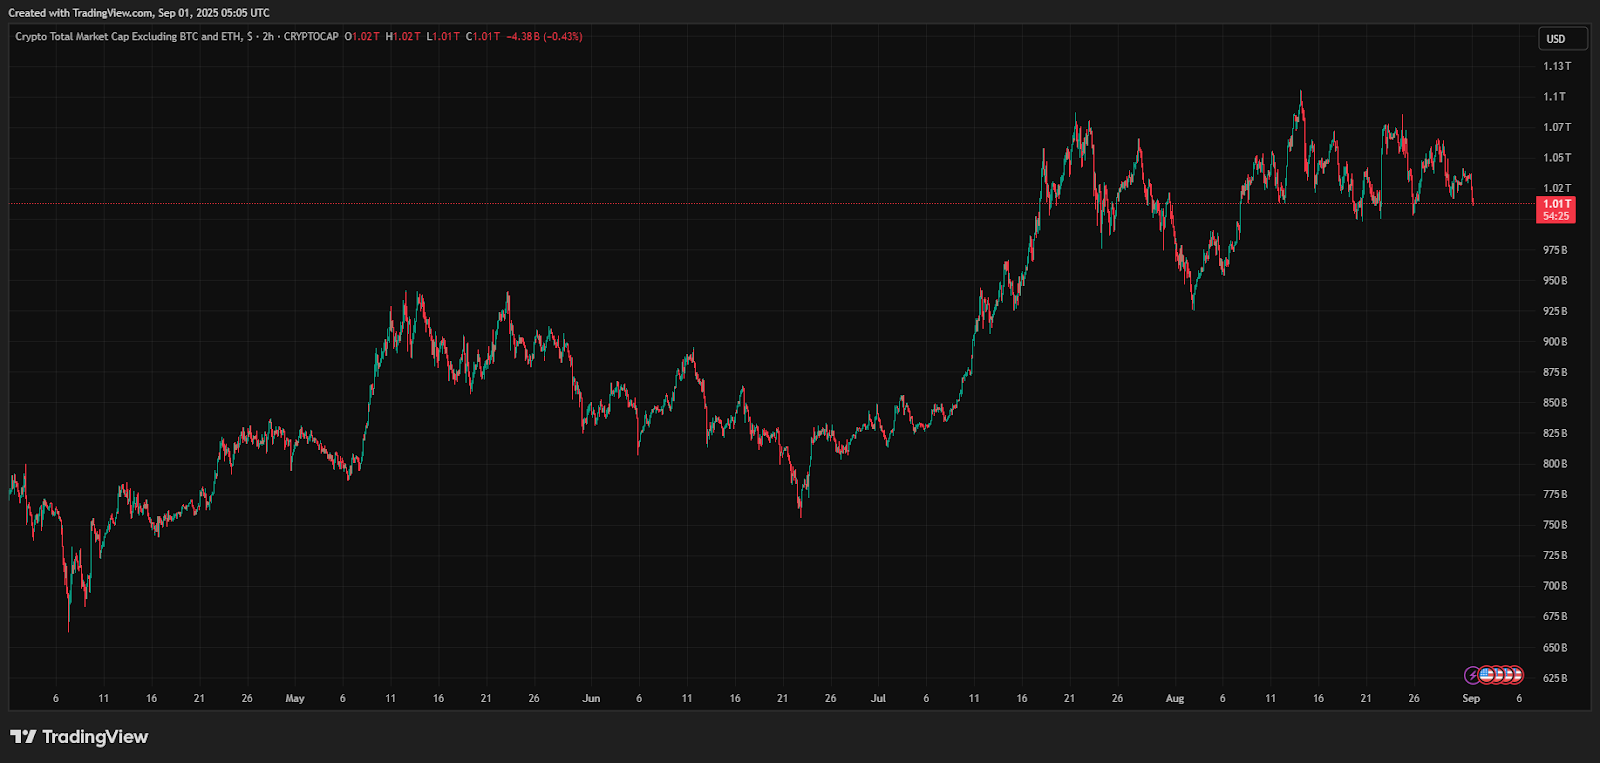
Source: https://www.tradingview.com/
Sector performance data underscores this rotation, with oracles leading all categories at +47.2% and Ethereum-related tokens advancing +25.6%. Exchange tokens (+20.5%) and staking services (+17.3%) also posted strong gains, reflecting a broader appetite for infrastructure that channels liquidity or provides yield. In contrast, NFTs (-11.2%), privacy coins (-8.4%), and the bitcoin ecosystem (-5.7%) were the weakest groups, highlighting a divergence in allocator priorities that punished sectors without identifiable marginal buyers or near-term utility.
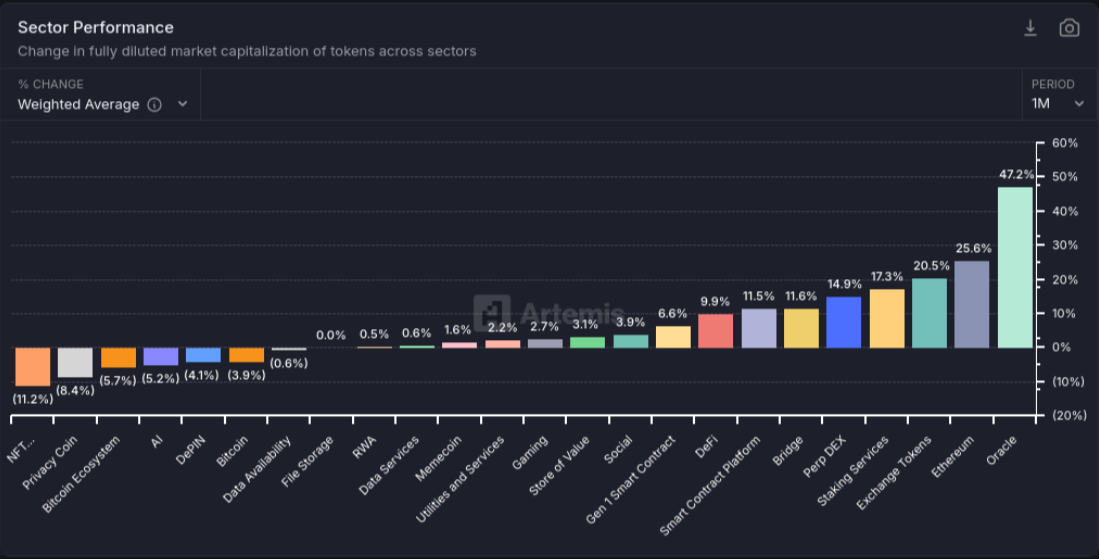
Source: https://app.artemisanalytics.com/
In the absence of a single catalyst that lifted the entire altcoin market, leadership concentrated in assets with credible access pipes and data narratives. This pattern fits a late-cycle environment in which allocators emphasize practical use cases, liquidity pathways, and identifiable demand over broad beta exposure.
Decentralized Finance (DeFi)
Total Value Locked (TVL) in DeFi ended August 2025 at approximately $152.75 billion, reflecting a steady climb from spring lows and a gain of more than $60 billion year-to-date. Stablecoin market capitalization reached $284.58 billion, while daily decentralized exchange (DEX) volumes held around $11.09 billion and perpetuals turnover registered $12.06 billion. These figures underscored a broad expansion in sector liquidity, with stablecoin collateral continuing to serve as the backbone of DeFi credit and trading activity.
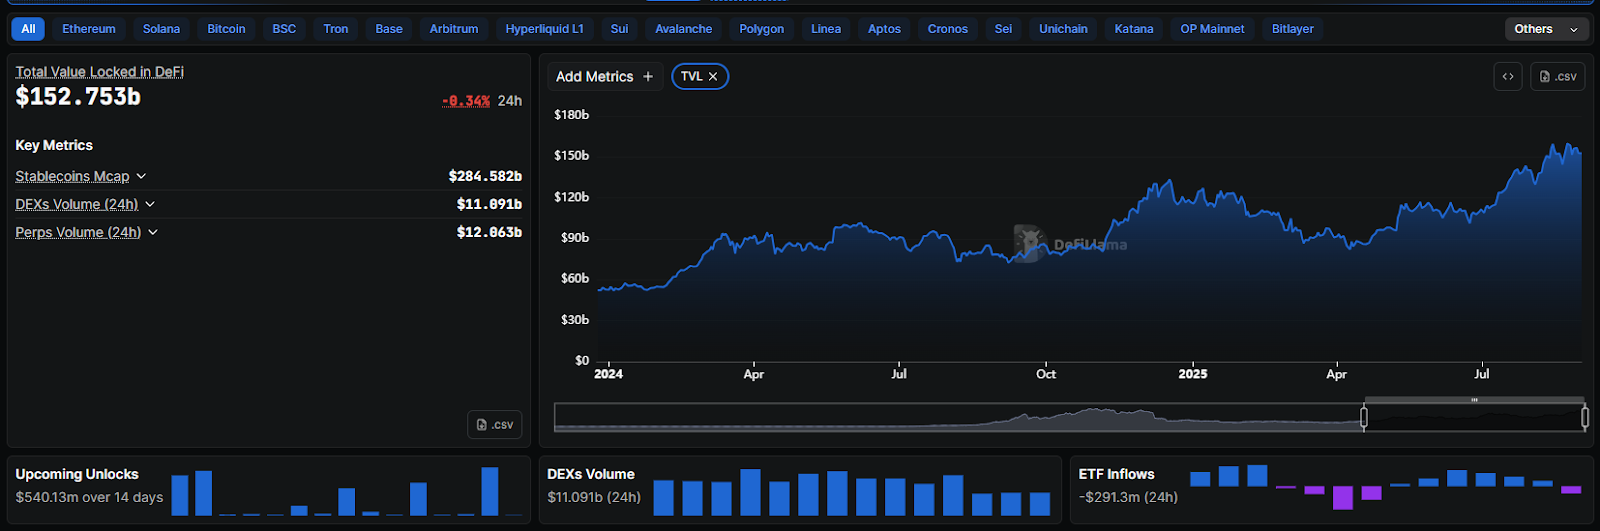
Source: https://defillama.com/
Aave remained the dominant protocol, with v3 liquidity reaching approximately $69 billion, equal to 62% of DeFi lending and 23% of all DeFi collateral. Anticipation of the v4 release, featuring “Liquidity Hubs” designed to streamline cross-chain settlement, reinforced Aave’s position as the sector’s benchmark for institutional engagement. Uniswap volumes also benefited from late-month Ethereum strength, confirming the concentration of flows in core venues.
Corporate and institutional signals underscored DeFi’s maturing profile. DeFi Development Corp secured a $125 million equity raise to expand Solana-based infrastructure and rang the Nasdaq closing bell on August 29. Stablecoin innovation advanced in parallel, with Circle’s mUSD integration into lending protocols providing consistent 4–6% yields, adding depth to stablecoin-denominated credit markets.
In the United States, the DeFi Education Fund and a16z Crypto pressed for a safe harbor that would exempt neutral open-source interfaces from broker-dealer classification. At the same time, researchers advanced the concept of “crosstagion,” highlighting systemic spillovers between DeFi and traditional finance. Together, these developments framed August as a month where DeFi scaled record liquidity while drawing closer scrutiny from policymakers and scholars.
Regulation and Institutional Participation
Sector specific regulations did not supply the dominant impulse in August. The most consequential policy adjacent development came when the Department of Commerce began distributing GDP data on public blockchains, with Chainlink and Pyth identified as providers. This proof of concept introduced signed reference data for contracts referencing macro series such as PCE and related indices. Institutional activity was most visible through regulated wrappers and listed venues: ether’s push into new highs aligned with sustained net inflows into spot ETH ETFs and record open interest in CME ETH futures, which experienced desks read as institutional sponsorship rather than retail momentum. Bitcoin’s spot ETFs, by contrast, showed a mid-month pause followed by a late month return of inflows, a cadence consistent with consolidation after the high and the policy waiting game, and not suggestive of structural exit.
Beyond BTC and ETH, August also broadened the ETF pipeline. Issuers filed new spot applications for Dogecoin, Avalanche, Cardano, and Polkadot, while updated Solana proposals came from managers such as VanEck, Fidelity, Grayscale, Franklin Templeton, and 21Shares. By month end the SEC was reviewing roughly 92 crypto related ETP applications in total, including multiple Solana and XRP submissions. The breadth of active filings underscores how compliance constrained wrappers remain the principal conduits for scaled institutional participation, anchoring the link between regulated product development and capital allocation in digital assets.
Seasonality and August context
Seasonality did not dictate August’s outcomes, but it framed expectations and helped explain why momentum was not extended into the final week. CoinGlass data shows that September has historically been the weakest month for bitcoin, averaging mid-single-digit losses over the past decade, while October and November have delivered stronger returns. That history reinforced a wait-and-see stance as investors weighed policy meeting by meeting. In August 2025, the same stance fit the macro backdrop that stressed patience and the options positioning that clustered into a well-telegraphed expiry.
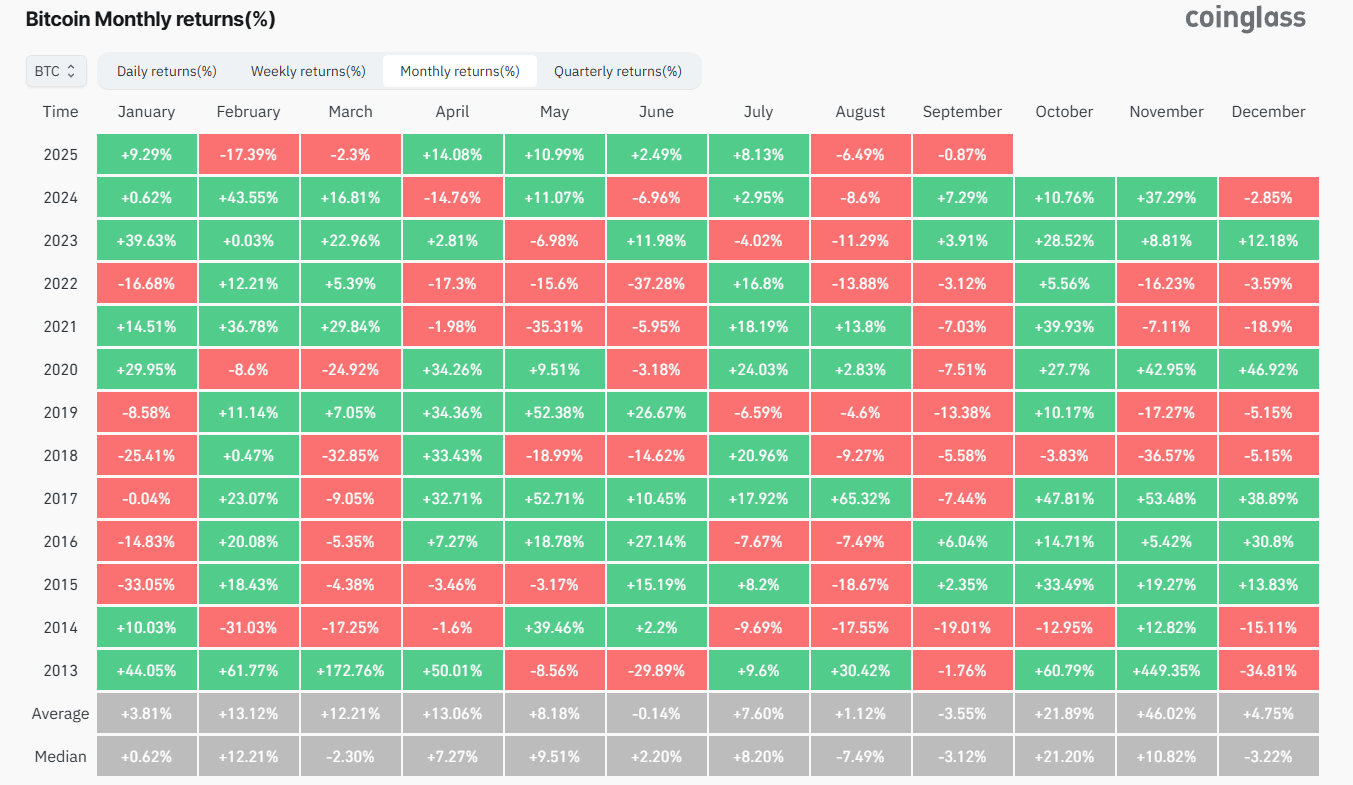
Source: https://www.coinglass.com/today
Heading into September, three markers stand out. The first is daily flow in U.S. spot BTC and ETH ETFs, which provide the cleanest gauge of regulated marginal demand and a test of whether the late August rotation sustains. The second is how listed options open interest redistributes after expiry, which determines how quickly pin risk clears and spot prices can establish fresh ranges. The third is the macro sequence following Jackson Hole, with inflation and labor prints set to decide whether policy remains a modest tailwind for carry or shifts into a headwind.
Closing Insights
August was macro led, with microstructure acting as an intensifier rather than a cause. Bitcoin and ether printed verified price milestones during the first two thirds, then moderated as policy emphasized data dependence and as core inflation remained sticky enough to prevent aggressive easing cues. ETF flows documented how regulated demand slowed, rotated, and then resumed in measured fashion. Options expiry concentrated hedging and narrowed ranges in the final sessions, consistent with a put heavy bitcoin profile and a more balanced ether profile, and liquidity stayed intact throughout. A public sector proof of concept for on chain distribution of GDP introduced a durable theme for the stack that intersects directly with smart contract design. As the month closed, the balance of evidence pointed to cautious risk management guided by inflation and central bank communication, continued reliance on regulated wrappers for institutional participation, and a market that remained structurally sound while enthusiasm to add risk paused into the data and options calendar.