Bitcoin Holds above $110K Amid CPI Jitters; Ethereum Eyes Bounce
4th September 2025 • 11mins read
This Week’s Recap
- Bitcoin Price Surges Above $111,000 as MicroStrategy Buys $449 Million of BTC: The firm disclosed a 4,048 BTC purchase for about $449.3 million, lifting holdings to 636,505 BTC. The buy reinforced ongoing corporate-treasury demand for bitcoin. Investors now watch potential follow-on equity raises and treasury cadence.
- Red September? Bitcoin Risks Sliding to $100K After 6% Monthly Drop: Technical signals turned bearish after August’s decline and a break of key supports. A failure to hold the $107,000–$110,000 zone could accelerate downside. The next test is whether dip buyers stabilize price into upcoming catalysts.
- Bitcoin and Ether Slump Over Weekend on Macro Jitters: BTC fell to about $107,383 and ETH to roughly $4,385 as PCE data weighed on risk. The pullback reset positioning after late-August volatility. Focus turns to labor data and rates pricing for direction.
- Bitcoin Dominance Slides to 55%, Opening the Door for Altcoin Rotation: BTC’s share of total crypto market cap retreated from recent highs to around 55%. Historically, falling dominance can coincide with capital rotating into majors beyond BTC. Desks will watch if ETH leadership broadens and whether flows persist.
- Ethereum Foundation to sell 10,000 ETH (~$43M) over coming weeks: The foundation outlined plans to liquidate 10,000 ETH to fund R&D, grants, and donations under its treasury policy. Such sales are closely watched as sentiment signals. Market will track on-chain movement, execution pace, and any impact on order books.
- Institutions accelerating ETH accumulation; “explosive” setup eyed into Q4: Analysts point to rising institutional demand and treasury accumulation as potential drivers. A growing locked supply could tighten float into year-end catalysts. Investors will watch treasury disclosures and ETF flow trends for confirmation.
- Whales buy 260,000 ETH in 24 hours, bolstering $5K recovery hopes: Large wallets accumulated 260,000 ETH in a day amid dip-buying. The flows suggest rotation from BTC toward ETH. Sustainability depends on macro prints and follow-through in spot and ETF demand.
- ETH exchange reserves hit 3-year low as funds and corporates accumulate: Exchange balances fell to a three-year low as long-term holders and institutions absorbed supply. Reduced float can increase price sensitivity to incremental inflows. Monitor staking deposits, L2 activity, and exchange flows for follow-through.
- SEC and CFTC issue joint guidance opening path for spot crypto trading on registered venues: The agencies issued a joint statement outlining how registered firms can facilitate certain spot crypto trades. The move signals harmonized oversight and reduces uncertainty for compliant venues. Next, watch for filings and targeted relief requests from early applicants.
- New SEC+CFTC statement “opens the door” for spot products, reduces overlap: The statement clarifies treatment of spot products and leveraged retail commodity transactions across jurisdictions. It aims to streamline supervision and lower friction for listings on regulated platforms. Exchanges and issuers are expected to test the process in coming weeks.
- Senate targets Sep. 30 markup for crypto market-structure bill: Lawmakers set a timeline to advance comprehensive market-structure legislation. The effort follows House action and seeks clearer definitions of digital asset securities and commodities. Watch for draft text, amendment negotiations, and committee vote signals.
- CFTC clarifies FBOT path so offshore crypto derivatives venues can serve U.S. traders: Staff guidance details how recognized foreign boards of trade can access U.S. customers without full DCM status. The pathway could expand regulated access to crypto derivatives while preserving surveillance standards. Expect applications and compliance upgrades to surface soon.
- Liquid-staking clarity: builders weigh implications of the SEC’s recent decision: Industry leaders outlined how the stance on liquid staking could unlock institutional participation. Clearer parameters may shift risk frameworks for LSTs and staking providers. Follow the rulemaking docket, potential no-action relief, and platform adjustments.
- “Strategy” now holds ~$46B in BTC after latest 4,048-coin purchase: The firm acquired 4,048 BTC for roughly $449 million, bringing total holdings to 636,505 BTC. The buy reinforced the corporate-treasury adoption narrative and acted as a short-term price catalyst. Investors will watch for additional equity raises and the pacing of future purchases.
- U.S. Bank resumes bitcoin custody for institutions, adds support for spot ETFs: U.S. Bank reinstated institutional bitcoin custody and integrated servicing for spot BTC ETFs. Expanded qualified-custodian options can reduce operational friction for asset managers. Key follow-ups are onboarding timelines, asset growth, and whether ETH products are added.
- Galaxy Digital to tokenize SEC-registered shares on Solana: Galaxy outlined plans to issue tokenized representations of public equity on Solana. The initiative advances real-world-asset tokenization and tests secondary-market plumbing. Market participants will track liquidity, transfer restrictions, and compliance interoperability.
- Ether Machine raises ~$654M, treasury nears 500,000 ETH ahead of listing plans: The ETH-focused company disclosed fresh capital that lifted its treasury to roughly 495,000 ETH. The raise underscores growing corporate adoption of ETH as a strategic asset. Watch for listing milestones, lock-ups, and treasury transparency.
- Bitcoin treads water while gold extends gains ahead of U.S. jobs data: Bitcoin held steady as gold extended gains into the U.S. nonfarm payrolls release. Cross-asset tone stayed cautious with traders trimming risk and watching dollar and yields. Next, rate-cut odds and ETF flows will guide direction.
- Gold hits record ~$3.5K as whales rotate from BTC to ETH: Gold set a fresh record while on-chain data showed large holders shifting from bitcoin to ether. The rotation underscored relative-strength dynamics favoring ETH in the short term. Watch real yields, DXY, and ETH spot and options flows for confirmation.
- Unpriced macro risks could trigger a BTC downside squeeze below $100K: Analysts warned that new macro risks and weak seasonality could force deleveraging. A break of support may accelerate liquidations given derivatives positioning. Traders will watch jobs data, CPI, and funding rates for early signals.
- Trump-backed “American Bitcoin” soars in Nasdaq debut: Shares rallied on day one, drawing attention to politically linked Bitcoin businesses. The debut revived discussion on public-market capital raises for crypto treasuries. Watch post-listing liquidity, stabilization, and any lock-up dynamics.
- OG Bitcoin whale rotates into ETH, amassing ~$4B: A long-time BTC holder reportedly shifted a multi-billion position into ether. The move underscores the BTC to ETH rotation theme visible in recent flows. Market will watch for additional wallet activity, exchange traces, and derivatives positioning.
- ETH on-chain activity and metrics continue to recover: Usage indicators and network interactions improved even as traders chased new narratives. Recovering activity can support price if sustained alongside healthy liquidity. Track L2 fees, volumes, and active addresses for confirmation.
Bitcoin Market Analysis
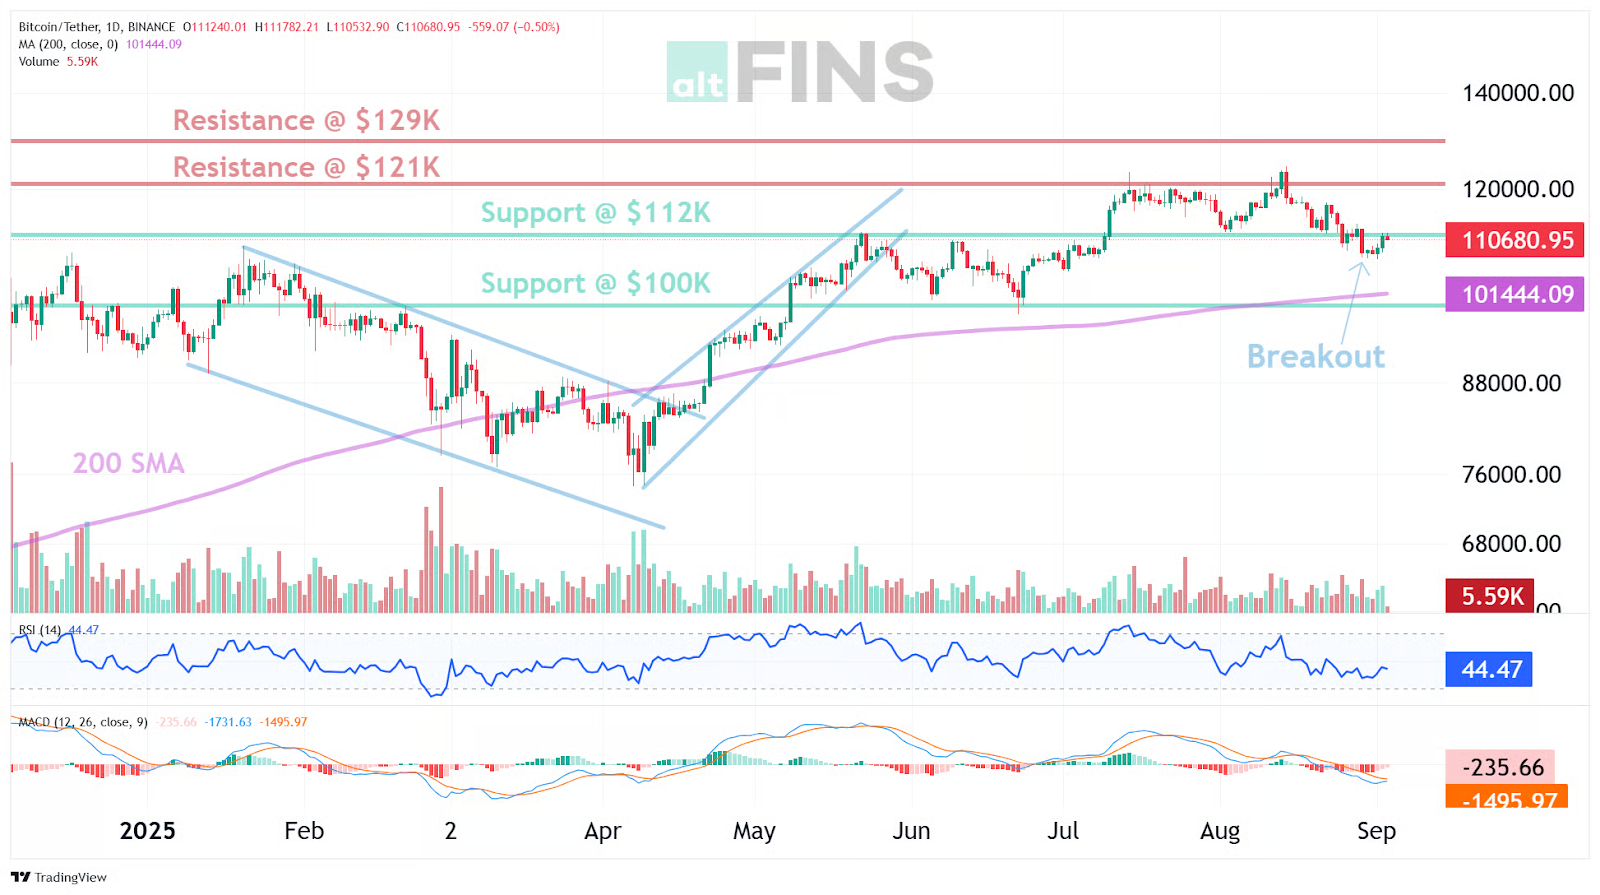
BTC spent the week in a contained pullback inside a larger uptrend, printing a 7 day high near $112,526 on Fri, Aug 29, and a 7 day low near $108,253 on Mon, Sep 1, with spot hovering close to $111,000 today. The path was a quick early week flush into the $108,000s, a stabilisation, then a grind back toward the former $112,000 support that now caps rallies. Volatility rose off late August lows, but the move has not expanded into a trend day, which keeps the market in a mean reversion posture until a close reclaims 112,000 or loses 108,000 with momentum.
Source: https://altfins.com/technical-analysis
Market structure remains clear. $112,000 is the first reclaim needed to argue that buyers have retaken short term control, $121,000 is the next pivot before the $124,000 all time high overhang, and $108,000 is the nearest defense that held this week. Below, the $105,000 to $102,000 area aligns with the 200 day moving average watch, with $100,000 as a psychological round number and alert. Acceptance back above $112,000 would turn the prior breakdown into a failed move, a common springboard toward $121,000, while repeated failures under $112,000 keep the tape range bound or leaning lower.
Momentum is neutral to slightly improving. RSI-14 sits mid band, neither overbought nor oversold, consistent with a basing attempt rather than a blow off or capitulation. The MACD histogram has been rising even as the MACD line lags the signal, an inflection pattern that often precedes direction being decided at levels, not by the oscillator alone. The 200 day moving average is still rising, so the long trend remains up, while the 50 day slope is softer, which explains why rallies into resistance have met supply.
Flows strengthened into the week’s back half. Spot ETF tracker shows $332M on Sep 2 and $301M on Sep 3, set against a mixed late August that included −$126M on Aug 29, for a simple 7 day sum near $686M. At a spot near 111,000, that dollar intake is roughly equivalent to about 6,180 BTC of demand, a sizing check only, not a share creation count. The timing lines up with the price stabilisation from the 108,000 low, so continued positive prints would add incremental support to any reclaim of $112,000 and $121,000, while a relapse to persistent outflows would raise the odds of a deeper test toward $105,000 to $102,000.
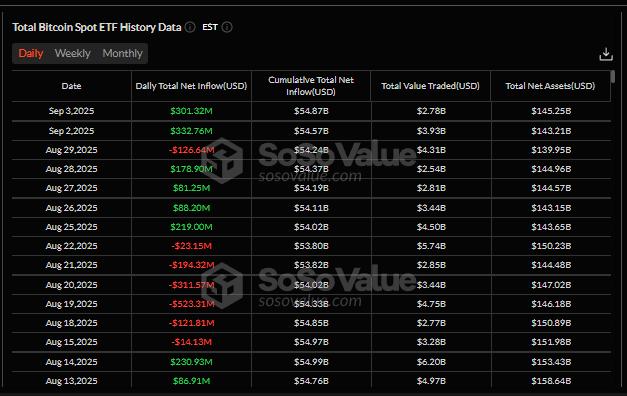
Source: https://sosovalue.com/
Binance liquidity appears constructive, with elevated stablecoin balances suggesting ample dry powder. A BTC to stablecoin reserve ratio drifting toward 1, alongside ERC-20 stablecoin balances reportedly near a record around $37.8B, is consistent with better dip absorption if the change reflects rising stablecoin deposits rather than growing exchange BTC inventory. Historically, when stablecoin balances trend higher while exchange BTC balances are flat or falling, spot share of turnover rises, bid depth thickens, and a 7 to 14 day average of the ratio turns up; in that state, the probability of buy the dip follow through at well watched levels is higher, while heavy ETF outflows, a jump in exchange BTC balances, or a reversal in stablecoin inflows would weaken the setup.
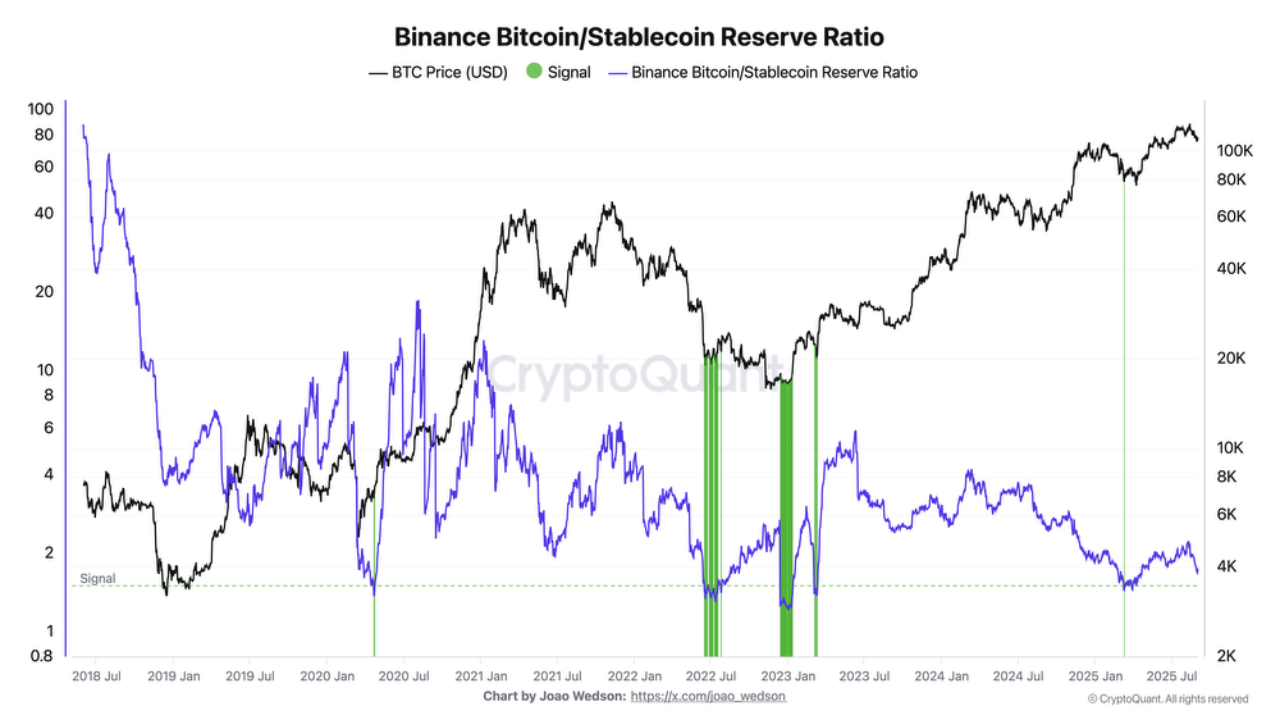
Source: https://cryptoquant.com/insights/
A daily close above $112,000 would likely mark a momentum shift, increasing the probability of follow through toward $121,000 and, if sustained, a retest near $124,000; repeated rejection beneath $112,000 would more likely keep price capped and raise the odds of a drift toward $108,000, with $105,000 and $102,000 as subsequent waypoints and $100,000 in play under stress; if 25 to 50 bps of Fed cuts occur this month, financial conditions typically ease, which historically favors risk assets and would raise the likelihood of bullish continuation, yet confirmation would still be expected via closes back above $112,000 and then $121,000.
Ethereum Market Analysis
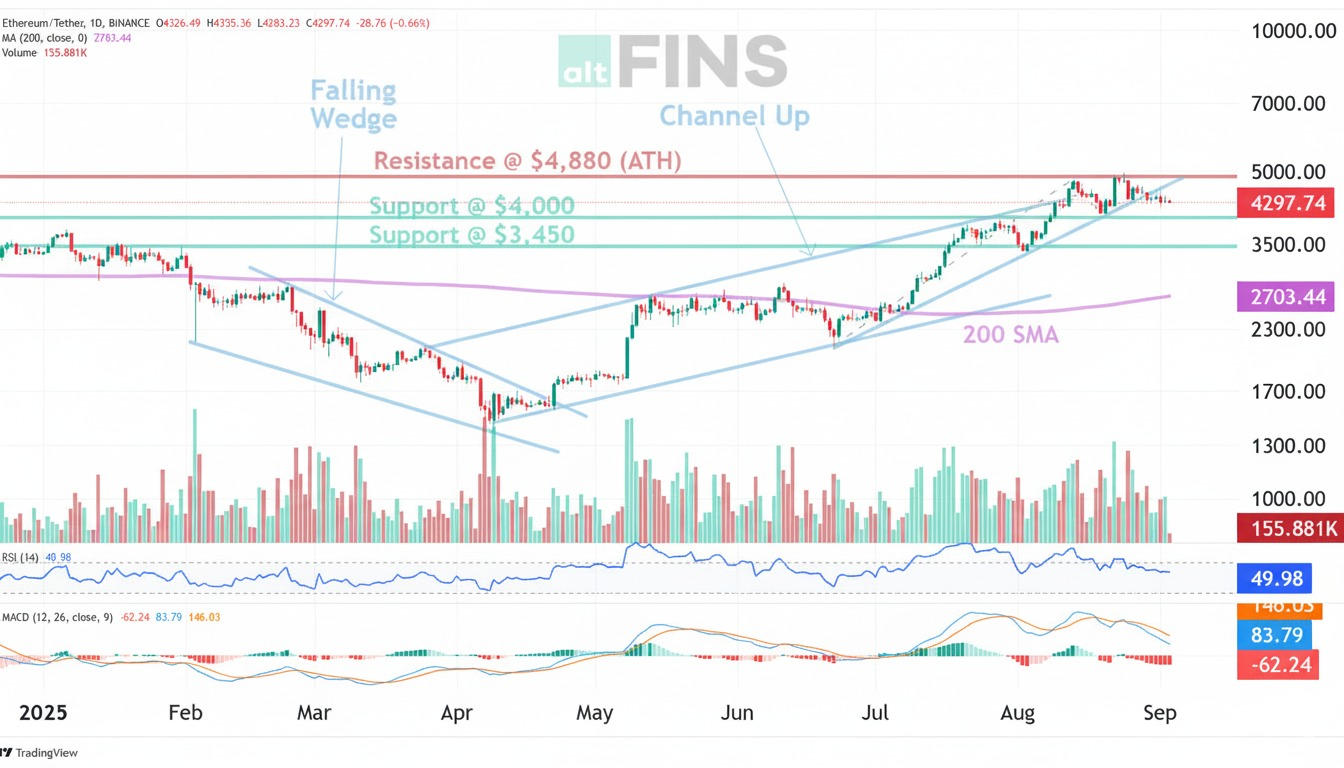
ETH has been consolidating below the late-August all-time high, trading near $4,400, about 11 percent under the August 24 peak around $4,956. The week featured an early pullback followed by tight, range-bound trading, with intraday ranges contained and closes clustering near the volume-weighted mean around $4,445. The short-term change reads modestly negative on the week, while one-month and three-month windows remain strongly positive, which is consistent with a pause inside a larger uptrend.
Source: https://altfins.com/technical-analysis
Market structure is straightforward. On the topside, $4,880, then $5,000, define a decision band where reactions often determine the next leg. Below, $4,000 is the first major support, then $3,450, with an intermediate zone around $3,900 to $3,950 where dip demand has appeared. A daily close above $5,000 would be read as continuation potential toward $5,500, while repeated failures beneath $4,880 to $5,000 keep price range-bound or tilt risk toward a deeper probe of $4,000.
Momentum and trend signals support that binary. RSI reads mid-band, not stretched, and the MACD histogram has been rising even with the line still below the signal, a combination that often hands decision-making to levels rather than to oscillators. Higher-time-frame moving averages slope up, consistent with a strong underlying trend, while some shorter averages have softened during consolidation, which explains why first touches into resistance have met supply. Bollinger Bands currently bracket roughly $4,067 to $4,819, and a one-day true range near $236 implies that a clean breakout would likely need a range expansion beyond recent averages.
Flows are the immediate swing factor. From the SoSoValue screen provided, the most recent four trading prints into September 3 total about −$299,090,000, with outflows on three of four sessions, cumulative spot ETH ETF net inflow around $13,340,000,000, and total net assets near $29,210,000,000. Back-of-envelope, at a spot near $4,400, that weekly net equals roughly the dollar equivalent of 68,000 ETH, large enough to act as a headwind while price presses into $4,880 to $5,000. A flip to consecutive positive daily prints would typically improve the odds that resistance converts to support after a breakout.
Source: https://sosovalue.com/
Positioning and supply dynamics partly offset the soft flow tape. Whale cohorts were reported to have added about 260,000 ETH in 24 hours, exchange reserves sit near a three-year low, and several desks have framed an institutional accumulation theme into Q4. Ether Machine disclosed a 150,000 ETH financing and a treasury near 495,000 ETH, while the Ethereum Foundation plans to sell 10,000 ETH over the coming weeks for grants and R&D. Taken together, float appears to be tightening even with one-off sales, which is usually supportive for buy-the-dip behavior if price confirmation arrives.
strength on a decisive break and hold above $5,000 with room toward $5,500, or value on a constructive dip toward $4,000 for a swing back toward $4,900 if structure holds, with invalidation below $3,450. If a clean close above $5,000 occurs while daily ETF flows flip positive, there is a high chance of continuation toward $5,500. If repeated rejection persists beneath $4,880 to $5,000 while outflows continue, there is a high chance of a drift toward $4,000, with $3,450 as the next guardrail. Alerts can be set at $4,880, $5,000, $4,400, $4,000, and $3,450, and the daily ETF flow tape plus on exchange reserve trend can be used as confirmation filters.
Mark Your Calendars
Economic Data Releases:
- September 10, 2025 (Wednesday): Core PPI
- September 11, 2025 (Thursday): Core CPI
Token Unlock
- September 5, 2025 (Friday): ENA (ENA) unlocks $121.65 M (2.69 % of market cap)
- September 9, 2025 (Tuesday): MOVE (MOVE) unlocks $5.84 M (1.89 % of market cap)
- September 10, 2025 (Wednesday): APT (APT) unlocks $48.63 M (2.20 % of market cap)