Bitcoin Holds Range as Liquidity Pockets Drive Mixed Reaction
25th September 2025 • 9mins read
This Week’s Recap
- Bitcoin ‘buy the dip’ chatter spikes, but liquidity maps point to $107 K as a potential magnet. Analysts note rising “buy the dip” mentions even as order-book heat maps cluster the largest liquidity near $107 000. That setup implies residual downside risk until those pockets are tested or cleared.
- Bitcoin Bollinger Bands tighten to records as traders eye $107 K ‘max pain’ into a giant options expiry. A historically narrow Band read coincides with a large options expiry whose max-pain sits near $107 000. Such conditions often precede a bigger directional move once positioning resolves.
- Crypto liquidations top $1.8 B as BTC slips below $112 K. More than 370 000 traders were liquidated in one of the year’s largest long wipeouts, led by ETH and BTC perps. Leverage reset can stabilize markets, but some desks still map potential probes toward the $103 K–$105 K zone.
- Networking research aims to ease Ethereum’s “gossip” bottleneck. Academics and builders are testing coded propagation layers that reduce message redundancy and latency across Ethereum’s P2P network. Faster propagation can improve confirmation times and reduce gas spikes during stress. Core-devs will weigh feasibility alongside other networking upgrades.
- BitMine boosts ETH treasury; stock slides after share-sale funding. The firm disclosed more than $10 billion in ETH after a fresh $1.1 billion purchase, partially financed via equity issuance. It is now the largest public-company ETH treasury, concentrating exposure and raising dilution questions.
- SEC chair floats an “innovation exemption” for digital assets by year-end. Chair Paul Atkins said the agency will consider an exemption to accelerate compliant product launches under time-boxed oversight. A formal pathway could reduce reliance on bespoke relief and shorten approval cycles.
- SEC approves generic listing standards, paving faster path for spot crypto ETPs. Exchanges can now list qualifying commodity-based spot ETPs without case-by-case Commission orders. The change materially shortens timelines and widens the universe beyond BTC and ETH.
- SEC okays Grayscale Digital Large Cap, first U.S. multi-asset crypto ETP. The fund offers diversified exposure across BTC, ETH, XRP, SOL, and ADA under the new framework. It signals regulatory comfort with basket products tied to top-cap assets.
- SEC-CFTC ‘harmonization’ roundtable adds major exchange executives. Kraken and Crypto.com leaders will join panels discussing alignment across spot, derivatives, and market-integrity oversight. Better coordination can reduce duplicative compliance and clarify product pathways.
- GSR files for ETFs tied to crypto treasuries, staking and ETH exposures. GSR submitted a Digital Asset Treasury Companies ETF alongside four Ethereum and staking-focused funds. If cleared, these products broaden institutional access and create an equity proxy for crypto-treasury exposure.
- Chinese EV maker Jiuzi approves $1 B bitcoin treasury plan. Jiuzi’s board authorized a treasury policy that can allocate up to $1 billion into bitcoin and select crypto assets. The move adds another potential corporate buyer to the top-coin demand base.
- UK-listed B HODL kicks off treasury with 100 BTC (~$11.3 M). The firm began its strategy with a 100 BTC purchase, launching a public-company bitcoin reserve program. Staged accumulation by smaller treasuries can provide incremental spot demand and signaling effects.
- Strive to acquire Semler Scientific, targeting >10,900 BTC post-close. The all-stock deal folds Semler’s diagnostics business into a bitcoin-focused company while aggregating a larger corporate BTC treasury. It exemplifies M&A used to scale balance-sheet bitcoin exposure and create equity proxies for BTC. Shareholder votes, regulatory clearances, and post-close treasury disclosures are the next gates.
- Coinbase backs Bastion in $14.6 M raise for stablecoin infrastructure. The round supports white-label issuance and enterprise tooling aimed at improving on/off-ramp reliability and settlement. Stronger stablecoin rails can tighten spreads, deepen liquidity, and reduce friction for top-coin flows.
Bitcoin Market Analysis
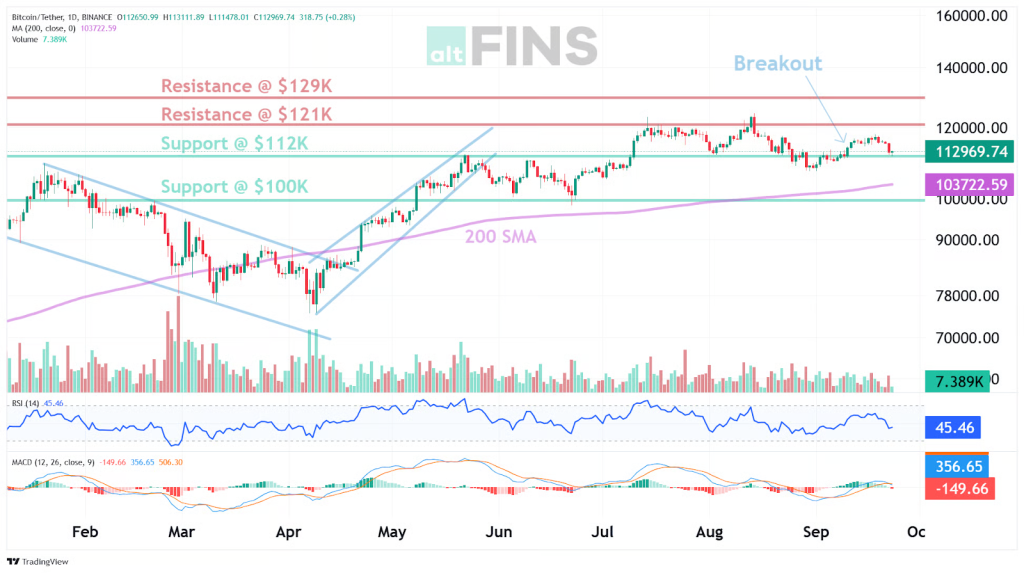
Bitcoin traded within a contained range this week, largely between $111,000 and $117,000, following a retreat from the $117,000s. Intraday prints showed a high near $113,953 and a low near $111,071, with price hovering just above the $112,000 pivot. One-week change registered near -4.9% on the provided feed, consistent with digestion rather than a decisive trend break.
Source: https://altfins.com/technical-analysis
Momentum and structure presented a mixed profile. RSI-14 sat in mid-range, MACD leaned bearish, ADX read weak, and Stochastic RSI fast registered oversold, a combination associated with reactive bounces inside range rather than impulsive trend moves. Bollinger Bands remained tight, roughly $110,100 to $118,362, while spot held below VWMA near $114,396. ATR near 2,265 indicated modest directional energy unless volatility expanded.
Key prices were clearly defined. Support sat at $112,000, with additional interest mapped around $105,000 to $103,000, then $100,000, and the 200-day near $103,723. Resistance aligned at $121,000, then $124,000, then $129,000. Expectations, conditional on levels: holding $112,000 tended to favor mean reversion toward $118,000 to $121,000; a daily close below $112,000 introduced risk of a probe toward liquidity pockets near $107,000, with $105,000 to $103,000 considered if selling extended; a daily close above $121,000 reopened $124,000 and $129,000.
Source: https://sosovalue.com/assets/etf/us-btc-spot
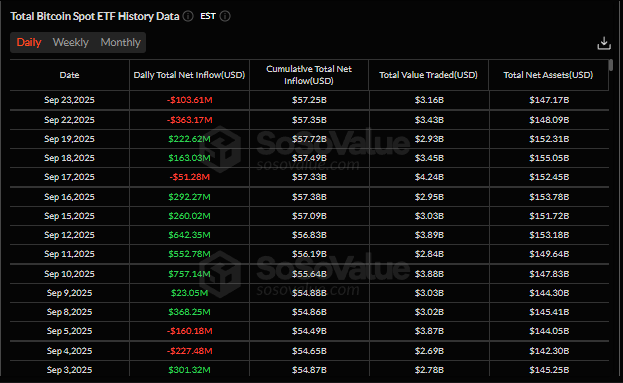
Spot ETF flow data provided the fund flow backdrop. Over the last seven trading days, a net $450.06M was recorded, averaging $64.29M per day; however, the two most recent sessions showed a combined -$466.78M. Against reported AUM near $147.17B on Sep 23, that two-day outflow equated to roughly 0.32%, a size that leaned the short term toward downside liquidity without implying disorderly conditions absent persistence.
Positioning and narrative elements aligned with those levels. “Buy the dip” mentions reportedly increased, order book heat maps clustered sizeable liquidity near $107,000, and a large options expiry carried a max-pain near the same level. A liquidation wave near $1.8B reset leverage and often stabilizes subsequent trading, yet untested liquidity pockets left residual downside risk. Improvements in flows alongside a hold of $112,000 would be consistent with a return toward $118,000 to $121,000; persistent outflows and a daily close below $112,000 would keep a $107,000 test in focus.
Ethereum Market Analysis
Price this week was defined by a broad, two way range, with trading mostly between about $4,080 and about $4,640, and a net decline near 13% measured from the Sep 18 close to the Sep 24 close. Intraday volatility increased, with repeated tests near $4,100 forming a provisional floor while lower highs developed through midweek. With the August all time high near $4,956 still overhead, the wider bullish context remained intact even as near term pressure persisted.
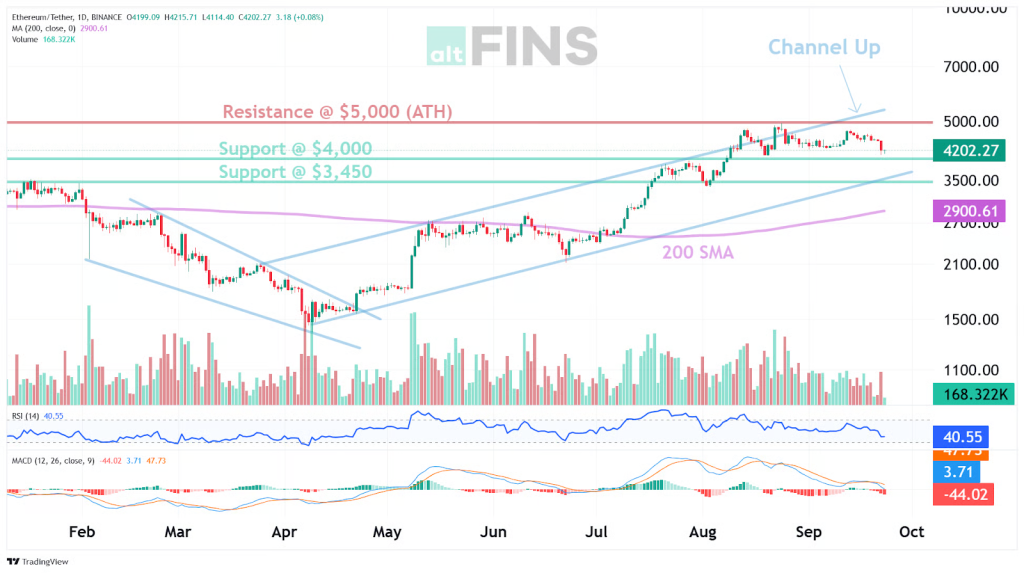
Against this backdrop, the technical pivot centered on $4,420 to $4,450, where acceptance would indicate momentum repair and improved breadth. Daily momentum stayed soft, reflected by RSI readings in the low 30s and a negative MACD on common settings. The lower Bollinger Band near $4,077 served as a tactical gauge, since closes back inside the bands after touches often tilt probabilities toward mean reversion and reduce the odds of immediate continuation lower.
Within this context, resistance, support, and expectation were mapped with $5,000 as the nearest resistance, then $5,500 as a continuation objective if acceptance developed above the round number. Support sat at $4,000, then $3,450 as a deeper demand shelf that aligns with prior value. A sustained hold above $5,000 would favor continuation toward $5,500, while controlled probes into the $4,000 zone would be evaluated for a swing retrace toward $4,900, with invalidation placed below $3,450 on a closing basis.
Source: https://sosovalue.com/assets/etf/us-eth-spot
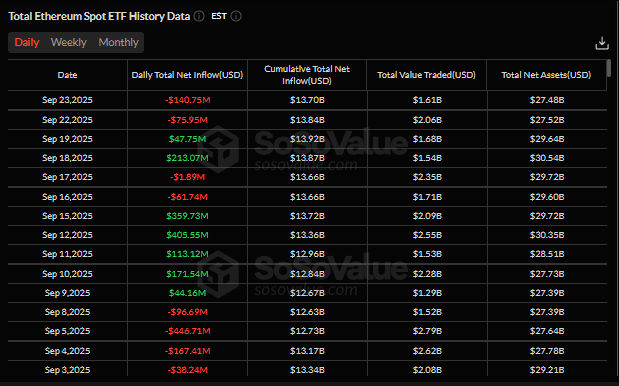
Complementing price action, spot ETF flows over the most recent seven trading days summed to approximately +$340,220,000. Large creations appeared on Sep 15 at about +$359,730,000 and on Sep 18 at about +$213,070,000, followed by redemptions on Sep 22 at about −$75,950,000 and on Sep 23 at about −$140,750,000. Total value traded across the window was about $13,040,000,000, averaging roughly $1,860,000,000 per day, while reported total net assets eased toward about $27,480,000, consistent with spot softness and range compression.
In this setting, the news flow pointed to medium term catalysts rather than immediate triggers. Networking research aimed at reducing redundant gossip traffic and shortening propagation times was highlighted, a change that could improve confirmation latency and moderate gas spikes during stress if adopted. A sizable public treasury accumulation of ETH was disclosed alongside equity issuance, concentrating exposure and inviting dilution considerations for shareholders, while adding a visible buyer to spot. Vitalik Buterin emphasized that low risk DeFi, rather than memecoins, offers a more durable base for Ethereum’s fee economy. Validator exit dynamics remained a watch point, with an unstaking backlog near 43 days and a notional near $11,300,000,000, a factor that may limit upside while withdrawals clear.
SEC Streamlines Spot ETPs
The U.S. Securities and Exchange Commission approved generic listing standards in mid-September 2025 for commodity-based exchange traded products on Nasdaq, NYSE Arca, and Cboe BZX. Under these standards, qualifying spot commodity and crypto ETPs can list without a separate Section 19(b) filing for each product, with exchanges instead relying on Rule 19b-4(e) and posting specified product information within five business days of the first trade. The Commission granted accelerated approval after notice and comment, and commissioners issued statements outlining the scope and disclosure obligations.
The change shortens timelines and reduces procedural friction, replacing the prior case by case pathway that often stretched to many months. Reporting notes that approval windows can compress to roughly 75 days when products meet the generic criteria, a material improvement versus older processes. Early coverage and legal analyses frame the move as a significant policy shift that enables faster, more predictable listings for crypto ETPs, while products outside the criteria must still use the traditional route.
Market implications include a broader menu of spot crypto exposures, quicker iteration by issuers, and potential migration of liquidity across ETFs, futures, and spot markets. Equity moves among crypto exposed companies and exchange operators were attributed in part to the rule change, which investors viewed as supportive for new issuance and trading activity. The formal record in the Federal Register, along with the SEC press materials, provides the operative details for compliance and surveillance requirements that exchanges must implement.
Mark Your Calendars
Economic Data Releases:
- September 26, 2025 (Friday): PCE index
- September 26, 2025 (Friday): Core PCE index
- October 3, 2025 (Friday): U.S. employment report
- October 3, 2025 (Friday): U.S. unemployment rate
Token Unlock
- September 25, 2025 (Thursday): VENOM (VENOM) unlocks $8.10 M (2.28 % of market cap)
- September 26, 2025 (Friday): TRIBL (TRIBL) unlocks $72.93 K (1.96 % of market cap)
- October 1, 2025 (Wednesday): SUI (SUI) unlocks $143.86 M (1.23 % of market cap)