Bitcoin Opens Bullish in October
2nd October 2025 • 10mins read
This Week’s Recap
- Bitcoin steady, Bitfinex warns of downside risks as U.S. government shutdown looms: Bitcoin held firm while Bitfinex cautioned that a shutdown could delay key data releases, raising volatility risk. Market breadth weakened across majors even as BTC stabilized into month end. Traders are watching liquidity pockets and options positioning into early October.
- BTC kicks off Uptober with a break above $116,000 as crypto equities rally pre-market: Bitcoin and ether rallied alongside record gold, lifting U.S. crypto-linked stocks before the open. Seasonality and improved risk appetite supported the bounce after September’s shakeout. Attention shifts to whether flows and derivatives metrics confirm follow-through.
- K33, Asia holiday lull and U.S. shutdown could sap early-October liquidity: Analysts warned that Golden Week in Asia, combined with a U.S. government shutdown, may thin books and delay data. Reduced depth can magnify price swings around options expiries. Desks are preparing for wider bid-ask spreads and cautious sizing.
- Grayscale flags Q4 crypto risks despite macro tailwinds: Grayscale said Fed cuts and regulatory progress are supportive, but slowing growth and political hurdles could cap upside; investors should watch how macro data and policy timelines interact with flows in October.
- Ethereum dips below $4,000 amid macro jitters and slowing ETF inflows: The Block reported ETH briefly lost the 4,000 level as risk sentiment weakened and ETF momentum cooled, highlighting leverage sensitivity into late September. (
- Bit Digital proposes $100 M convertible note raise for its ETH strategy: The ETH-treasury firm filed to sell up to $100 million in convertible notes, with a $15 million greenshoe, to expand ether holdings, adding balance-sheet leverage to its accumulation approach.
- Ethereum Foundation appoints leaders for its Privacy Research Cluster: New appointments will coordinate privacy work across Ethereum, focusing on cryptography, private computation, and secure scaling.
- Ethereum October outlook, conflicting supply and demand signals: BeInCrypto flags weakening demand and rising supply pressures for October, with ETF outflows and soft network growth tempering upside.
- Bullish launches U.S. spot crypto trading after NYDFS approval: Bullish begins U.S. spot trading after securing BitLicense and money transmitter approvals, adding a regulated venue for institutions and advanced traders.
- U.S. Treasury softens crypto tax exposure under CAMT: Treasury clarified that unrealized digital asset gains are excluded from CAMT calculations, easing potential tax burdens for corporates holding crypto.
- Government shutdown could delay listing dates for new crypto ETFs: A federal shutdown is likely to slow SEC operations, introducing timing risk for ETF listings even if approvals are granted.
- CoinShares to acquire Bastion to push active crypto funds: The acquisition expands CoinShares’ U.S. footprint and adds Bastion’s quantitative strategies, supporting a shift toward actively managed digital asset products.
- Canton Network activity surges past 500,000 daily transactions, Copper says: Copper reported Canton exceeding 500,000 daily transactions with participation from major banks and U.S. exchanges, a notable enterprise-blockchain adoption datapoint.
- $21 M in crypto stolen from addresses tied to SBI Crypto, says ZachXBT: On-chain sleuth ZachXBT flagged roughly $21,000,000 moving from SBI-linked addresses and through Tornado Cash, prompting security scrutiny.
- Solana ETF issuers gear up for SEC approval as soon as next week, sources say: If approvals land, SOL gains a regulated distribution channel that can pull flows from U.S. wealth platforms, but a shutdown or thin market depth could blunt day-one liquidity, so watch seed size, authorized participant lists, and options market readiness.
- Deutsche Börse partners with Circle on EURC and USDC rollout under MiCAR: This ties compliant stablecoins directly into a major European market operator, improving fiat rails for tokenized assets; near term, expect pilots in settlement and custody, medium term, this lowers friction for euro-denominated on-chain money markets.
- Circle expands $635 M tokenized Treasury fund, USYC, to Solana: Bringing USYC to a high-throughput chain positions Solana for on-chain cash management use cases, enabling faster mint-redeem cycles and composability with DeFi, with the key metric to track being primary dealer participation and secondary market turnover.
- Bitcoin options tied to BlackRock IBIT are now Wall Street’s favorite: IBIT-linked options concentrating open interest shifts volatility pricing from offshore venues to U.S. desks, which can anchor gamma around ETF strikes; watch skew, dealer positioning, and how roll activity around month-ends steers spot.
- Phantom unveils Phantom Cash on Stripe’s Open Issuance: A wallet with native Stripe-powered issuance reduces the lift for merchants to accept stablecoin payments, tightening the loop between consumer wallets and checkout, with adoption hinging on KYC flows, chargeback handling, and interchange economics.
Bitcoin
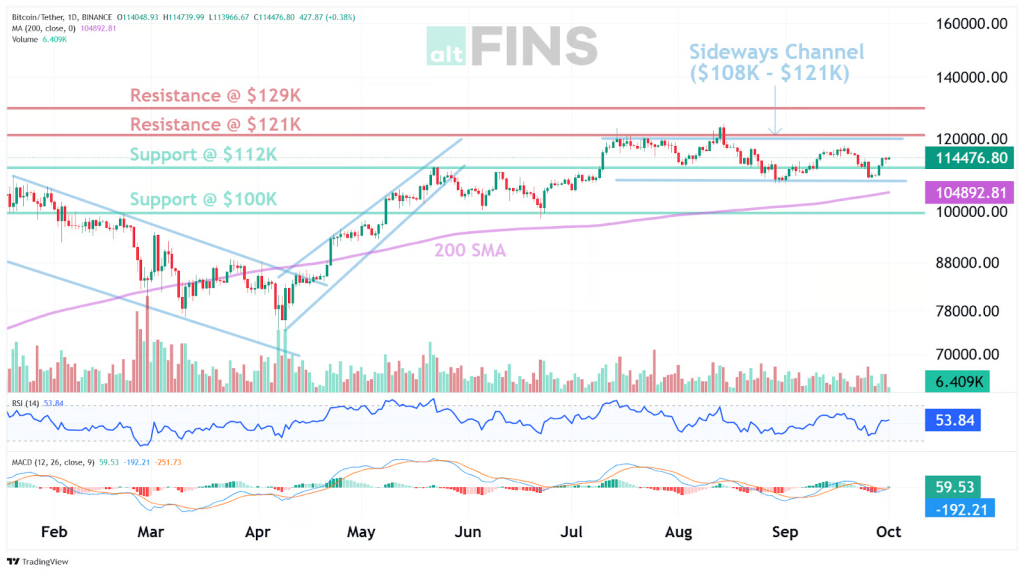
Price advanced from the late-September low near $108,673 and worked back toward the upper frame around $119,419, finishing close to $118,600 for a roughly 5 % weekly gain. Technical analysis shows this recovery unfolding inside the same multi-week band that has contained price since the $124,000 peak, with intraday swings still consistent with an Average True Range near $2,536. A volume-weighted moving average around $114,048 acted as a mid-range pivot during the climb, with demand repeatedly showing up above that line.
Source: https://altfins.com/technical-analysis
Momentum indicators help explain why price continues to respect the band . This places price within a sideways channel between $108,000 and $121,000, while RSI 14 remains neutral, MACD leans positive, and ADX stays weak, a combination that favors rotations rather than trend acceleration. The 200-day SMA sits near $104,900 and continues to slope higher, which preserves a constructive long-term backdrop as Bollinger Bands cluster near $109,132 and $119,669, a containment that matches current compression.
Attention then falls to the levels that matter most for decision making. Supply has been active near $121,000, followed by the prior high at $124,000 and a secondary band at $128,000 to $129,000 where offers previously capped advances. Demand has been most reliable near $112,000 and $108,000, with $100,000 as the deeper round-number magnet if the range fails. Base case remains range first, acceptance above $121,000 with improving breadth and spot participation would set a path toward $124,000 and then $128,000 to $129,000, while rejection near $121,000 would likely rotate price toward the $114,000 pivot and then $112,000.
Source: https://sosovalue.com/
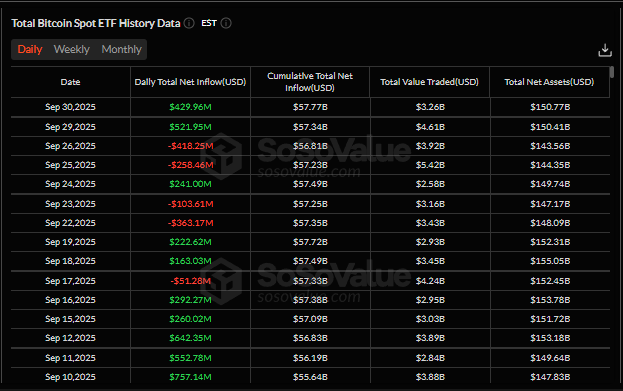
Flow data helped validate the late-week push. SoSoValue data showed a turn from outflows on Sep 25 (−$258.46 M) and Sep 26 (−$418.25 M) to sizeable net inflows on Sep 29 (+$211.95 M) and Sep 30 (+$429.96 M). By Sep 30, cumulative net inflows reached $57.77 B and total net assets stood at $150.77 B. This shift aligns with stronger risk appetite into month end and the start of October, and it provides sponsorship for tests of the upper boundary.
Macro conditions framed trading behavior rather than dictating it. Desk commentary around a potential U.S. government shutdown and Asia’s Golden Week pointed to thinner books and possible delays in data releases, a mix that can widen spreads and amplify moves around options events. In that setting, confirmation of any break remains dependent on continued positive ETF prints, stable to positive funding, and open interest that rises without overheating.
Source: XWIN Research Japan | https://cryptoquant.com/
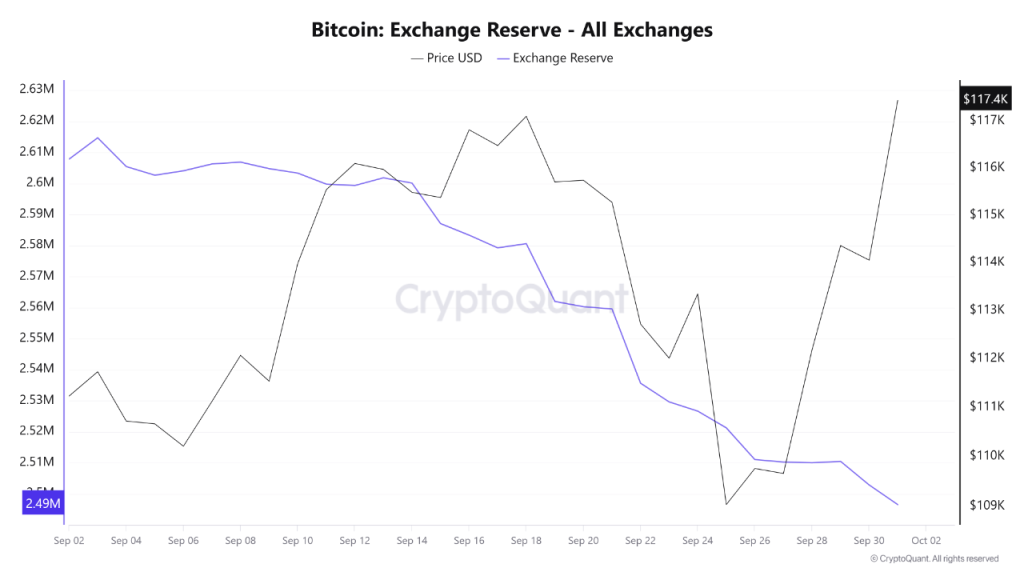
News flow rounded out the picture and intersected cleanly with on-chain dynamics. Bitfinex highlighted that a shutdown could heighten volatility even as price held firm into month end, while seasonality and improved risk appetite supported the early October bounce alongside gains in crypto-linked equities. K33 and others cautioned that holiday effects could sap early-month liquidity, and Grayscale balanced supportive policy progress with slower growth and political hurdles as Q4 considerations. Exchange reserves falling from about 2.61 M BTC in early September to about 2.49 M BTC by October 1, a gradual supply contraction on exchanges that complements the range-first technical view and helps explain why dips continued to find demand.
ETHEREUM
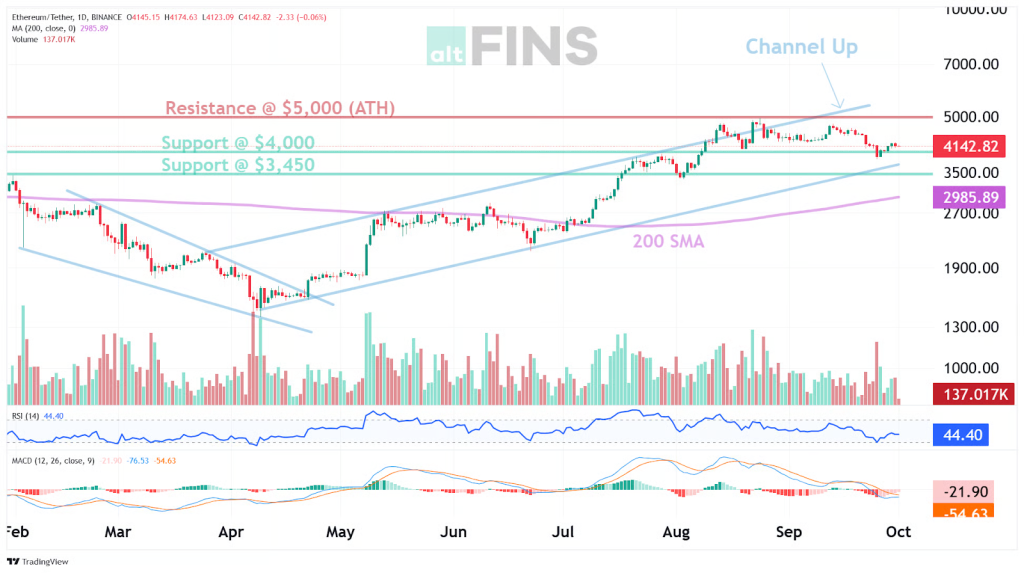
ETH traded in a constructive yet uneven band this week, with prints between about $4,123 and $4,402 and closes edging into the low $4,300s by week end. Price depicts a rising channel that remains intact, and that structure helps explain why intraday dips were absorbed while momentum cooled. Volatility rose relative to early September, yet the prior breakdown zone was reclaimed, so the recovery sequence of higher lows stayed in place.
Source: https://altfins.com/technical-analysis
Trend and momentum still lean bullish on higher time frames, which is consistent with the channel view. Daily MACD remains positive, RSI sits in a neutral band, and ATR is elevated, a mix that argues for wider swings without a confirmed trend change. The 200 day SMA near $2,985, is well below spot, so the long term slope stays constructive even as the market consolidates after the all time high at $4,956.
Levels continue to define the near term path. First support sits near $4,000, with secondary support near $3,450 where polarity and the channel lower bound converge. Overhead, $4,350 to $4,500 acts as near term supply, and $5,000 remains the cap with $4,956 as the stretch objective. Base case favors range behavior between $4,000 and $4,500 while momentum resets; acceptance above $4,500 would reopen $4,900 to $5,000, while a decisive loss of $4,000 would refocus $3,450.
Source: https://sosovalue.com/assets/etf/us-eth-spot
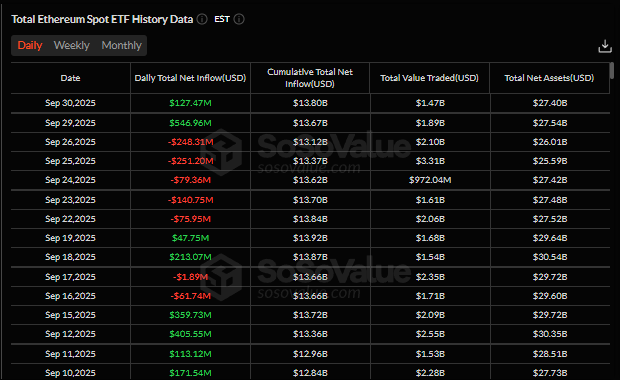
Flows from spot ETH ETFs, weakened into September 22 to September 26, including notable outflows near $251.20 M and $248.31 M on September 25 and September 26; creations returned on September 29 and September 30 near $546.96 M and $127.47 M. Cumulative net inflows hovered around $13.80 B, and total net assets around $27.40 B in that snapshot. Interpreted in sequence, the products appeared to follow price stabilization rather than lead it, so sustained progress through resistance likely requires steadier daily creations or stronger spot demand.
Source: @BorisD | https://cryptoquant.com/
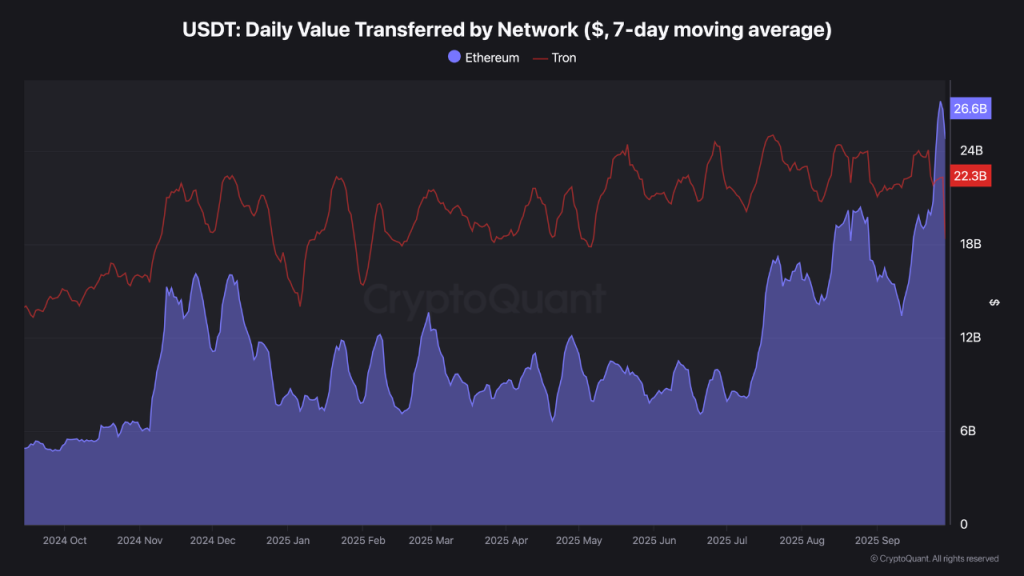
Stablecoin flows provided a contrasting signal. USDT settlement on Ethereum surged to about $26.6 billion in daily value transferred, seven-day average, while Tron flows held steady near $22.3 billion. This tilt in liquidity toward ETH often coincides with risk appetite expanding into leverage and broader alt participation, provided it is confirmed by sustained open interest growth and neutral to positive exchange netflows. If the tilt endures, Ethereum can regain leadership as the anchor of risk-on rotation.
News and fundamentals framed a balanced risk picture that fits those signals. Reports noted a brief loss of the $4,000 handle amid softer risk appetite and slowing ETF momentum into late September; Bit Digital filed to raise up to $100,000,000 in convertible notes, with a $15,000,000 greenshoe, to increase ether holdings; the Ethereum Foundation appointed leaders for its Privacy Research Cluster. Data show a validator unstaking backlog of about 2.48 M ETH, roughly $11.3 billion, with an estimated 43 day queue, a potential supply headwind at resistance until absorbed. Taken together, price trades with constructive higher time frame structure, inconsistent ETF demand, and improving on chain liquidity, leaving $4,000 and $4,350 to $4,500 as the key battlegrounds for the next directional move.
CryptoQuant opens Q4 with a constructive, data anchored thesis, arguing Bitcoin reentered a favorable regime after reclaiming the trader’s realized price area near $116,000 and showing expanding spot demand since July, with seasonality and MVRV dynamics historically supporting year end strength; their Oct 1 research note, “This Time is Not Different, Positive Bitcoin Fundamentals in Q4,” lays out the framework, while companion Quicktake posts track the late September rebound that preceded the October pop, giving you specific on chain checkpoints to validate through funding, open interest, and net creations.
Kaiko’s Sep 30 Data Debrief adds a derivatives lens, documenting that IBIT options on Cboe traded at a protection premium versus crypto native venues, a sign that hedging tied to U.S. spot ETF exposures is migrating into listed markets, which can pull skew and gamma toward ETF strikes and influence intraday ranges; the implication for Q4 is straightforward, onshore options activity may increasingly set the volatility tone around key dates and levels, so combine this with spot depth checks when mapping breakout risk.
CoinShares’ Sep 29 Fund Flows report frames the flow backdrop at the quarter turn, recording about US$812,000,000 of weekly outflows led by the U.S., with year to date inflows still near US$39,600,000, and a notable counterpoint of US$291,000,000 into Solana ahead of expected U.S. product launches; taken together, the data suggest Q4 begins with strong structural sponsorship under the surface, but near term positioning is sensitive to macro and listing timelines.
Mark Your Calendars
Economic Data Releases:
- October 3, 2025 (Friday): U.S. employment report
- October 3, 2025 (Friday): U.S. unemployment rate
- October 8, 2025 (Wednesday): Minutes of Fed’s September FOMC meeting
Token Unlock
- October 2, 2025 (Thursday): IMX (IMX) unlocks $17.73 M (1.26 % of market cap)
- October 2, 2025 (Thursday): MOCA (MOCA) unlocks $188.74 K (1.28 % of market cap)
- October 9, 2025 (Thursday): LINEA (LINEA) unlocks $29.03 M (6.57 % of market cap)