Largest One Day Liquidation, Tariffs Whipsaw Crypto
16th October 2025 • 10mins read
This Week’s Recap
- Trump tariff threat knocks Bitcoin lower: Bitcoin fell sharply after a renewed 100% tariff threat on China escalated risk-off sentiment. The move triggered broad de-risking across crypto and equities as traders repositioned for tighter global trade conditions. Watch for policy follow-through and liquidity signals from futures and ETF flows. (
- Record crypto liquidations wipe out long positions: An estimated multi-billion dollar cascade of forced unwinds hit perpetuals, amplifying Bitcoin’s downside. The event reset leverage and pushed funding deeply negative across venues. Next, monitor open interest rebuild and basis normalization for signs of stabilization.
- China’s retaliation keeps BTC under pressure: After counter-measures from China, Bitcoin extended losses alongside broader risk assets. Derivatives data showed continued long-side pain with hundreds of millions in fresh liquidations. Traders look to policy headlines and USD strength for the next impulse.
- Ethena’s USDe briefly depegs during the rout, then recovers: A knee-jerk flight from risk pushed the yield-bearing stablecoin off par on one exchange before parity returned. Protocol communications emphasized collateralization and redemption stability. Markets will gauge liquidity resilience across ETH-centric stables in future stress.
- Traders shift ETH options toward downside protection: Post-selloff positioning showed demand for ETH puts at lower strikes. The skew change reflected hedging over outright de-risking in spot. Next, watch implied vol decay and roll-down for clues of risk appetite returning.
- Japan moves to ban insider trading in crypto: Policymakers outlined plans to apply insider-trading prohibitions to digital assets. The proposal targets information asymmetries similar to equities to bolster market integrity. Industry will track draft language and enforcement mechanics.
- Exchange practices under scrutiny amid listing allegations: A major exchange rebutted claims about profiting from token listings, calling them defamatory. Listing governance remains a focus area for regulators and institutions. Expect continued pressure for transparent criteria and disclosures.
- Bitwise CIO frames the crash as a temporary dislocation: A leading ETF issuer argued fundamentals remain intact despite volatility. The view emphasizes liquidity shock rather than demand destruction. Investors will watch whether net inflows resume into spot products.
- Institutions expected to double digital-asset exposure over three years: A new survey pointed to portfolio weights rising from mid-single digits to mid-teens. Drivers include tokenization rails and clearer policy direction. Execution hinges on custody, compliance, and risk budgeting.
- ETF flow watch remains the top barometer for risk-on demand: Analysts reiterated the primacy of spot ETF net flows after the leverage reset. Persistent inflows historically correlate with improving breadth. Daily prints this week will signal whether institutions are buying the dip.
- Stablecoin infrastructure eyes public-market visibility: A stablecoin-focused payments firm advanced toward a U.S. listing, signaling maturing rails. Public listings may improve transparency and capital access for fiat-onchain bridges. Investors will assess revenue mix and regulatory posture at listing. (
- Tariff headlines whipsaw risk assets and crypto: Elevated trade tensions set off cross-asset de-risking that hit BTC and ETH. Dollar strength and equity weakness compounded selling pressure. Markets will trade headline-to-headline until policy path is clearer.
- Explainer: how liquidation engines magnified the crash: A breakdown of perp mechanics detailed why volatility spiked beyond spot supply/demand. Forced unwind loops created air-pockets as bids vanished. Better transparency on leverage and circuit-breakers could dampen future cascades. (Decrypt)
- CZ pardon chatter surfaces alongside market turmoil: A media report suggested potential executive clemency discussions for a major exchange founder. While not market-determinative, such headlines can sway sentiment around enforcement risk. Any confirmation or denial would be closely watched by large holders.
Bitcoin Market Analysis
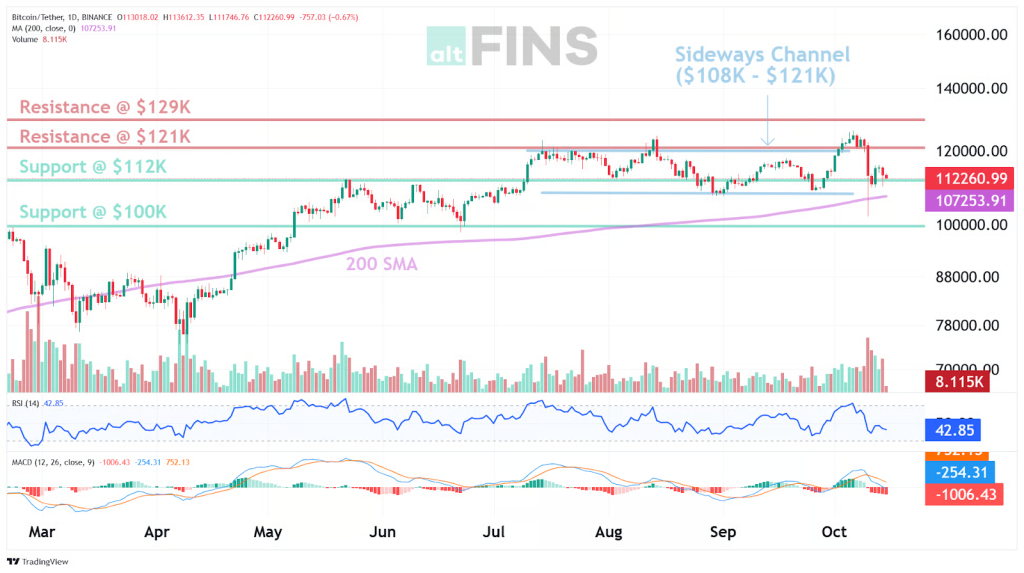
Across the most recent seven completed sessions, BTC was marked down from 123,337.6 on October 9 to 110,767.4 on October 15, a decline of 10.19 percent, while a range between 123,710.9 and 103,893.3 was registered. Price action traced a sharp liquidation break followed by stabilization near 112,000, then a cautious drift as leverage reset. This sequence was consistent with forced unwinds giving way to selective dip demand, without decisive evidence of a full trend failure. The week, taken in aggregate, read as a stress test rather than a structural top, provided demand continued to appear between 106,000 and 112,000.
Source: https://altfins.com/technical-analysis
Technical conditions were characterized by a short term downtrend, a medium term uptrend, and a long term strong uptrend. RSI on a 14 period basis sat within a neutral band, while MACD and momentum skewed lower, and realized volatility, proxied by ATR near 4,164, remained elevated but manageable. Bollinger bands framed trade near 106,975 on the lower side and 126,791 on the upper side, keeping price contained inside the envelope after the break. The 200 day region around 106,000 was approached, which often attracts mean reversion flows when momentum cools and positioning lightens.
Key levels were clearly defined, with support at 112,000 and 106,000, broader support at 100,000, and resistance at 121,000 followed by 128,000. A base case of consolidation between 106,000 and 121,000 was inferred while leverage reset and momentum rebuilt. Continuation would be indicated by acceptance through 121,000 with follow through toward 128,000, while a daily close beneath 106,000 would be expected to expose 100,000 and force reassessment of risk. In practice, levels were treated as decision points where flows, derivatives posture, and tape behavior were compared before action was taken.
Spot ETF flows over the latest seven entries summed to plus 1,552.76 million, with an average of plus 221.82 million per day, five positive prints, and two negative prints, including a single day outflow of minus 326.52 million. Short window momentum remained negative on a rolling three day basis, which argued for patience despite a constructive seven entry regime. A higher quality turn would be evidenced by two consecutive positive prints or a flip in the three day sum back above zero while price held the 106,000 to 112,000 area. Under those conditions, recovery attempts would be afforded more credibility and resistance near 121,000 would be expected to weaken.
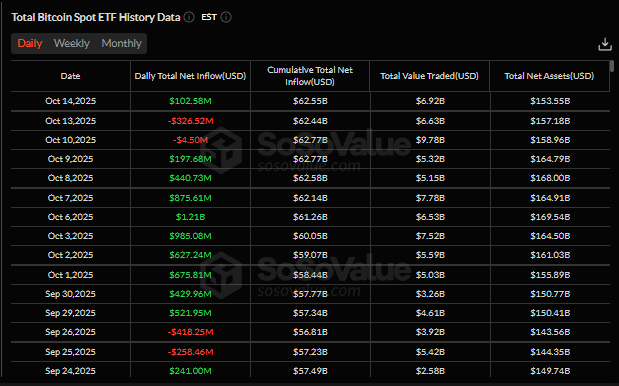
Source: https://sosovalue.com/assets/etf/us-btc-spot
Regarding shutdown risk, direct attribution to price behavior could not be established here, although sensitivity to liquidity proxies remained evident. During periods when policy uncertainty rises, dollar tone, funding, and open interest have tended to soften together, and risk assets have usually reflected that tightening. In such conditions, tighter risk has been warranted while price sits below 112,000 and short window flows remain negative, with a bias to re-expand exposure only after those proxies normalize in concert. The reaction function, in effect, has been governed by liquidity confirmation rather than headline appearance.
Source: https://cryptoquant.com/
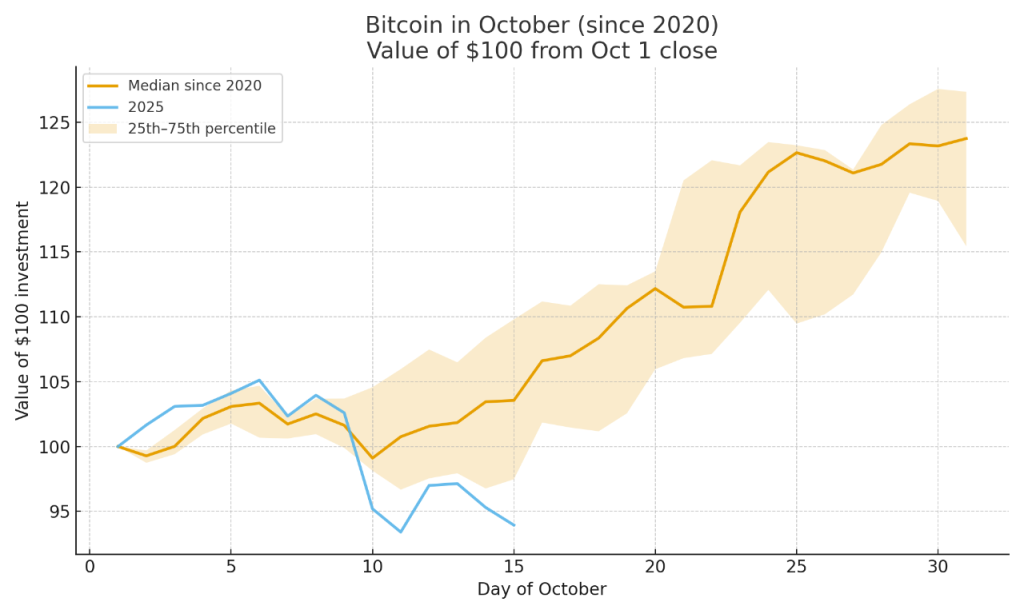
The broader news backdrop featured renewed tariff threats that heightened risk aversion, a pronounced liquidation cascade that reset leverage, and subsequent policy signals that kept volatility elevated, while USD strength intermittently pressured crypto beta. The combination produced a swift high to low swing, short window ETF outflows, and then a tentative stabilization. Forward focus remained on three pillars that tend to lead turns, daily ETF net flow returning to consistent positives, funding lifting from negative toward flat while open interest rebuilds without fresh lows, and daily acceptance back above 112,000 with progression toward 121,000. If these confirmations align, late October seasonality may act as a tailwind, with 128,000 as the next decision area.
Ethereum Market Analysis
ETH traded in a wide weekly range, with a high at 4,393.63 and a low at 3,471.22, and the latest daily close printed near 4,017.28. A sharp intraday drawdown early in the week was followed by a partial recovery, and derivatives activity stayed heavy, with futures turnover near 108,000,000,000 over the most active sessions. The tape therefore reflected a classic liquidation and stabilization sequence, where forced selling was met by opportunistic bids. The balance of evidence suggested that volatility remained elevated, yet selling pressure had moderated into the close.
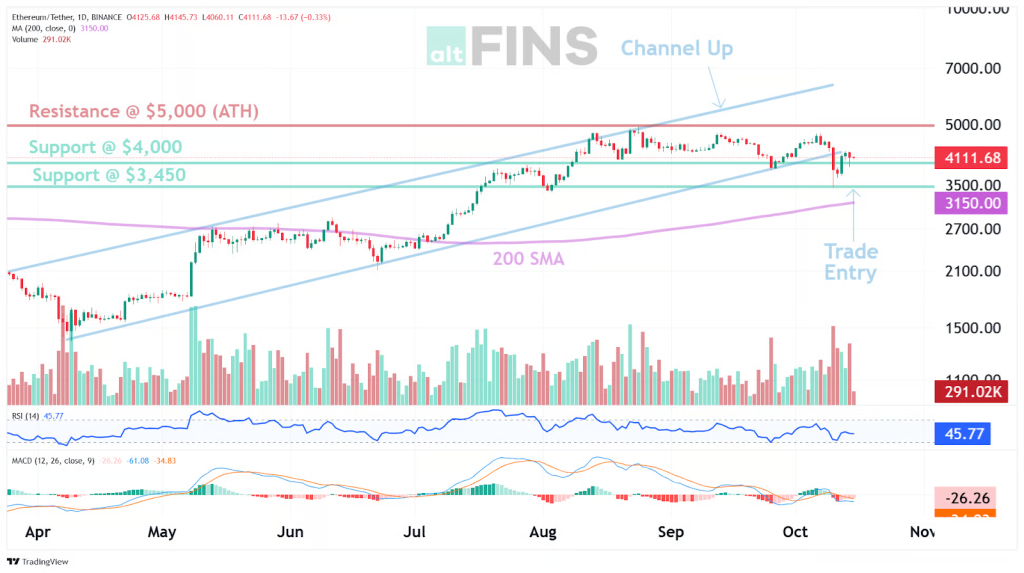
Technical signals were mixed but readable, with long term momentum intact and short term momentum weak. RSI readings sat in neutral territory, the MACD remained below its signal with that cross persisting for roughly four weeks, and the average true range hovered near 268.14, which is consistent with a volatile but orderly tape. The upper and lower Bollinger Bands near 4,748.89 and 3,753.04 framed price well, while the 200 day simple moving average near 3,150 continued to rise, and the all time high at 4,956.67 remained overhead. It was therefore assessed that ETH was in a pullback within a larger uptrend, with a sequence of lower highs and lower lows since the peak keeping the short term trend pointed down.
Key levels were well defined, with resistance at 5,000 and then 5,500, and with support at 4,000 and then 3,450, while the longer term invalidation for a swing framework sat near 2,950. The weekly high and low clustered around the early week shock, which increased the probability that 4,000 would act as a near term pivot, and that 3,450 would attract bids if retested. A sustained close back above 4,213 to 4,250, a zone that includes the volume weighted moving average used by many desks, would be consistent with momentum rebuilding, while repeated failures below 4,000 would keep downside tests in play. Expectations were therefore set conditionally, with constructive follow through favored only on confirmed recapture of the pivot and with risk tightly defined against 3,450 and 2,950.
Spot ETF flows delivered a clear signal, with an estimated seven day net of about 421.19 million, the largest single day move a net outflow of about 428.52 million on October 13, followed by a net inflow near 236.22 million on October 14, and a three day momentum figure around negative 367.13 million given the sequence of prints. The pattern aligned with a liquidity shock and then a fast re engagement, which has historically coincided with stabilization rather than a prolonged exodus. Flows were therefore judged as an informative confirmation tool rather than a driver, since daily prints can be volatile and are subject to reporting lags. Continued positive prints over several sessions would add confidence to any reclaim of the 4,000 pivot, while a string of negative days would argue for caution.
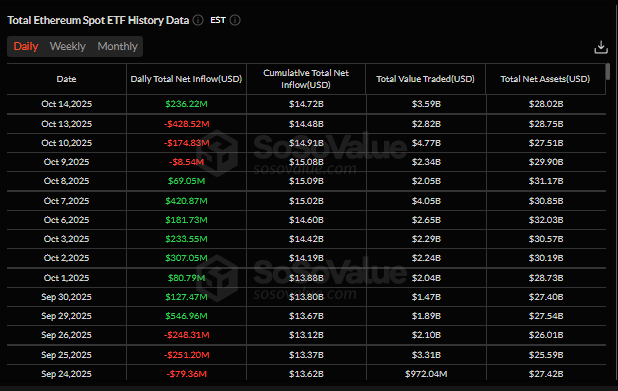
Source: https://sosovalue.com/assets/etf/us-eth-spo
No verified details of a formal shutdown event were provided for the period, therefore only observable market microstructure was evaluated. Funding rates oscillated around flat with brief flips, open interest remained elevated near 47,000,000,000, and the twenty four hour futures volume peak near 108,000,000,000 coincided with the drawdown and the initial bounce, which is typical when hedges are added and then reduced. The behavior fit a transient stress pattern rather than a structural liquidity break, with spreads normalizing and basis stabilizing as price recovered toward 4,000. The reaction was therefore interpreted as a brief shock absorbed by depth providers, not a regime shift.
News flow concentrated on market plumbing and positioning, as a brief exchange specific dislocation in an ETH centric yield stablecoin was followed by a rapid re peg, options markets showed a preference for near term downside protection with put skew lifting and then easing, and exchange held ETH on a major venue trended lower to a multi month low, indicating continued self custody preference. Those facts pointed to a market that hedged first, then allowed implied volatility to decay, while spot supply on venue tightened. The synthesis of these strands supported a constructive medium term stance conditional on price reclaiming the stated pivot and flows staying supportive. Short term volatility was expected to persist, yet the overall configuration favored accumulation on defined dips while invalidation levels were respected.
Record High Liquidations
Record liquidations near $19,000,000,000 were triggered during October 10 to 11 after a surprise 100% China tariff announcement, with bitcoin printing lows near $104,800 and venue wicks reported close to $102,000, while ether touched about $3,436 and DeFi names saw outsized drawdowns. Perpetual futures led price discovery as long positions were forcibly closed, auto deleveraging propagated across venues, and brief peg slippage appeared in select stablecoin pairs. Taken together, the sequence reflected a leverage driven cascade in thin liquidity windows, concentrated in crypto native derivatives. The episode can be described as the largest single day deleveraging on record, precise in magnitude, and finite in duration once forced flows abated
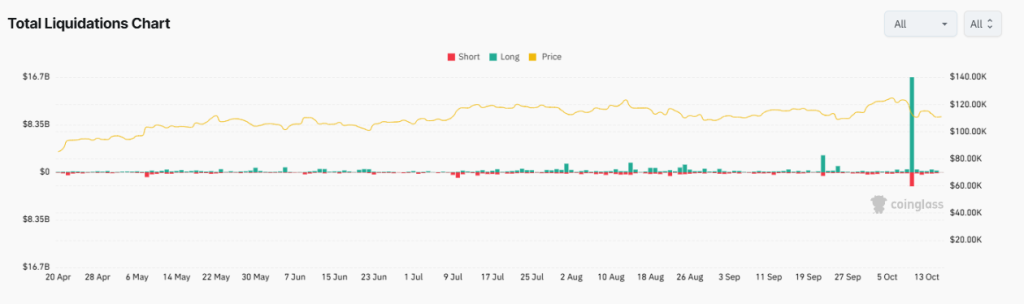
Source: https://www.coinglass.com/LiquidationData
Post crash, derivatives metrics reset, with funding turning negative, open interest falling sharply, and a surge in downside options hedging. A concurrent structural shift was observed as CME aggregate futures open interest overtook Binance, while OTC desks reported elevated volumes and tight spreads that helped absorb stress and limit broader dislocations. In synthesis, risk migrated from levered perps toward regulated venues and bilateral OTC pipes, improving execution quality during the rebound. The immediate technical read remains cautious, with supply overhead intact until funding normalizes and open interest rebuilds without excessive leverage.
Flows and positioning stabilized rather than capitulated, with digital asset ETPs posting multi billion dollar weekly inflows alongside record trading volumes, while daily ETF prints showed mixed outflows offset by selective inflows into the largest product. That pattern indicates disciplined allocation into weakness, paired with near term protection seeking and continued risk discrimination against smaller altcoins. The synthesis is a market that endured a mechanical purge, retained institutional participation, and now waits on liquidity, policy clarity, and volatility compression to validate any sustained recovery. A prudent near term stance is warranted, with focus on funding baselines, futures term structure, and ETF net flow breadth as objective triggers.
Mark Your Calendars
Economic Data Releases:
- October 20, 2025 (Friday): U.S. leading economic indicators
- October 24, 2025 (Friday): CPI
- October 24, 2025 (Friday): Core CPI
Token Unlock
- October 16, 2025 (Thursday): ARB (ARB) unlocks $30.43 M (1.99 % of market cap)
- October 18, 2025 (Saturday): FTN (FTN) unlocks $40.40 M (2.04 % of market cap)
- October 20, 2025 (Monday): ZRO (ZRO) unlocks $47.05 M (7.86 % of market cap)
- October 23, 2025 (Thursday): SOON (SOON) unlocks $12.61 M (4.52 % of market cap)