Bitcoin Ranges, Gold Attracts Flows, Eyes on CPI
23nd October 2025 • 10mins read
This Week’s Recap
- Bitcoin’s “Uptober” stalls as MTD drawdown widens: BTC is down roughly 5 percent MTD, diverging from October’s historic +19.8 percent average return per CoinGlass. The weakness follows the Oct 10 liquidation cascade and lingering macro uncertainty. Watch if seasonality reasserts once flows stabilize this week.
- BTC chops at key technical bands as momentum cools: Price is ranging around major moving averages with clear support and resistance in view. Momentum indicators faded after the Oct 10 shock. A decisive break could set the week’s direction for systematic flows.
- Some whales swap coins for spot ETF shares: Large holders are exchanging BTC for ETF shares to ease collateral and estate planning without triggering sales. This could tighten liquid exchange supply at the margin. Custody and borrow-market data will show how widespread the shift becomes.
- “Ether caught fire” in Q3 as capital rotated from BTC: A CoinGecko report shows ETH closed Q3 at $4,215, up 68.5 percent for the quarter. Flows tracked interest in DeFi, tokenized assets, and staking yield. Q4 sustainability now hinges on macro and funding conditions.
- VanEck files for first Lido staked-ETH ETF: The proposed fund would give institutions regulated exposure to stETH via an ETF wrapper. Approval could broaden access to staking yield without validator operations. Liquidity, custody, and staking mechanics will face close scrutiny.
- BitMine adds to ETH treasury after the washout: The firm increased holdings following the market’s flush. Management cites structural demand and long-term thesis. Traders will monitor cadence and funding mix as conditions normalize.
- Senate Democrats tell crypto CEOs they still want legislation: Industry leaders met senators to discuss next steps on a market-structure bill. The conversation came despite a government shutdown and partisan strain. A formal markup timeline remains the main unknown.
- TD Cowen warns the market-structure bill may slip past midterms: Analysts see timeline risk given Senate dynamics and the shutdown. A delay would prolong ambiguity for spot markets and stablecoins. Stakeholders will pivot to agency-level relief in the interim.
- Hong Kong approves first Solana spot ETF, expanding beyond BTC/ETH: ChinaAMC’s Solana ETF lists in HKD, RMB, and USD, signaling Asia’s ETP openness. The move contrasts with U.S. delays under the shutdown backdrop. Cross-listing interest and early flow data are the next tells.
- Robinhood and Coinbase move to list BNB as cap nears $150 B: U.S. brokerages signaled support, reflecting shifting compliance assessments. The push comes despite historic scrutiny of exchange-linked tokens. Watch liquidity migration and any SEC commentary.
- Whales rotate into ETF shares from spot coins: The trade can simplify collateral and estate planning while avoiding taxable sales. Reduced exchange float could support price during thin liquidity. Lender and custodian activity will indicate scale.
- Standard Chartered frames sub-$100 K dips as “last chance” before higher highs: The bank points to tightening liquidity and potential Fed responses as key drivers. Their base case is renewed upside once policy clarity improves. Traders will track DXY, real yields, and QT signals.
- Bitwise CIO cites gold’s parabolic path as a BTC roadmap: Matt Hougan says steady ETF and corporate demand can power the next leg. The thesis leans on structural buyers over leverage. ETF prints and treasury allocators are the confirmation checks.
- NHL licenses trademarks for prediction-market use, a first for major leagues: Partnerships with Polymarket and Kalshi arrive as weekly prediction-market volume nears ~$2 B. It signals mainstream IP openness to on-chain markets. Expect more leagues to test similar deals.
- Key narratives “vanished” in October as attention rotated: BeInCrypto notes sharp drops in interest for privacy coins, perps DEXs, and tokenized gold. The shift reflects post-crash defensiveness and ETF-led flows. Re-acceleration will need clear catalysts and liquidity.
Bitcoin Market Analysis
Over the last seven days, Bitcoin traded in a wide but contained range, with a weekly high at 113,971.6 on Oct 21 and a weekly low at 103,632.7 on Oct 17, the week closed near 108,133.8 after opening the window near 108,205.5, the net change was negligible while intraday swings stayed elevated. This profile indicated range conditions rather than trend extension, a conclusion supported by the flat week over week close. The 10,338.9 range between the extreme high and low framed the risk envelope for short term positioning. It was therefore appropriate to describe the week as balanced, with volatility expressed inside the prior month’s structure.
Source: https://altfins.com/technical-analysis
Technical conditions softened, then began to stabilize, RSI on the daily sat in neutral territory while MACD remained below signal with a rising histogram, ATR printed near 4,064, and price traded between Bollinger bands set near 101,371 and 126,547. The 200 day SMA tracked close to 108,119, price interacted with that average repeatedly, and momentum cool down after the Oct 10 shock remained visible. This configuration favored mean reversion until a new impulse appeared, since momentum exhaustion had not flipped decisively positive. It was therefore judged that confirmation, not anticipation, should guide directional calls.
Key levels were clustered and clear, support sat near 112,000 and 100,000 with an intermediate pivot around the 200 day SMA near 108,119, resistance sat near 121,000 and 128,000 to 129,000. The market respected these shelves during the week, with failed pushes above 120,000 and responsive buying near the 107,000 to 108,000 zone. A daily close above 121,000 would likely open a retest of 126,000 to 129,000, while a close below the 200 day would likely expose 102,000 and then 100,000, these statements are conditional and falsifiable. Expectations were therefore framed as range continuation unless a decisive break pulled systematic flows in one direction.
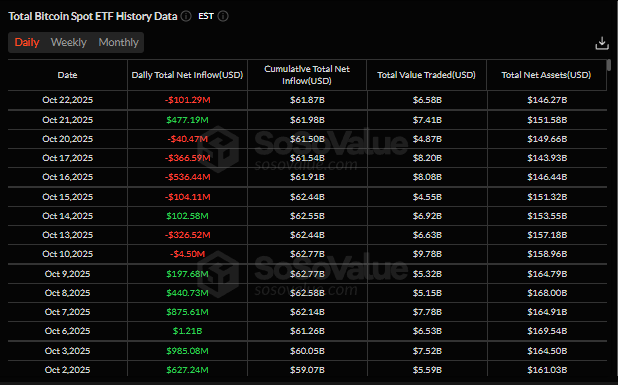
Source: https://sosovalue.com/assets/etf/us-btc-spot
Spot ETF flows showed a sequence of outflow days through Oct 20 followed by a strong positive daily print on Oct 21, so certainty on a sustained shift cannot be claimed. The pattern, outflows then a large inflow, often precedes a regime turn but does not guarantee one, cumulative assets appeared broadly stable across the mid-month chop. A practical read treated two to three additional positive days with broad participation as a confirmation signal, while a relapse into net outflows would validate further range behavior.
Post shock market mechanics remained in normalization mode, funding tended to compress on down days and re expand on bounces, aggregate futures open interest typically contracted into the selloff and rebuilt modestly afterward. Options activity remained consistent with hedging demand after Oct 10, with implied volatility staying sticky relative to pre shock levels, that mix aligned with choppy spot action. These dynamics suggested that liquidity supply was present near the 107,000 to 108,000 area while chase demand above 120,000 was not yet proven. It was therefore prudent to treat rallies into resistance as tests until derivatives signals aligned with spot strength.
News flow remained mixed, references to tariff risks, policy path uncertainty, and a firm to stable dollar tone persisted, while rotation narratives cited stronger relative interest in Ethereum during Q3, the durability of that rotation in Q4 was not yet clear. None of these drivers provided a definitive catalyst during the week, which fit the observed range behavior and the lack of a confirmed flow regime change. The working synthesis connected macro ambiguity with neutral momentum and bounded ETF signals to explain the stalemate around the major averages. It was therefore concluded that confirmation from flows or a clean break of 121,000 or 108,000 would be required to reset the weekly bias.
Ethereum Market Analysis
Over the last seven sessions, Ethereum traded within a wide range, with a weekly high at 4,109.46 on October 21 and a weekly low at 3,679.90 on October 17, and the period closed near 3,816.36 for a net change of about minus 0.40 percent. A breakout attempt toward 4,100 was faded, then bids reappeared above 3,700, and the tape settled back into a range. The sequence reads as digestion of the August all time high at 4,956.67, with supply persistent near 4,000 to 4,100 and demand active into the mid 3,700s. Range behavior after a failed push higher is typically resolved by confirmation at a key level, so patience was warranted while the band between 3,700 and 4,100 was tested.
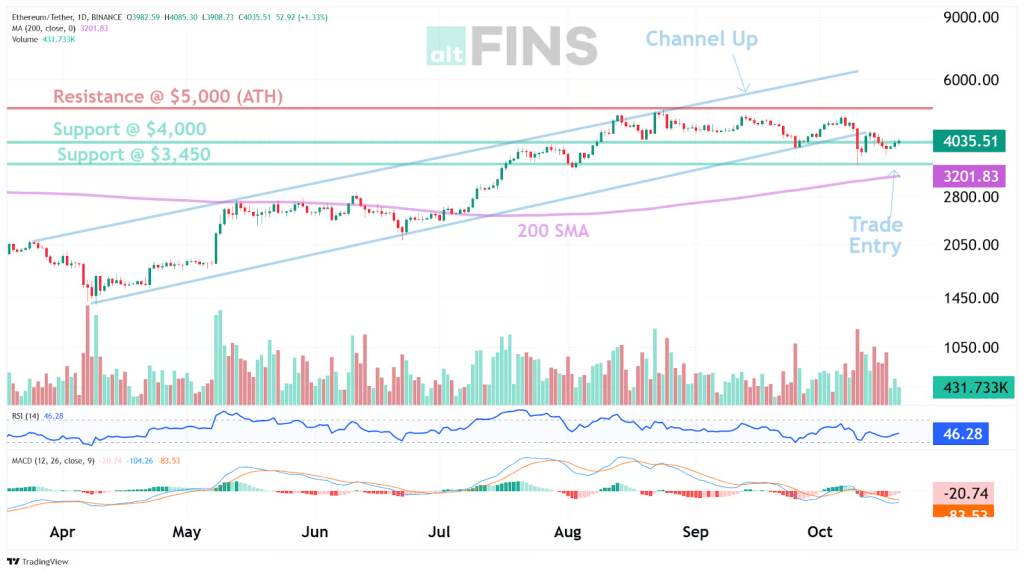
Source: https://altfins.com/technical-analysis
Momentum and volatility were mixed, with RSI-14 around the midline near 46, MACD negative but the histogram rising, and ATR near 243.95, while price traded comfortably inside Bollinger Bands set near 3,525.93 and 4,690.13. The 200-day simple moving average near 3,201.83 remained upward sloping, and higher time frame moving averages stayed supportive, while short to medium averages leaned lower. This configuration indicates a short-term downtrend within a longer-term uptrend, where sellers control momentum, but trend support has not been violated. A clean turn typically arrives through a higher low, an MACD signal cross, and a drive back above the volume weighted moving average near 4,093.48, so confirmation was awaited rather than anticipated.
Support near 3,450 and secondary support near 3,000 remained in the primary defenses, with invalidation placed at 2,950, and resistance stood at 4,000, then 5,000. A sustained reclaim and hold above 4,000 would signal that demand has absorbed overhead supply, opening a path to 4,900 and the prior high thereafter, while a decisive loss of 3,450 would raise the risk of a 3,000 test. Positioning was best expressed as staged entries in the 3,400 to 3,500 zone, targeting 4,000 first and 4,900 second, with the 2,950 stop preserving favorable risk to reward. Expectations therefore favored base building above 3,450 and a range resolution only after participation broadened above 4,000.
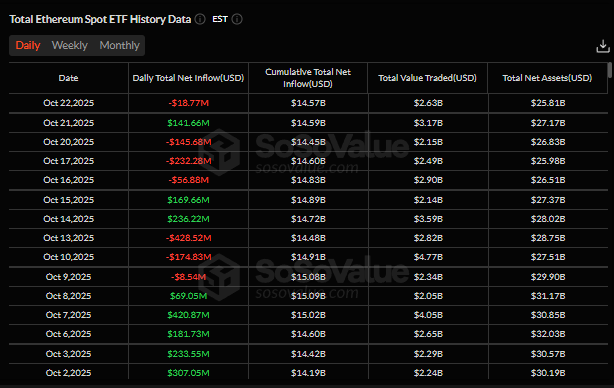
Source: https://sosovalue.com/assets/etf/us-eth-spot
Spot ETF flows showed a mix of sizeable inflows and notable outflows, with two strong positive days above 140,000,000 and one large negative day near 230,000,000, and the seven-day net appeared positive. Flow behavior often acts as confirmation rather than anticipation, so sustained net inflows across three to five sessions would strengthen any reclaim above 4,000, while consecutive outflows would argue for tighter risk until a higher low form.
Post flush behavior in similar regimes typically shows reduced leverage, cooler basis, and choppier funding; conditions that favor mean reversion trades around support rather than momentum chases into resistance. If funding were to rise while price remained capped below 4,000, risk would be skewed to stop hunts, while a rebuild in open interest alongside a firm close above 4,000 would validate trend continuation. Dollar strength and liquidity tone were treated as gating variables for sustainability, and any deterioration there would warrant a reduction in gross exposure.
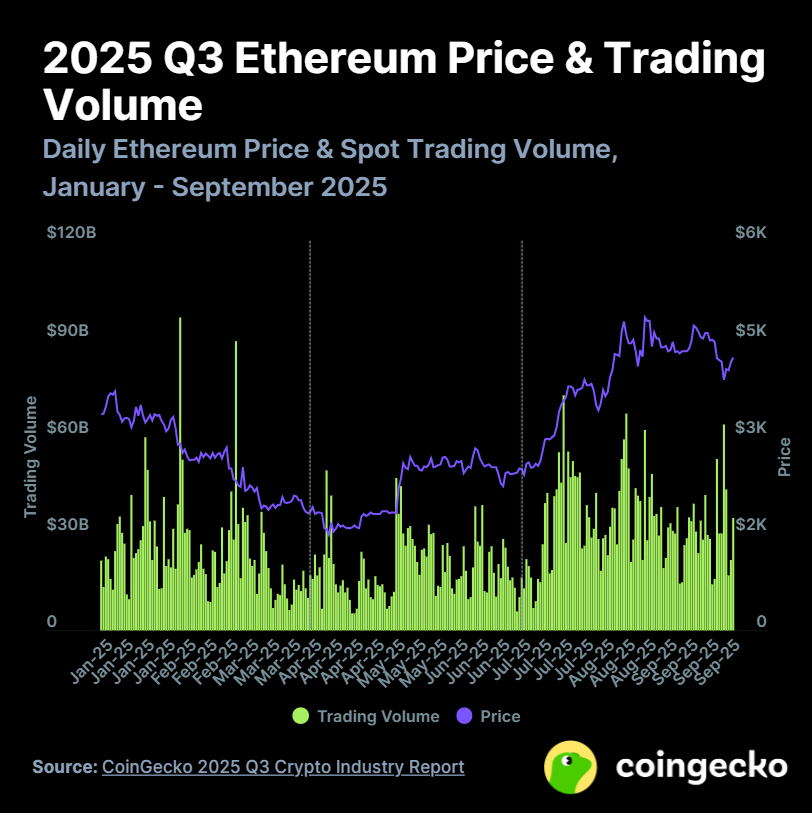
Source: https://www.coingecko.com/
Narrative drivers remained supportive but unproven for Q4, as a Q3 market report recorded an ETH quarter close at 4,215, up 68.5 percent, an S-1 was filed for a Lido staked ETH exchange traded fund, and a listed miner increased ETH treasury holdings after the October washout. The first item framed leadership rotation into ETH via DeFi, tokenization, and staking yield; the second introduced a regulated path to staking exposure, and the third signaled institutional dip demand. Together, these items reinforced a constructive structural bid, while the tape still required technical confirmation at 4,000 to translate narrative into price. Until that confirmation arrived, a buy the dip bias at mapped supports with disciplined stops remained the most robust stance.
Gold as a liquidity spond
Gold is being treated as the primary sink for risk capital at the moment, as shown by headline scale and fund flows. CoinDesk reported that gold’s market value was framed around $30T on October 17, 2025, reflecting record prices and outsized attention. World Gold Council analysis this week attributed the strength to a weaker dollar and elevated uncertainty, conditions that historically channel incremental allocations toward gold first.
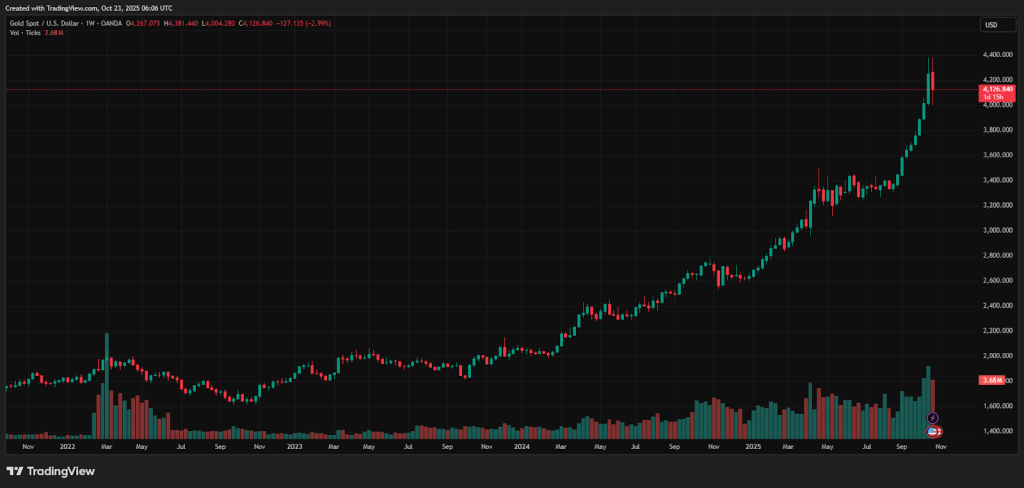
Source: https://www.tradingview.com/symbols/XAUUSD/
Flow data indicate that the marginal bid has been concentrated in gold vehicles, while Bitcoin flows were softer before a brief rebound. ETF.com logged approximately $1.6B of creations into GLD on October 16, one of the largest single day prints of the year. In the same window, consolidated U.S. spot Bitcoin ETF data showed four straight net outflow sessions into October 20, followed by a single $477M net inflow on October 21, which suggests that gold absorbed liquidity earlier and more consistently.
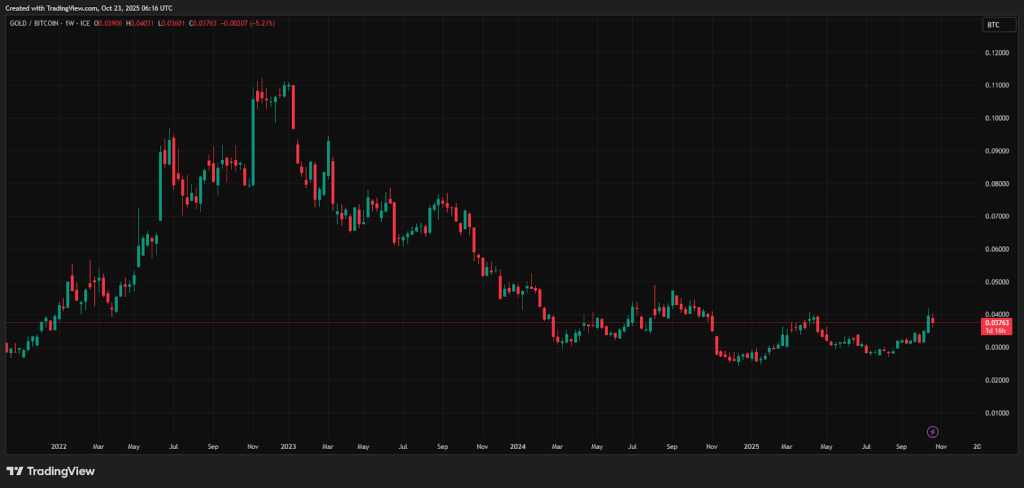
Source: https://www.tradingview.com/chart/?symbol=TVC%3AXAUBTC
If the macro mix highlighted by the World Gold Council persists, softer real yields, a wavering dollar, and elevated risk premia; gold is likely to keep capturing the first dollars of defensive or cross asset reallocations. A durable shift would require evidence that gold inflows are cooling while Bitcoin ETF prints turn positive for several consecutive sessions. Until then, the liquidity narrative remains gold centric.
Mark Your Calendars
Economic Data Releases:
- October 24, 2025 (Friday): CPI
- October 24, 2025 (Friday): Core CPI
- October 29, 2025 (Wednesday): FOMC interest-rate decision
- October 29, 2025 (Wednesday): Fed Chair Powell press conference
Token Unlock
- October 26, 2025 (Sunday): TRIBL (TRIBL) unlocks $36.65 M (1.90 % of market cap)
- October 26, 2025 (Sunday): XPL (XPL) unlocks $30.66 M (4.97 % of market cap)
- October 25, 2025 (Saturday): H (H) unlocks $9.31 M (3.01 % of market cap)
- October 29, 2025 (Wednesday): JUP (JUP) unlocks $18.65 M (1.72 % of market cap)
- October 30, 2025 (Thursday): ZORA (ZORA) unlocks $15.09 M (4.55 % of market cap)