Crypto Market Reset and Drawdown
Key Numbers:
Bitcoin $91,152.57 (-16.94%) Ethereum $3,028 (-21.46%)
1-month return
Total Crypto Market Cap $3.19T (-14.02%)
2025 returns
Bitcoin –4.038% Ethereum -11.13% Gold 63.88%
NASDAQ -1.51% S&P500 0.13%
Key Takeaways
- November was the first major deleveraging stress test of this cycle, wiping more than $1 T from crypto market value, but core infrastructure, exchanges and stablecoins continued to function without systemic failure.
- Flows and leverage were central to the move, with roughly $3.5 B of outflows from United States spot Bitcoin ETFs, about $1.4 B from Ethereum ETFs, the first stablecoin market cap contraction in more than two years, and a sharp drop in perpetual futures open interest and elevated liquidations.
- Bitcoin and Ethereum traded as high beta components of a broader risk reset driven by stretched AI equity valuations and macro uncertainty, rather than an idiosyncratic crypto collapse, while ETF structures made price more sensitive to short horizon flows.
- Ethereum’s token price behaved like a volatile growth asset under ETF and macro pressure, but the Ethereum network and its rollups remained the primary settlement layer for DeFi, absorbing a roughly $55 B TVL drawdown and a more than $120 M Balancer exploit without cascading protocol failures.
- Dispersion widened across sectors: majors and core infrastructure fell in line with a 20 percent to 30 percent Bitcoin drawdown, while memecoins, NFTs and other narrative sectors suffered much steeper percentage losses, even as file storage, privacy and social tokens showed pockets of resilience.
- Regulatory and reputational pressure intensified, with “Coin Laundry” exposing compliance gaps at some venues and global regulators steering tokenisation and stablecoins into existing securities and payments frameworks, increasing the importance of venue due diligence and explicit sizing of speculative exposures inside diversified portfolios.
Market Overview
November was the first genuine stress test of this cycle. From the October peak into the November low, more than $1.00T in crypto market value disappeared, as total market cap fell by roughly a quarter and Bitcoin dropped from above $126,000 dollars into the $80,000 range. There was no single “FTX style” trigger. The move came from a combination of spot selling, record or near record redemptions from spot Bitcoin and Ethereum ETFs, the first meaningful contraction in stablecoin supply in more than two years, a sharp reduction in derivatives leverage, and a $120 M exploit at Balancer that hit DeFi right in the middle of the volatility.
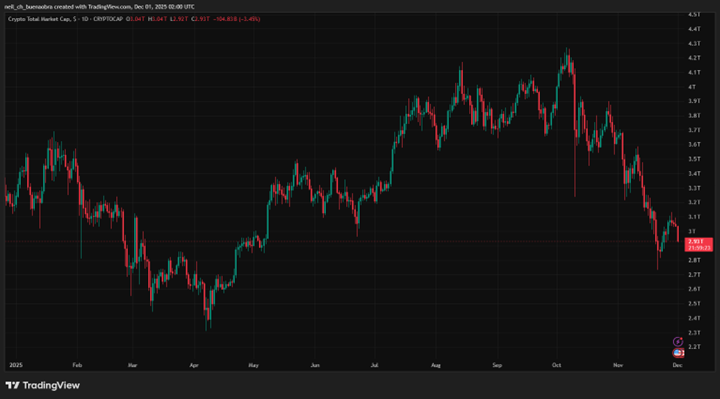
Crypto Market Cap in 2025, From Peak to November Reset
Source: https://www.tradingview.com/
The path looked like a classic deleveraging. A break through key levels triggered margin calls and liquidations in futures and perpetual swaps. On one of the worst days, more than $2.00 B of leveraged positions were liquidated across major derivatives venues, affecting over 400,000 trader accounts. At the same time, ETF providers were selling spot to meet redemptions, and order books were thinner than in previous cycles because more ownership had moved into listed products and structures.
Importantly, there was no central infrastructure failure. Large exchanges stayed online, core stablecoins held their pegs, and settlement systems continued to work. The only major technical incident was protocol specific at Balancer, not a breakdown of custody or exchange plumbing.The price move looked like a crash, but market functioning resembled a mature system clearing excess leverage under stress. For risk committees, that is a different situation from 2022, when key venues failed outright.
Global conditions were already fragile before crypto sold off. Through October and November, markets were wrestling with stretched valuations in AI related equities, choppy macro data, and less certainty about the future path of interest rates. Coverage of the “AI bubble” debate and reports that more than $1T dollars in crypto value had been wiped out in roughly six weeks framed the move as part of a broader risk reset.
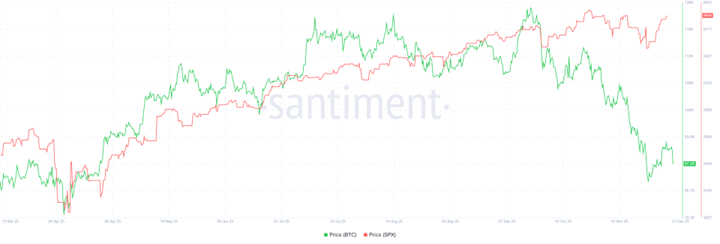
Bitcoin and SPX, Tracking 2025
Source: https://app.santiment.net/
United States economic data releases were disrupted by government funding problems, which created a “data fog” for policymakers and investors. Central bank communication stayed cautious and futures pricing for 2026 cuts moved around, so the clean “lower rates, higher risk assets” story that had supported Bitcoin and Ethereum earlier in the year lost some force. In practice that meant crypto was no longer being pulled higher by one simple liquidity narrative. It traded as part of a larger basket of high beta assets that were being reassessed at the same time. When confidence around those trades weakened, crypto moved with them.
Bitcoin, core asset under ETF and derivatives pressure
Bitcoin carried most of the narrative and most of the market cap loss. After setting new all time highs above $126,000 in October, the price slid into the $80,000 region by 21 November. That left Bitcoin roughly 20% to 30% below its peak and removed around $400B from its market value. Spot ETFs amplified the move with about $3.48B of net outflows from United States spot Bitcoin ETFs, the second largest monthly redemption since launch. Other flow analyses place combined outflows in a similar range, and one widely cited figure shows BlackRock’s iShares Bitcoin Trust suffering a single day outflow of roughly $523 M on 19 November.
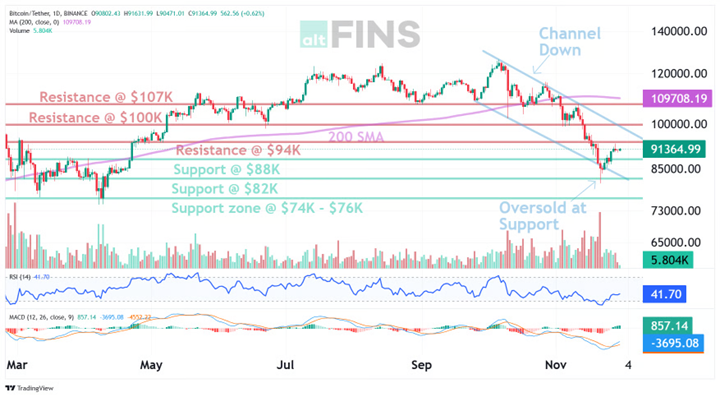
Bitcoin Price vs 200 Day Moving Averages
Source: https://altfins.com/technical-analysis
The pattern suggests that short horizon ETF holders and leveraged traders were the main marginal sellers, rather than long term cold storage wallets. Market makers meeting redemptions sold spot and unwound hedges. Futures traders running high leverage were forced out as prices slipped. On chain work from analytics firms indicates some profit taking by large holders, but no wholesale exit from long horizon wallets and no broad wave of distressed miner selling. This clarified what ETF adoption really means. ETFs make Bitcoin easier to own but also create a channel where a few billion dollars of outflows in a short window can move price quickly when liquidity is thin. The long term supply and adoption story remains in place, but the path between milestones is now more exposed to flow-driven swings.
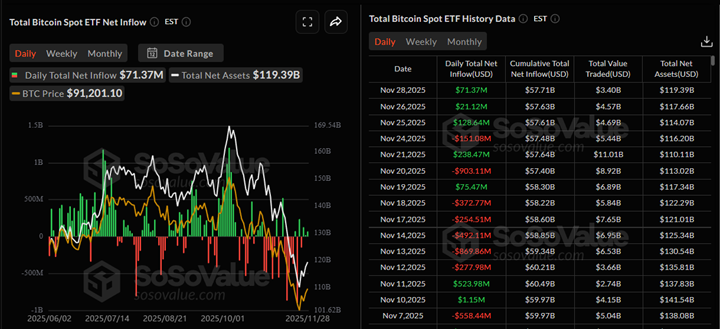
Spot Bitcoin ETF Flows, Record November Outflows
Source: https://sosovalue.com/assets/etf/us-btc-spot
Ethereum, volatile token on top of critical infrastructure
Ethereum followed the same broad arc, with some differences. By the third week of November, ETH traded in the high $2,000s to low $3,000s, well below its 2025 highs and weaker than Bitcoin in relative terms. Spot Ethereum ETFs also saw sizable outflows. Data show about $1.42 B of net redemptions from Ethereum spot ETFs in November, the largest monthly outflow since those products launched.
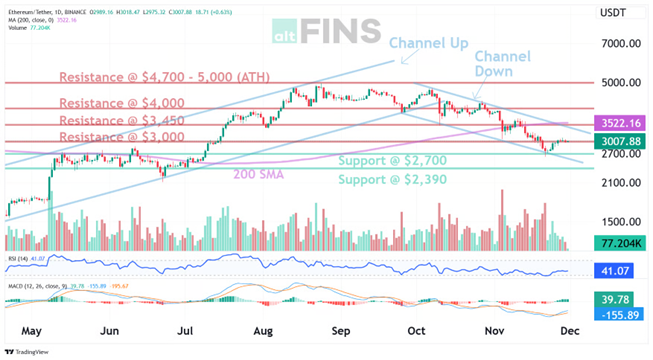
Ethereum Price vs 200 Day Moving Averages
Source: https://altfins.com/technical-analysis
At the same time, Ethereum remained the main settlement layer for DeFi. Total DeFi TVL fell from roughly $178B at the start of October to about $115B by late November. Even after that drop, Ethereum and its rollups hosted most of that capital, including major lending protocols, decentralised exchanges and liquid staking platforms. Networks such as Arbitrum continued to hold significant TVL and throughput despite the mark to market impact. The outcome is a split personality. The ETH token traded like a high beta growth asset caught in ETF outflows and macro de risk. The Ethereum network itself stayed at the centre of the on-chain ecosystem. For an investment committee, that means treating Ethereum as both a volatile asset and a critical piece of infrastructure, and sizing accordingly.
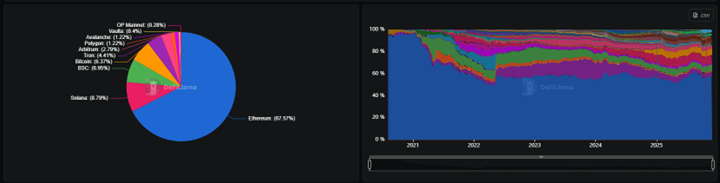
Source: https://defillama.com/chains
Flows, stablecoins, and derivatives
The “money layer” sent some of the clearest signals in November. Report shows aggregate stablecoin market capitalisation falling by about $4.54 B to $303B as of 24 November, a 1.48% decline and the first monthly contraction in more than two years. Stablecoin trading volumes stayed high at roughly $1.48T, and Tether still accounted for more than three quarters of centralised exchange turnover.
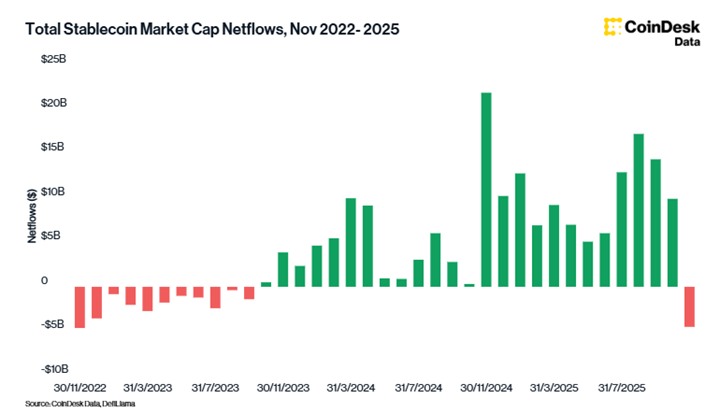
Source: https://www.coindesk.com/
On the derivatives side, the reset was just as visible. Bitcoin perpetual futures open interest fell by about 35% from an October peak near $94B, signaling a clear retreat from leveraged trading. Around the worst days of the move, over $1.90 B of long positions were liquidated within hours, underscoring how much of the price action was driven by forced de risking rather than new speculative longs. In the options market, data show 25 delta skews turning sharply positive and “defensive positioning dominating market structure,” as traders paid more for downside protection and used bounces to add hedges instead of chasing upside.
Taken together, stablecoin supply and derivatives positioning describe a coordinated de-risk. Less stablecoin “float” on chain means less cash and collateral sitting in wallets and pools. Lower futures open interest and more defensive options skew show that leverage is being taken out of the system and that traders are spending more premium on protection. None of these changes take the market back to 2022 style crisis conditions, but they are large enough to shape how price moves and how quickly liquidity and risk appetite can return.
DeFi and the Balancer exploit
DeFi felt both market pressure and a direct security hit. Total DeFi TVL fell from around $178B in early October to roughly $115B by late November, including a 12.45$ drop in the week ending 9 November, the sharpest weekly contraction since the 2023 bear market. On 3 November, Balancer v2 suffered a complex exploit that targeted Composable Stable Pools. Security reviews estimate that the attacker drained more than $120M across several chains and Balancer forks by abusing a precision and rounding issue in how scaling factors were calculated in the pool math.
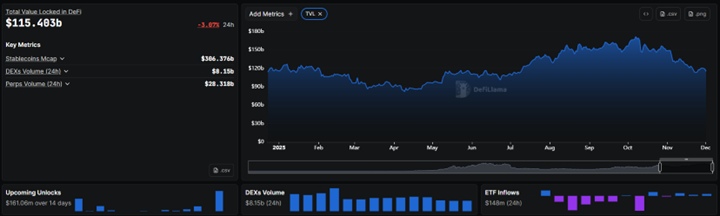
DeFi TVL Shift, Ethereum and Rollups Through the November Drawdown
Source: https://defillama.com/
Most of the TVL decline came from price effects and de risked positions, but the Balancer loss added a sharp, protocol specific shock exactly when conditions were already stressed. It is a reminder that complex DeFi systems can hide bugs that only become exploitable when size, liquidity and behaviour line up in a particular way. Even so, the broader DeFi ecosystem held together. Major lending protocols, decentralised exchanges and rollups continued to operate, liquidations were processed, and there was no cascade of protocol failures.
Altcoins, Memecoins and NFTs
The sharpest percentage moves in November happened at the speculative edge. KuCoin and other trackers describe memecoins as being down about 66% from their 2025 peak, with more than $5.00 B in sector value wiped out in a single 24-hour window around 21 November. Sector data show memecoins down about 19% over the month, alongside similar high teens drawdowns in DeFi and other high beta sectors, while NFT related tokens, staking services, gaming, RWA and data availability names fell roughly 25% to 33%, clearly leading the declines. This put combined memecoin market capitalisation at roughly $39.40 B after the move, down from about $44.00 the day before.
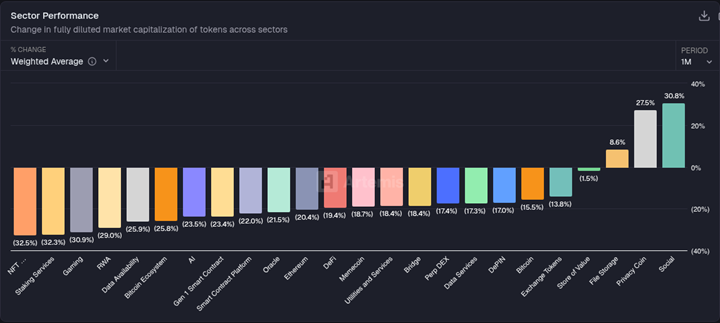
Sector Performance
Source: https://app.artemisanalytics.com/home
NFTs also slumped. One summary notes that NFT market capitalisation fell from about $4.90B to under $3.00B over roughly a month, taking the sector back to levels last seen in April, consistent with the sector chart that shows NFT tokens down more than 30% for the period.
These markets trade mainly on sentiment and liquidity. They usually lack cash flows, and order books are thin compared with majors or large infrastructure tokens. When Bitcoin sells off, ETF flows reverse and leverage is cut, there is little reason for marginal capital to stay in pure narrative tokens. A 20% to 30% move in Bitcoin translated into much larger moves in these pockets because each unit of selling pushed prices further, which is visible in the chart where Bitcoin and exchange tokens are down about 16 and 14 percent, less than the declines in the speculative sectors that sit to their left.
In contrast, large layer one and layer two platforms, DeFi blue chips and real world asset tokens behaved more like expected high beta assets. They fell, often more than Bitcoin on a percentage basis, but did not show the same depth of collapse seen in memecoins or thin NFT collections. The same sector view also shows a small store of value basket roughly flat for the month, and pockets of strength in file storage, privacy and social tokens, which finished up about 9%, 28% and 31% respectively, suggesting that some investors rotated within crypto rather than exiting entirely.
Regulation and “Coin Laundry”
November also changed the tone around regulation and public perception. The International Consortium of Investigative Journalists launched “The Coin Laundry”, a project with 37 media partners that examined how criminal networks have used exchanges, ATMs and crypto to cash services to launder funds. The reporting highlighted that brand name platforms such as Binance and OKX processed flows linked to scams, drug trafficking and human exploitation, often because of gaps in know your customer controls and lightly regulated cash storefronts.
At the same time, regulators kept refining their approach to tokenisation and stablecoins. Central bank financial stability reviews and work on stablecoins describe these instruments as both a rapidly growing payment rail and a possible source of funding and run risk if oversight is weak. IOSCO’s final report on tokenisation emphasised that tokenised securities should sit inside the standard regulatory perimeter, with technology neutral rules around legal ownership, settlement and operational resilience.
Venues and services that cut corners on compliance can expect more scrutiny and higher enforcement risk. Instruments and platforms that resemble traditional securities and payment systems, and that accept full regulation, are being pulled into familiar rule sets rather than left in limbo.Counterparty due diligence and venue selection will matter more. Regulated ETFs, tokenised bonds and institutional stablecoins are likely to become easier to justify within existing governance frameworks.
Closing Insights
Across all of these pieces, November 2025 delivered a set of consistent signals. Crypto traded as part of a broader risk reset. The selloff aligned with concern around AI equity valuations, less clarity on the policy path and a general de risk across high beta assets, rather than an idiosyncratic crypto failure.
Flows and plumbing were central to the story. A first stablecoin contraction in more than two years, roughly $3.5B of outflows from United States spot Bitcoin ETFs, about $1.4B from Ethereum ETFs, and a one third drop in futures open interest all contributed to a 20% to 30% drawdown in Bitcoin and more than $1T in lost market value. Core infrastructure bent but did not break. DeFi TVL fell by about $55B, and Balancer lost more than $120M to an exploit, yet key lending and trading protocols remained live and solvent.
Dispersion widened at the edge. Infrastructure, DeFi blue chips and real world asset platforms behaved like high beta extensions of majors. Memecoins and NFTs behaved like pure sentiment and suffered far deeper losses.Regulation and public scrutiny tightened in a targeted way. “Coin Laundry” exposed ongoing weaknesses in compliance at some venues, while tokenisation and stablecoin reports showed regulators working to integrate core instruments into existing frameworks instead of excluding them. These are themes to lift above the noise. November was not only “a bad month.” It was a live test of how an ETF and stablecoin centric crypto market behaves under stress. The system held, but it made very clear where the levers now sit: macro visibility, ETF and stablecoin flows, DeFi protocol risk, sector dispersion and the regulatory trajectory.