FOMC Rate Cut, Crypto Stays In Controlled Correction Mode
11th December 2025 • 11mins read
This Week’s Recap
- Sovereign Wealth Funds Were Buyers as Bitcoin Plunged: BlackRock’s Larry Fink: Sovereign wealth funds bought Bitcoin on the recent dip, according to BlackRock CEO Larry Fink. That confirms long horizon state capital is using volatility to accumulate rather than exit. It reinforces the idea that spot ETF flows are increasingly driven by large, patient institutions rather than only retail traders.
- Spot bitcoin ETFs see $195 million exit, largest daily outflow in 2 weeks: U.S. spot Bitcoin ETFs saw a combined $195 million outflow, the largest single day withdrawal in two weeks. Trading volumes also fell, pointing to softer short term demand. The move highlights how ETF flow swings can quickly amplify price volatility even in a maturing market.
- Bitcoin’s Deep Correction Sets Stage for December Rebound, Says K33 Research: K33 Research argues that Bitcoin’s sharp pullback has pushed fear above what fundamentals justify. Analysts say positioning and on chain metrics now resemble prior bottoms where new cycles began. They see December as an attractive entry window if macro conditions stay supportive.
- Bitcoin Surges to $94K One Day Ahead of Expected Fed Rate Cut: Bitcoin ripped higher to around $94,000 as traders priced in a widely expected Federal Reserve rate cut. The move triggered hundreds of millions of dollars in liquidations across leveraged positions. It shows how macro events and funding conditions still dominate short term crypto price action.
- SpaceX’s $300M Bitcoin Stack Puts Crypto Inside the World’s Biggest Planned IPO: SpaceX reportedly holds about $300 million in Bitcoin on its balance sheet. That puts BTC exposure inside what could be the world’s largest planned IPO. The position underlines how corporate treasuries are still quietly adding Bitcoin even after the initial treasury adoption hype faded.
- Michael Saylor’s Strategy buys another 10,624 bitcoin for $963 million as treasury holdings reach 660,624 BTC: Strategy added 10,624 BTC in a single purchase, spending roughly $963 million. The company now holds more than 660,000 BTC, over 3 percent of total supply. This deepens its all in Bitcoin treasury bet at a time when ETF access makes that model easier for investors to replicate directly.
- BlackRock Files for Staked Ethereum ETF: BlackRock filed for an Ethereum ETF that would provide exposure to staking yield. The product is designed to let investors access on chain income without running validator infrastructure. It strengthens the narrative that institutional demand is shifting from pure price exposure to yield bearing ETH strategies.
- WisdomTree first to market with Ethereum staking fund using Lido’s stETH: WisdomTree launched an Ethereum product in Europe that earns staking rewards via Lido’s stETH. Investors get regulated fund access to staked ETH economics instead of holding stETH directly. The structure is an early example of how DeFi primitives are being wrapped for traditional portfolios.
- Ether Surges 8%, Outpacing Bitcoin Gains Amid Staking ETF, Tokenization Optimism: Ether jumped around 8 percent in a single session, outperforming Bitcoin. Traders credited optimism around staking ETFs and growing tokenisation activity on Ethereum. The move revived the idea that ETH can occasionally lead market rallies when structural catalysts are specific to its ecosystem.
- Solmate to Buy RockawayX in All-Stock Deal to Build $2B Institutional Solana Giant: Solmate agreed to acquire RockawayX in an all stock transaction that will combine their Solana focused businesses. The merged group aims to manage more than $2 billion across infrastructure, liquidity, and asset management. This consolidation positions Solana as a more institutionally serviced ecosystem.
- Dogecoin Surges as Ether Zooms 8%, Sparking Bullish Reversal For Memecoins: Dogecoin broke out above key resistance as Ethereum’s rally lifted the broader memecoin complex. The move ended a multi session compression phase and brought volume back into speculative names. It highlights how liquidity often rotates into high beta altcoins once majors start trending.
- CFTC Launches Digital Assets Pilot Allowing Bitcoin, Ether and USDC as Collateral: The U.S. CFTC unveiled a pilot program that lets firms post Bitcoin, Ether, and USDC as margin collateral for derivatives trades. The framework comes with new custody and reporting rules and replaces older restrictive guidance. This gives large institutions a clearer, regulated way to use tokenised assets in traditional futures markets.
- US bank regulator clears national banks to facilitate crypto transactions: The Office of the Comptroller of the Currency confirmed that national banks can act as intermediaries in certain crypto transactions. The guidance covers so called riskless principal trades where banks match client orders and then offset them. It lowers legal uncertainty for large banks that want to add direct crypto dealing to private client offerings.
- SEC ends Biden-era investigation into Ondo Finance without charges, firm says: Ondo Finance said the SEC has closed a long running investigation into the project without bringing enforcement action. The probe focused on tokenised securities and real world asset structures. Its conclusion is being read as a positive signal for compliant RWA platforms that work within existing securities rules.
- Crypto officially becomes a “third category” of property, fixing the fatal flaw in digital asset ownership: The U.K. has formally recognised digital and electronic assets as a distinct category of personal property. This gives courts clearer tools to handle issues like custody, collateral, and enforcement for tokens. The change is expected to support institutional activity in areas such as systemic stablecoins and tokenised assets.
- Digital Assets to Shift From Disruption to Integration in 2026, CoinShares Says: CoinShares forecasts that crypto will move from an era of disruption to one of integration with traditional finance. The firm describes a hybrid finance model where banks and asset managers tokenise funds, deposits, and other instruments on public chains. That narrative fits with the recent surge in tokenisation pilots and RWA focused infrastructure deals.
- State Street and Galaxy to Launch Tokenized Liquidity Fund on Solana in 2026: State Street and Galaxy plan to roll out a tokenised liquidity fund using PayPal’s PYUSD on Solana. The vehicle is aimed at institutional clients who want on chain settlement with familiar fund wrappers. It adds a high profile example of global banks and crypto natives collaborating on Solana based tokenisation.
Bitcoin Market Analysis
Over the past week, Bitcoin was confined to a wide but defined range between roughly $87,748 and $94,591. An early session opened near $92,083, traded down toward about $88,218, then closed close to $89,334, setting a weak starting tone. Subsequent days produced smaller candles in the high $80,000s and low $90,000s, with 9 December marked by a push from an open around $90,636 to a high just under $94,600 before a close near $92,693 was recorded. Recent closes around $90,694 left the week up by roughly 1.5% from the starting point, while Bitcoin stayed about 28% below the early October all time high near $126,218 and about 21% above the 52 week low around $74,500. As a result, price action during the period was best characterized as a volatile consolidation inside a broad range rather than a resolved trend move.
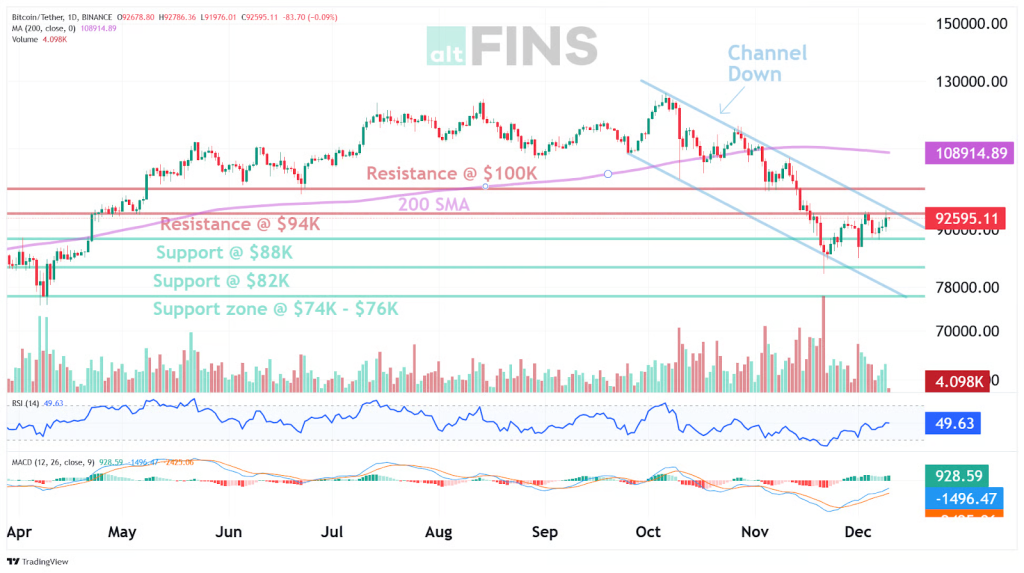
Source: https://altfins.com/technical-analysis
On the daily chart, price was contained within a descending channel that has been in place since the October peak, with lower highs and lower lows being respected inside parallel downward trend lines. The 200 day simple moving average, situated near $108,900, was kept well above spot, so medium and long term trend gauges were held in a downward configuration even as very short term averages, such as the 5 day and 10 day lines, turned upward. Intermediate moving averages around 20, 30, 50, and 100 days were still sloping lower, so the broader corrective phase was indicated as unfinished. Momentum indicators presented a balanced picture, since the MACD line was held above its signal line while histogram bars narrowed, and the 14 day RSI hovered close to the mid zone around 50, which signaled neither overbought nor oversold conditions. Average True Range was maintained near $3,700, realized daily ranges tended to come in slightly beneath that reference, and Bollinger Bands between about $85,456 and $94,426 contained price near their middle, so volatility was elevated but not extreme.
Horizontal levels around current price were clearly defined and were used as practical reference points. The zone around $94,000 acted as near term resistance, with several intraday attempts failing to secure a close above that area, while a second resistance region near $100,000 was associated with prior congestion and psychological significance. On the downside, an initial support shelf near $88,000 was respected on repeated tests, stronger support was identified around $82,000, and a broader demand zone between $74,000 and $76,000 was linked to earlier cycle lows. Under this structure, a decisive daily close above $94,000 that also carried price through the upper boundary of the descending channel would usually be read as an early sign that a reversal phase toward $100,000 and, in time, toward the 200 day average was under way, while it was accepted that such an outcome could not be assured. In contrast, a sustained move below $88,000, and particularly a close beneath $82,000, would typically be taken as confirmation that the downward channel remained dominant and that the $74,000 to $76,000 region had been reopened as a realistic downside objective, so a constructive short term bias was effectively treated as invalidated below $82,000, and the broader bearish structure was only credibly challenged by a durable reclaim of the 200 day moving average.
Within the United States spot Bitcoin exchange traded fund complex, a relatively stable overall picture was observed, even as daily flows moved sharply. Across the latest seven trading days, combined activity produced only a small net inflow, so total ETF held exposure was left broadly unchanged while spot prices moved aggressively inside the weekly range. The most prominent single session occurred on 4 December, when net outflows of roughly $195 million were recorded, the largest one day withdrawal in about two weeks, and that move coincided with softness in the underlying market. This outflow was followed by an inflow of about $54.8 million on 5 December, an outflow near $60.5 million on 8 December, and an inflow around $151.7 million on 9 December, which resulted in a three day net inflow of roughly $146 million. With cumulative net subscriptions into spot ETFs estimated near $57.7 billion and total ETF net assets around $122.1 billion, it was implied that while day to day flows still had the capacity to amplify short term volatility, the broader stock of ETF held Bitcoin was being maintained rather than liquidated.
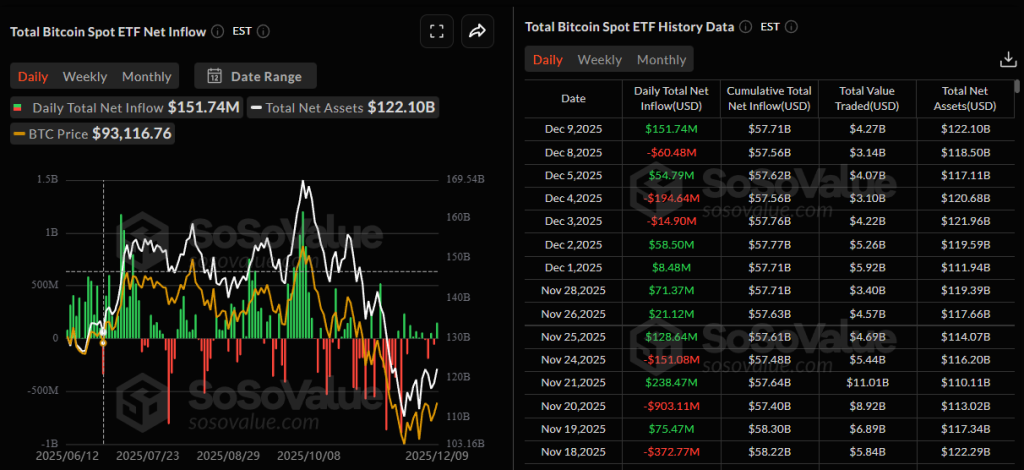
Source: https://sosovalue.com/assets/etf/us-btc-spot
Fundamental and positioning developments during the period supported this reading of the structure. Public remarks by the head of a leading asset manager, detailed in coverage such as “Sovereign Wealth Funds Were Buyers as Bitcoin Plunged” and follow up reports on sovereign wealth funds buying the dip, indicated that several sovereign funds had been active buyers during the recent plunge, so long horizon state capital was described as using price weakness to add exposure rather than to exit, and spot ETF demand was portrayed as increasingly driven by large institutions instead of predominantly by short term retail traders. A digital asset research house, in analyses such as “Bitcoin’s Deep Correction Sets Stage for December Rebound, Says K33 Research”, characterized the latest decline as the deepest correction since the prior bear market and noted that derivatives positioning and on chain indicators had begun to resemble earlier local bottom formations, while it was clearly stated that any rebound remained conditional on macro conditions. Around the most recent Federal Reserve rate cut, reporting such as “Bitcoin jumps to $94,000, but ‘hawkish’ Fed cut threatens the crypto rally” and broader market coverage of the decision recorded a move by Bitcoin toward $94,000 in the day before the widely anticipated announcement, and hundreds of millions of dollars in leveraged liquidations were reported as funding costs and policy expectations adjusted, which underlined the continued sensitivity of short term price action to interest rate signals.
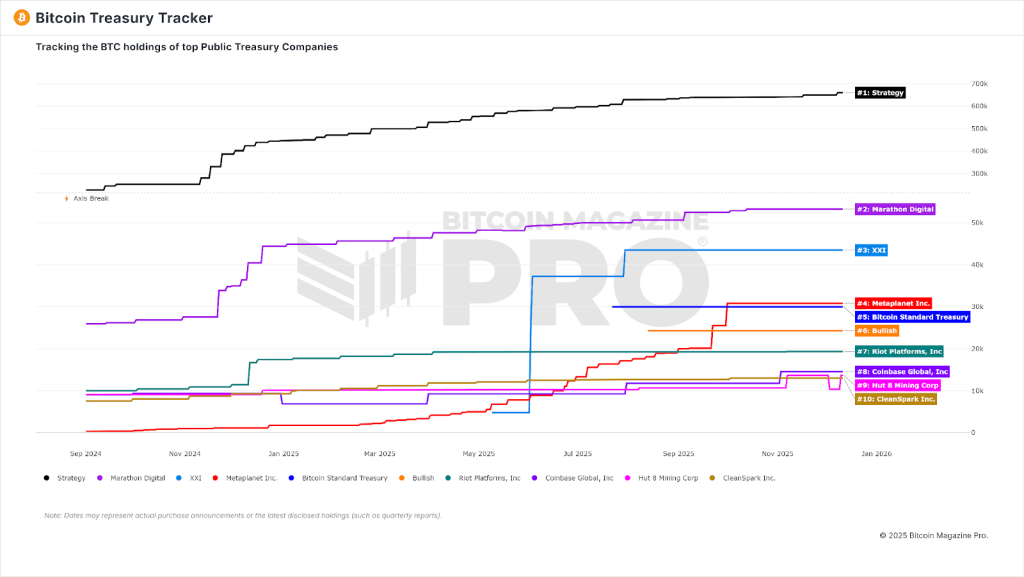
Source: https://www.bitcoinmagazinepro.com/charts/bitcoin-treasury-tracker
At the corporate level, a listed software and business intelligence company disclosed the purchase of 10,624 additional Bitcoin for roughly $963 million, which brought its treasury holdings to about 660,624 Bitcoin, or slightly more than 3% of the eventual 21 million coin supply, while a major private aerospace firm was reported to hold approximately $300 million of Bitcoin on its balance sheet as preparations continued for a potential large scale initial public offering. Through these actions, structurally important corporate buyers were shown to be adding on weakness in parallel with sovereign wealth funds and long horizon ETF investors. When this corporate accumulation was considered together with the constrained descending channel, defended support in the high $80,000s, resilient ETF assets despite occasional heavy outflow days, and a flow sensitive macro backdrop, the current environment was best summarized as a controlled correction phase. In that phase, the next decisive move was likely to be determined by how the ongoing stalemate between resistance near $94,000 and support around $88,000 was resolved, with any clear break from that band expected to set the tone for the remainder of the month.
Ethereum Market Analysis
Over the latest seven day period, ETH was traded between a weekly low near $2,931 and a high around $3,444, with the week closing close to $3,324 versus approximately $3,133 a week earlier, a gain of about 6%. Early in the window, consecutive declines were recorded on 4 and 5 December as closes slipped toward roughly $3,022 and intraday lows tested below $3,000, before a sequence of higher closes from 6 through 10 December lifted price back into the low $3,300s. The strongest single day move was registered on 9 December, when an advance of roughly 8% carried ETH from the low $3,100s toward the upper end of the weekly range and briefly outpaced BTC performance. When these candles are viewed together, a recovery from a mid week shakeout was observed, and the week was characterised by a transition from reactive selling into more consistent dip absorption within a still volatile range.
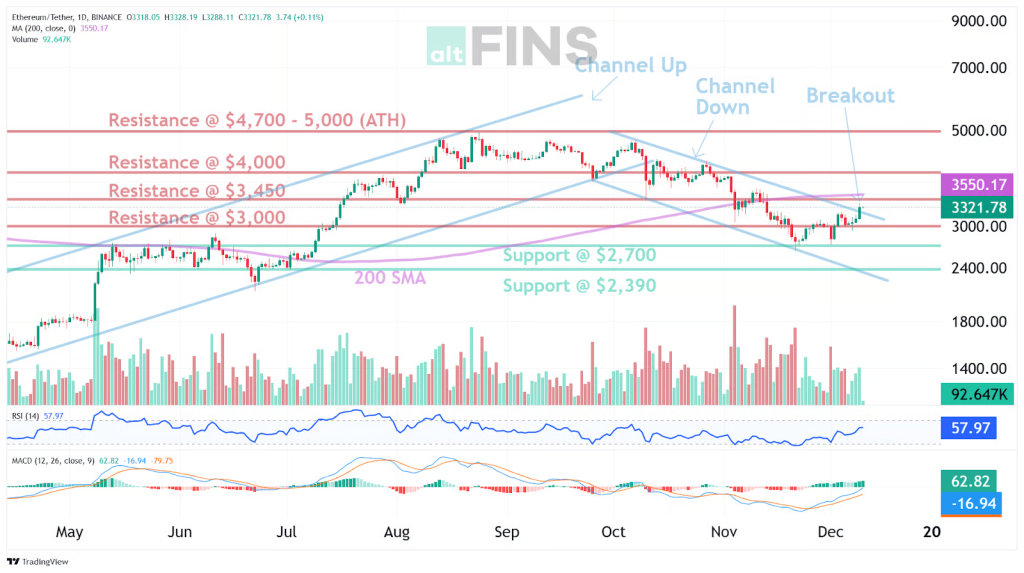
On the technical side, price was recorded as breaking above the upper boundary of a prior downward sloping channel that had been containing rallies for several months, so a completed Channel Down pattern has been signalled on the daily chart. Short term trend models shifted to an up condition, while medium term and long term composite trend scores remained weak, indicating that the current upswing is still developing within a broader corrective structure rather than inside a fully established primary uptrend. Momentum conditions were constructive, with the MACD line having crossed above its signal line about 27 days earlier and remaining in bullish territory, and the 14 day RSI hovering near 58, firmly between 30 and 70, which indicated that neither classical overbought nor oversold conditions were present. Average true range around $190 and spot trading just under the upper Bollinger Band near $3,331 suggested that volatility had expanded in line with the breakout but had not yet reached levels typically associated with exhaustion, so the move could be interpreted as an early stage bullish reversal attempt that still requires confirmation.
Key levels were clearly mapped, with immediate horizontal resistance identified around $3,450, followed by a higher resistance area near $4,000 and a broader supply zone between $4,700 and $5,000 that corresponds to the all time high region near $4,956, leaving ETH still roughly 35% below that peak and around 133% above the 52 week low near $1,385. The 200 day simple moving average was observed in an upward slope around $3,550, sitting just above spot and reinforcing the $3,450 to $3,550 area as a significant overhead cluster where the broken channel line, major horizontal resistance, and long term trend gauge converge. On the downside, nearest support was located around $2,700, with a deeper structural support band near $2,390 that aligns with prior consolidation and the lower boundary of the broader advance from last year’s lows. Invalidation of the bullish breakout thesis would be indicated by a sustained return of daily closes below $3,000, and more decisively below $2,700, which would place ETH back inside the former descending channel and imply that the recent strength had represented only a corrective rally; under such a scenario, any nascent talk of a broader altcoin season would be regarded as premature, as sustained leadership by ETH and other large caps has not been demonstrated yet.
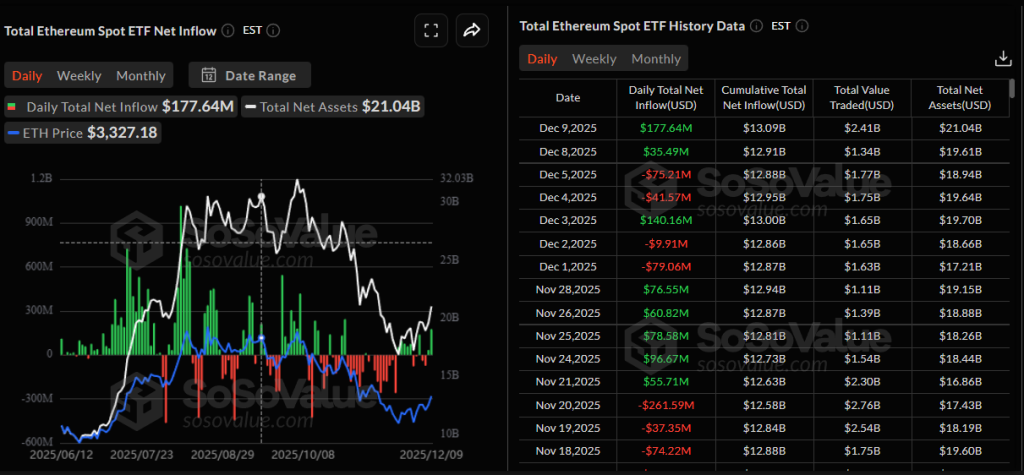
Source: https://sosovalue.com/assets/etf/us-eth-spot
Spot ETF flow data for Ethereum added an important layer to this picture. Across the most recent seven reporting days, aggregate spot ETH ETFs recorded net inflows of roughly $148 million, with the largest single day inflow, around $178 million, registered on 9 December, the same session that produced the strongest price advance toward the weekly high. Earlier in the period, outflows of approximately $79 million and $10 million were logged on 1 and 2 December, followed by a sharp $140 million inflow on 3 December, renewed redemptions near $42 million and $75 million on 4 and 5 December, and then a return to positive territory with inflows close to $36 million and $178 million on 8 and 9 December. When this flow series is compared with the price path, a coherent pattern can be seen in which early month selling through ETFs was met by renewed demand into the breakout, suggesting that institutional capital was added on strength rather than systematically faded, although a precise attribution of price moves to ETF flows alone cannot be made with confidence. As a result, ETF activity can be viewed as supportive but not yet decisive, with three day momentum in flows aligning with, rather than contradicting, the breakout in spot.
Major news during the period reinforced a structural narrative in which demand is shifting from simple price exposure toward yield bearing and tokenisation focused Ethereum allocations. A new U.S. filing for an Ethereum ETF that intends to stake a substantial share of its ETH and pass through staking rewards to shareholders was submitted, creating a framework in which on chain income can be accessed without operating validator infrastructure directly, while in Europe a physically backed product was launched that holds Lido’s staked ETH token and channels staking rewards inside a regulated exchange traded structure. At the same time, a large corporate treasury disclosed holdings of more than 3,800,000 ETH, valued at roughly $12 billion at recent prices, after adding approximately 138,000 ETH in a single week, an acquisition worth about $435 million, and this accumulation was framed as part of a stated objective to reach ownership near 5% of total ETH supply from a current level around 3%. These structural developments coincided with the 9 December session in which ETH rose about 8% in a day, lifted the ETH or BTC ratio to its highest level in several weeks, and revived discussion of periods during which ETH and selected large cap altcoins may lead market rallies, even as macro factors such as tariff discussions, policy uncertainty, responses from China, and movements in the dollar index continued to influence overall risk appetite in ways that cannot be quantified precisely. In this context, the near term ETH outlook can be framed around the contest between a developing bullish structure, supported by moderate ETF inflows and strengthening staking or tokenisation narratives, and a still negative medium term trend backdrop, with the $3,450 to $3,550 resistance band and the $3,000 to $2,700 support zone likely to define the next phase of price discovery unless an external macro shock forces a decisive break of these boundaries.
Today’s FOMC: Macro Backdrop For BTC And ETH
The Federal Reserve’s December meeting delivered another 25 basis point cut, taking the federal funds target range to 3.50 to 3.75 percent, the third reduction of 2025 and the lowest level in almost three years. A 9 to 3 split vote, with one member preferring a larger move and two favouring no change, underlined how divided the Committee has become on the pace of easing. Alongside the rate move, the Fed confirmed that it will resume buying Treasury bills to keep reserves “ample”; that decision expands the balance sheet, but officials are presenting it as liquidity management rather than classic quantitative easing, since purchases are concentrated in short dated bills and the policy rate remains well above zero.
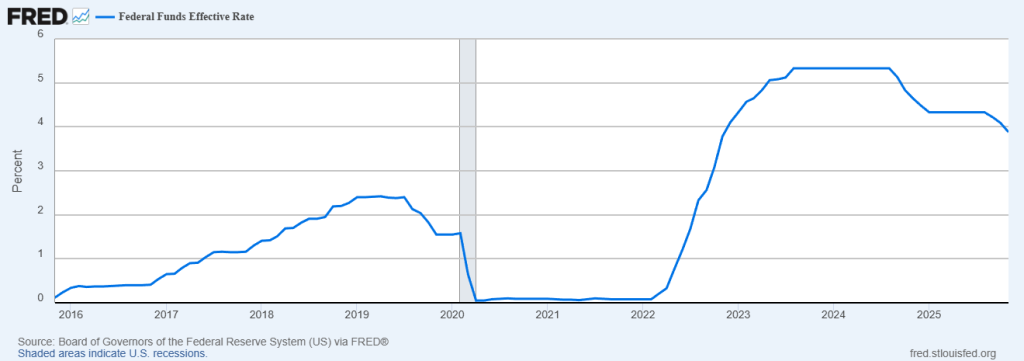
Source: https://fred.stlouisfed.org/series/FEDFUNDS
Traditional assets responded in a way that fits this middle ground. United States equity indices finished higher, led by modest gains in the S&P 500, front end Treasury yields moved lower, and the dollar softened, all consistent with slightly easier financial conditions after a widely anticipated cut. At the same time, the updated projections showed only limited additional easing pencilled in for 2026, and Powell avoided any suggestion of an open ended stimulus programme, so macro strategists have framed the outcome as near term supportive but still uncertain over the medium horizon, with incoming data and inflation prints expected to play a larger role in shaping the next moves.
In crypto, that mix of cautious cuts and renewed bill purchases has translated into volatility rather than a clear regime shift. Bitcoin reacted in a classic event whipsaw, spiking toward the upper end of its recent range and then fading back, leaving it well below the early October all time high yet still comfortably above the 52 week low, while net spot ETF flows remain roughly flat, sovereign allocations and corporate treasuries continue to add on weakness, and the overall pattern still resembles a controlled correction rather than forced liquidation. Ethereum is using the same backdrop more constructively, holding above its recent breakout, trading back in the low 3,000s, and leaning into the 3,450 to 3,550 dollar resistance cluster where horizontal supply, major moving averages, and prior trendline resistance converge; over the next few weeks, the strength of flows into staking oriented and tokenisation focused products is likely to determine whether this becomes a sustained leadership phase for ETH or simply another failed attempt to escape consolidation.
Mark Your Calendars
Economic Data Releases:
- December 18, 2025 (Thursday): CPI and Core CPI
Token Unlock
- December 12, 2025 (Friday): APT (APT) unlocks $19.45 M (0.74% of market cap)
- December 13, 2025 (Saturday): CHEEL (CHEEL) unlocks $11.04 M (2.86% of market cap)
- December 15, 2025 (Monday): CONX (CONX) unlocks $21.41 M (1.61% of market cap)
- December 15, 2025 (Monday): STRK (STRK) unlocks $13.30 M (5.07% of market cap)
- December 17, 2025 (Wednesday): ARB (ARB) unlocks $19.08 M (1.90% of market cap)