Liquidity Stress, Control Failures, and Institutional DeFi Meet a Fragile Tape
12th February 2026 • 10mins read
- South Korea crypto exchange Bithumb says system flaws led to $40 billion error: Bithumb told lawmakers its internal controls failed during a promotion, leading to an erroneous distribution valued above $40,000,000,000 after the system sent about 620,000 bitcoin instead of 620,000 won, with a processing lag and a failed holdings check cited as key breakdowns and some assets reportedly sold before accounts were frozen.
- BlackRock takes first DeFi step, lists BUIDL on Uniswap: BlackRock is enabling trading of shares in its tokenised US Treasury fund BUIDL on Uniswap, positioning the move as a bridge between institutional tokenised collateral and on-chain liquidity, with the fund described as about $2.2 billion in size at the time of reporting.
- Crypto lender BlockFills suspends withdrawals amid faltering bitcoin price: BlockFills temporarily suspended client deposits and withdrawals while continuing to support spot and derivatives trading, saying it was working to restore liquidity and communicating with institutional clients after a sharp bitcoin drawdown.
- US job growth surges in January, unemployment rate falls to 4.3%: US payrolls increased by 130,000 in January and the unemployment rate fell to 4.3%, with reporting also highlighting large benchmark revisions that reduced previously reported job gains across the prior year.
- China steps up crypto crackdown, will vet real-world asset tokens: China reaffirmed its ban on crypto activity, said unauthorised offshore issuance of yuan-pegged stablecoins is illegal, and signalled stricter vetting for offshore tokens backed by onshore Chinese assets, framing the move as tighter risk control around both stablecoins and tokenisation structures.
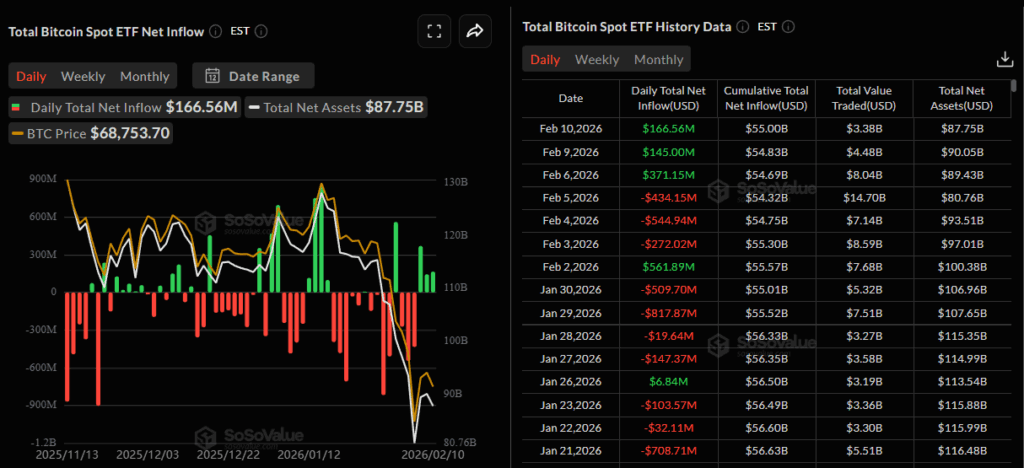
- US spot Bitcoin ETFs swing from heavy outflows to back to back inflows: US listed spot Bitcoin ETFs flipped from a run of large daily withdrawals into consecutive inflow days, signalling stabilising demand even as prices remained volatile, with the key weekly angle being whether this marks a genuine flow regime change or just a short covering bounce after capitulation.
- BlackRock’s IBIT hits a record $10,000,000,000 day in trading volume during the crash: IBIT saw record turnover as bitcoin sold off, a sign that the ETF has become a primary venue for fast risk transfer in stress events, and a useful weekly datapoint for explaining how institutional hedging and rebalancing can amplify intraday moves.
- BlackRock’s IBIT options trading spikes to a record 2,330,000 contracts as bitcoin drops: Options activity on IBIT surged to a single day record as traders rushed for downside protection, making this a clean weekly story about volatility demand, hedging pressure, and how ETF options can concentrate macro fear into one liquid instrument.
- Strategy adds 1,142 BTC during the crash as Saylor reiterates “no selling”: Strategy disclosed a modest additional bitcoin purchase during the drawdown, reinforcing its treasury accumulation playbook and keeping the corporate bid narrative alive even while broader risk appetite was being squeezed by rates and liquidation pressure.
- Strategy’s quarterly losses widen as bitcoin reprices, highlighting mark to market pain: Strategy posted sharply wider quarterly losses driven by the decline in bitcoin’s value, a headline that matters less for immediate solvency and more for optics, funding conditions, and how quickly treasury volatility can spill into equity sentiment for crypto exposed public companies.
- Leveraged “looped” $2,000,000,000 ETH long unravels after ETH drops under $2,000: A heavily levered ETH position built via borrowing stablecoins against ETH collateral on Aave was forced to unwind when ETH fell below $2,000, with tracking data estimating roughly a $686,000,000 loss and large ETH transfers to exchanges used to repay debt, a clear example of how DeFi leverage can turn a price break into accelerating sell pressure.
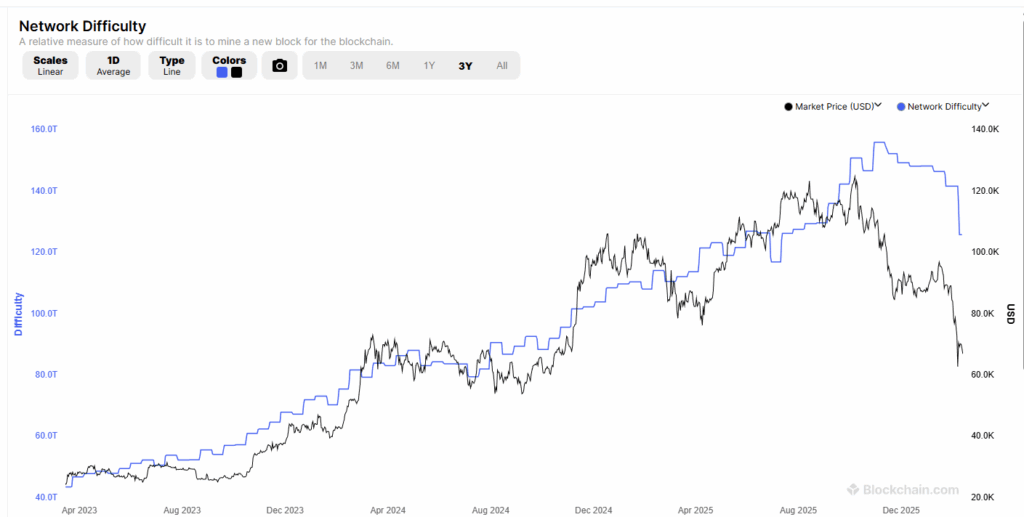
- Bitcoin mining difficulty drops 11.16%, the sharpest negative adjustment since 2021: Bitcoin’s network difficulty adjusted down to around 125.86 trillion after block times slowed, signalling a meaningful hashrate retreat and some miner capitulation dynamics, which matters because difficulty declines can temporarily improve miner margins and reduce forced selling pressure if price stabilises.
- Bitcoin whales move about $4,700,000,000 into cold storage during the dip: Accumulator style addresses received about 66,940 BTC in a single day, a move valued near $4,700,000,000 at roughly $70,000 per BTC, framing the week as a tug of war between panic selling and large holders treating liquidation driven weakness as an inventory restock moment.
- Ripple partners with Aviva Investors to tokenise funds on XRP Ledger: Aviva Investors and Ripple announced plans to bring traditional fund structures onto the XRP Ledger, positioning the deal as an institutional tokenisation rail story in Europe and a sign that on-chain fund issuance is expanding beyond pilot narratives into named asset managers testing production pathways.
- Hong Kong SFC moves to allow margin financing and sets a framework for crypto perpetuals for professional investors: Hong Kong’s regulator outlined steps to broaden licensed offerings, including margin financing that can use virtual assets as collateral and a high level framework to enable perpetual contracts on licensed platforms for professional investors, a notable market structure shift that aims to deepen liquidity while keeping tighter eligibility and risk controls.
- Britain’s FCA asks platforms to block crypto exchange HTX from UK users: The UK Financial Conduct Authority escalated its case against HTX by asking major social platforms and app stores to restrict UK access, arguing the exchange has been illegally promoting crypto services to UK consumers without authorisation, and framing this as an enforcement test of the UK’s financial promotions regime for offshore crypto firms.
- SEC Chair Paul Atkins pressed in Congress over crypto enforcement pull-back: US lawmakers questioned Atkins on the SEC’s decision to pause or drop certain crypto matters and what that implies for enforcement priorities, with the hearing spotlighting concerns about consistency, transparency, and how the agency will handle high-profile crypto cases going forward.
- Malaysia’s central bank onboards stablecoin and tokenised deposit initiatives for wholesale payments: Bank Negara Malaysia brought in three initiatives that involve stablecoins and tokenised deposits aimed at wholesale payment use cases, signalling a policy backed push to test new settlement rails while keeping the focus on controlled pilots rather than open retail issuance.
- Tokenised equities near $1,000,000,000 as a few platforms dominate early market share: The tokenised equity segment has grown rapidly toward the $1,000,000,000 mark, with the market described as highly concentrated across a small number of venues, making it a useful weekly story about institutional style rails maturing even while spot crypto volatility remains elevated.
- Bitfarms says it is “no longer a Bitcoin company” as it doubles down on HPC and AI data centres: Bitfarms outlined a strategic shift away from being framed primarily as a bitcoin miner, positioning its future around building and operating high performance computing and AI infrastructure, a continuation of the broader theme that energy heavy mining footprints can be repurposed into data centre capacity.
- Bitcoin miner Cango sells $305,000,000 of BTC during market slump to fund AI shift: Cango sold 4,451 BTC for about $305,000,000, and said the proceeds would be used to reduce leverage and support a strategic pivot toward AI compute infrastructure, making it a clean example of miners using treasury assets to retool their business model when market conditions tighten.
- Galaxy announces a $200,000,000 share repurchase program: Galaxy launched a buyback authorisation of up to $200,000,000, positioning it as a balance-sheet confidence signal after a volatile period for crypto-linked equities, and giving a weekly angle on how listed crypto firms try to stabilise sentiment when underlying markets are stressed.
- Analysts react as Robinhood slumps 10% with slowdown in crypto trading weighing on results: Robinhood’s update highlighted a crypto trading slowdown, including a sharp year on year drop in crypto-related revenue, and the share price reaction made the point that retail-facing platforms remain highly sensitive to volatility regimes and transaction volumes.
- Citi cuts Coinbase price target to $400 after stock’s 65% plunge from record high: Citi lowered its Coinbase price target to $400 from $505, citing a weaker trading backdrop and the hit to crypto sentiment, which sets up a weekly segment on how quickly exchange equity expectations re-rate when prices, volumes, and policy timelines move against the industry.
- Hong Kong regulator works to allow perpetual contracts and expand margin financing in its licensed crypto market: Hong Kong’s Securities and Futures Commission outlined steps toward a framework for perpetual contracts aimed at professional investors, alongside guidance that would allow licensed brokers to extend virtual-asset related margin financing under specified conditions, reinforcing the theme of regulated leverage being brought onshore with tighter eligibility and risk controls.
Bitcoin Market Analysis
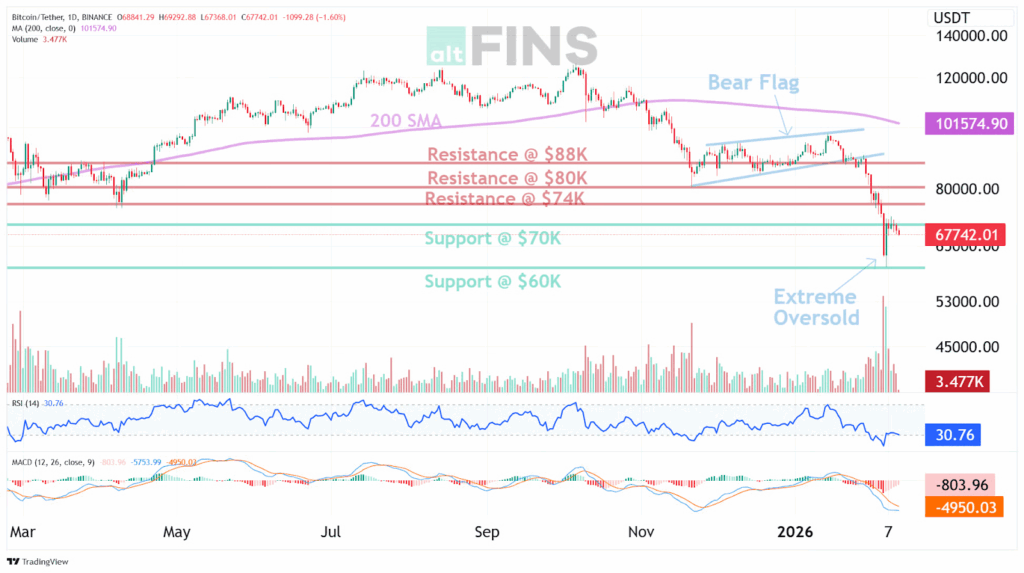
Bitcoin was marked lower over the past week, with the weekly performance having been recorded at approximately -7.79% and price having been seen in the mid US$60,000s after a sharp repricing from the prior range. Daily trading was characterised by heavy downside continuation into the week’s low near US$65,738.52, followed by stabilisation attempts that left price near US$67,000 to US$68,000. A representative daily session was printed with an open at US$68,841.29, a high at US$69,292.88, a low at US$67,368.01, and a close at US$67,742.01, reflecting persistent supply into rallies and weak closing strength.
Source: https://altfins.com/technical-analysis
Downtrend conditions were reinforced across common trend horizons, with short, medium, and long duration trends having been assessed as strongly negative in the available indicator set. Momentum was registered as bearish, with the MACD having remained below its signal line and a negative MACD reading having been maintained, while a rising histogram was noted as a sign that downside momentum may have been moderating, though confirmation was not provided by a trend reversal signal. RSI conditions were registered near the lower bound of neutral, with RSI (14) around 30.76 and the market having been described as previously having reached extreme oversold conditions, although an RSI below 20 could not be verified from the current indicator snapshot. Volatility was reflected by an ATR around 4,262.40, while Bollinger Bands were framed with an upper band near US$93,985.91 and a lower band near US$60,151.61, placing the current price closer to the lower half of the range.
Key levels were clearly defined and were respected in market structure. Support was identified at US$70,000 and more materially at US$60,000, with the lower band region having been aligned with the same zone, and a local low having been printed close to that area. Resistance was placed at US$74,000, then US$80,000, and higher at US$88,000, with US$80,000 having been treated as a former floor that was converted into overhead supply after the breakdown. A commonly used invalidation level for tactical longs was set at US$57,000, implying that a loss of the US$60,000 support zone and follow through below US$57,000 would be required before the dip buy framework would be invalidated. Longer term context remained restrictive, with a 200 day moving average having been positioned far above spot near US$101,574.90, and most shorter moving averages having been oriented downward, indicating that any recovery would have been occurring under a still negative trend regime.
Near term expectations were therefore constrained by structure rather than by sentiment narratives. A retest of the US$60,000 support zone could not be ruled out given the prior impulse into that area and the absence of a confirmed trend reversal, while a recovery phase would typically be expected to face friction into US$74,000 first and then US$80,000 if upside continuation were achieved. The technical setup that was described as “oversold at support” was consistent with a mean reversion bounce framework, but it was also emphasised by the prevailing downtrend that upside follow through would need to be proven through higher lows and sustained reclaim of resistance rather than assumed. Risk was kept explicit through the US$57,000 invalidation, and the level structure was sufficient to keep outcomes falsifiable as support and resistance were tested.
Source: https://sosovalue.com/assets/etf/us-btc-spot
Spot Bitcoin ETF flows were characterised by sharp day to day reversals and were not rendered directionally decisive on a net basis across the observed week. Aggregate net flow across seven sessions was calculated at approximately -$6.51 million, despite large opposing daily prints that included a +$561.89 million inflow and a -$544.94 million outflow, with the outflow magnitude having been widely highlighted under ETF outflows. A constructive three day sequence was later recorded, with +$371.15 million, +$145.00 million, and +$166.56 million posted on consecutive sessions, and a high turnover day was also observed with $14.70 billion in value traded alongside a -$434.15 million net outflow. Market narrative was simultaneously shaped by stress events, with the Bithumb error having been described as a control failure behind an erroneous distribution valued above $40,000,000,000, and a further liquidity signal having been raised when the BlockFills halt was reported as a suspension of client deposits and withdrawals while certain trading functions continued.
Source: https://www.blockchain.com/explorer/charts/difficulty
Balance sheet and supply side pressures were reinforced through miner and corporate actions, while accumulation behaviour was also reported at size. An 11.16% decline in network difficulty was framed as the largest negative adjustment since 2021 in coverage of the difficulty drop, a move that was presented as consistent with miner stress during the drawdown. At the same time, large holder behaviour was described as supportive, with roughly $4,700,000,000 said to have been moved into long term holding wallets during the dip in the whale cold storage reporting, although address attribution and motive were not independently verifiable from that claim alone. A parallel reallocation theme was also reinforced by reports of corporate treasury selling to fund compute infrastructure initiatives, including a sale described as $305,000,000 in the Cango sale, which added a tangible spot supply channel alongside the broader repricing in risk appetite.
Ethereum Market Analysis
Ethereum was volatile across the February 6 to February 12 window, with a 7 day high of US$2,147.34 and a 7 day low of US$1,755.31. A sharp rebound was printed on February 6, when a US$1,826.88 open was followed by a 2,063.22 close after a US$1,755.31 intraday low, before downward follow through was registered into midweek. A sequence of lower closes was then recorded from February 9 through February 12, with closes of US$2,104.66, US$2,020.18, US$1,942.16, and US$1,959.96, leaving the period down 103.26 points, about 5.00%, from the February 6 close to the February 12 close. A US$2,000 handle was traded around repeatedly during the week, and a close below that level was printed on February 11 and February 12, which was consistent with weak short term tape.
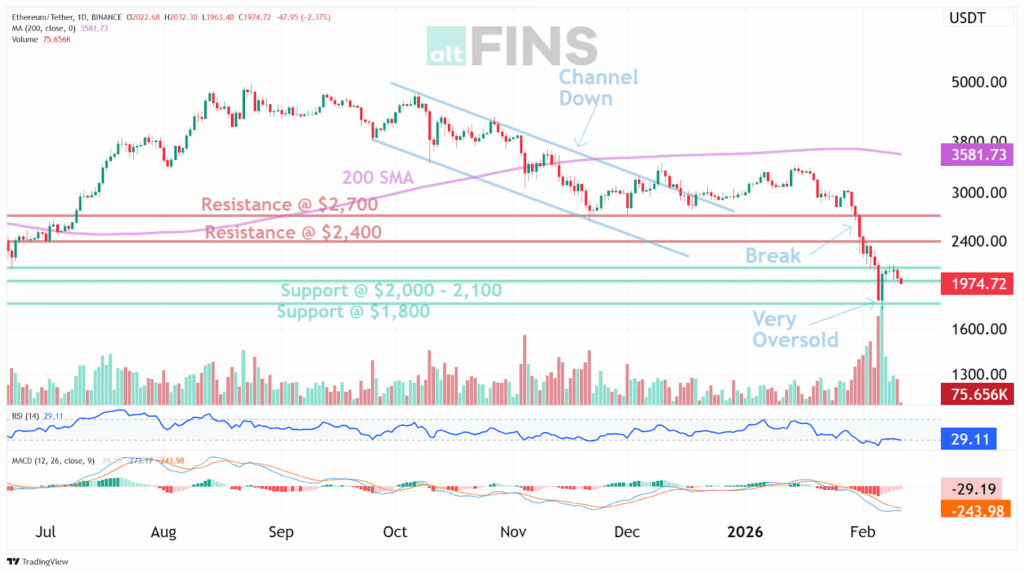
From a structure perspective, the week was defined by a failed attempt to sustain above US$2,100 after the February 8 and February 9 highs, followed by renewed selling pressure into the US$2,000 area. The most active rejection zone was established between US$2,100 and US$2,147, where successive highs were capped and downside continuation was resumed. The most immediate support band was set by the February 11 low at US$1,903.93 and the February 10 low at US$1,993.29, with the 7 day extreme at US$1,755.31 remaining the dominant swing low for the period. A clean invalidation point for any near term stabilisation narrative was left at that US$1,755.31 low, because a lower low would have confirmed that the rebound was fully exhausted and that a fresh leg down was being extended.
Price action was defined by repeated tests of the US$2,000 handle while being capped by supply in the US$2,100 to US$2,150 zone, where successive rebound attempts were rejected. The week’s structure left US$2,147 as the near term swing high reference, with downside risk framed by the US$1,903 area first and the US$1,755 swing low as the key invalidation point for any stabilisation attempt. A constructive shift in tone required daily closes to be re established above 2,000 and then accepted back through US$2,100 to US$2,150, because that band had functioned as the primary rejection zone throughout the period.
Source: https://sosovalue.com/assets/etf/us-eth-spot
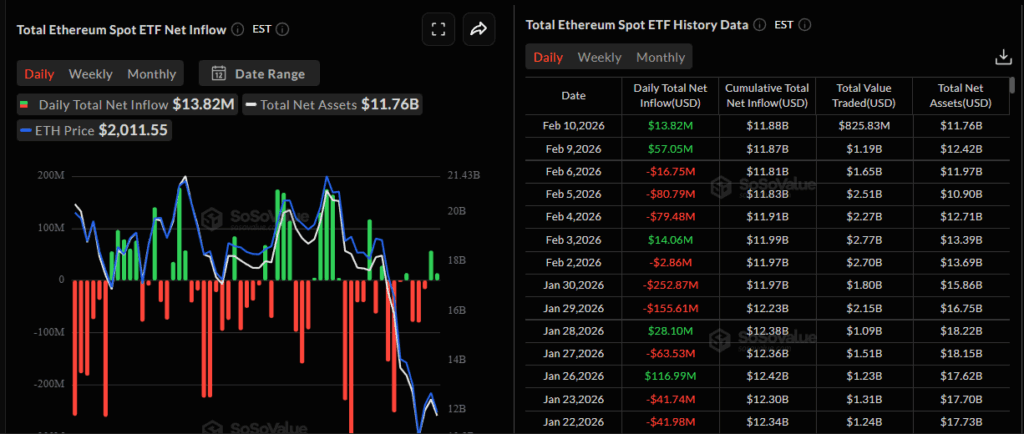
Spot Ethereum ETF flow conditions were mixed, with a net outflow of about $94.95 million across the February 2 to February 10 trading window shown in the available daily series, and the largest absolute daily move being the $80.79 million outflow recorded on February 5. A positive shift was then registered into the end of the sequence, with February 9 and February 10 printing inflows of $57.05 million and $13.82 million, following a $16.75 million outflow on February 6, which left the most recent three reported sessions net positive by about $54.12 million. Total net assets were shown at $11.76 billion on February 10 in that same series, which was below the $13.69 billion level shown on February 2, and the combination was consistent with a market where price pressure had been accompanied by a reduced ETF asset base even as late week flow momentum improved.
The dominant news driver for the week was described as a deleveraging event tied to a large looped long that was reported to have unraveled after ETH traded below US$2,000, which was consistent with forced selling dynamics around a major psychological level. Broader risk sentiment was also reported to have been shaped by macro cross currents, including volatility in risk assets and sensitivity to liquidity conditions, with that framing having been reinforced by coverage of market volatility across crypto and correlated risk benchmarks. The week was therefore best characterised as a structurally weak tape that was being tested at a key psychological threshold, with late week ETF inflow improvement being treated as a supportive data point in contemporaneous commentary on ETF inflows, but with confirmation still having been required through sustained daily closes back above US$2,000 and subsequent acceptance above the US$2,100 to US$2,150 rejection zone.
Macro Tightness Pressures Crypto
This week still felt like the market is expecting rates to stay high for longer, not like it is leaning into a quick policy shift. After the January jobs report, traders pulled back on near term cuts, which kept the overall mood cautious. When that happens, it is not just a “Fed story,” it changes everyday decisions across markets, because anything that depends on cheaper money has to wait longer for relief.
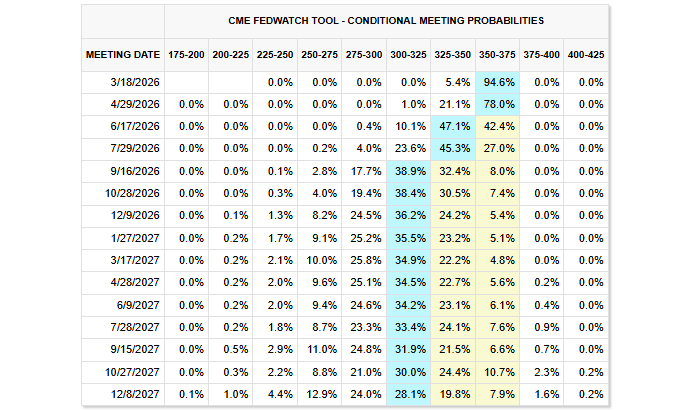
Source: https://www.cmegroup.com/markets/interest-rates/cme-fedwatch-tool.html
At the same time, the jobs picture is sending a softer signal than it did a few quarters ago, but it is doing it gradually. The unemployment rate has moved to 4.3 percent in January 2026, after 4.4 percent in December 2025 and 4.5 percent in November 2025. That is the kind of change that suggests the labour market is losing a bit of heat, even if month to month noise can mask it. It also explains why the “slowdown” narrative is still alive even when a single jobs print looks decent.The key detail is what the report actually said, not just how people reacted to it. In January, the economy added 130,000 jobs, which was enough to support the idea that there is no urgent need to rush into cuts. That is where the push and pull comes from, cooling is showing up, but not fast enough to force an immediate change in expectations. So instead of a clean turning point, you get a market that keeps checking the next data point like it is a new chapter, even though the plot is mostly the same.
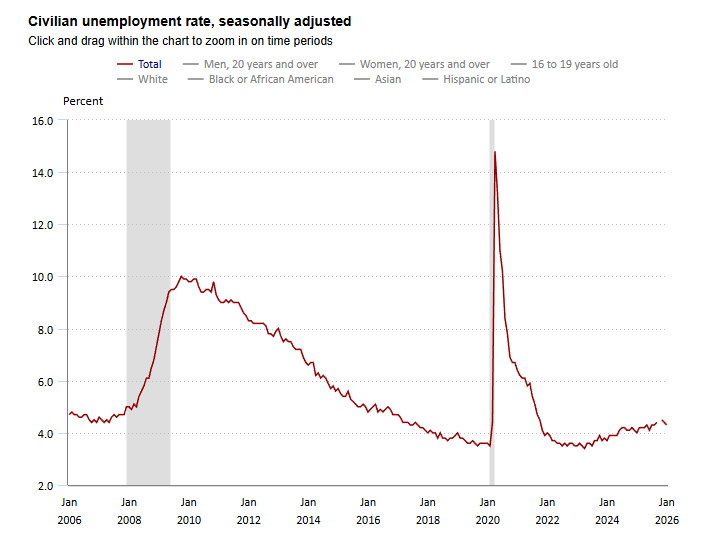
Source: https://www.bls.gov/charts/employment-situation/civilian-unemployment-rate.htm
That backdrop matters for Bitcoin in a pretty simple way. When rates are expected to stay high, holding cash is not just “sitting out,” it pays, and that shifts what people are willing to hold. Bitcoin is also a kind of mood ring for the broader crypto market, so when it gets heavy, a lot of the rest of the space tends to feel it too. It is less about one scary crypto headline, and more about people choosing to be picky with risk when money is still expensive. So the recent drawdown reads like a reset driven by the macro backdrop, not a single catalyst. If the next few weeks bring more signs that jobs are cooling in a way that markets cannot ignore, or if inflation data surprises on the downside, expectations could shift and the pressure can ease. But until you see that shift show up consistently, the market tends to stay cautious, and Bitcoin tends to trade like it is waiting for the same thing everyone else is waiting for.
Mark Your Calendars
Economic Data Releases:
- February 18, 2026 (Wednesday): Minutes of Fed’s January FOMC meeting
- February 20, 2026 (Friday): PCE index and Core PCE index
Token Unlock
- February 14, 2026 (Saturday): CONX (CONX) unlocks US$15.92 M
- February 16, 2026 (Monday): ARB (ARB) unlocks US$10.07 M
- February 16, 2026 (Monday): YZY (YZY) unlocks US$20.82 M
- February 20, 2026 (Friday): ZRO (ZRO) unlocks US$54.24 M
- February 20, 2026 (Friday): KAITO (KAITO) unlocks US$10.39 M