Sovereign ETF Accumulation
19th February 2026 • 10mins read
This Week’s Recap
- Abu Dhabi’s Mubadala boosts its BlackRock IBIT position to about $630.6 million: Mubadala’s Q4 2025 13F shows 12.7 million shares of IBIT valued at about $630.6 million as of December 31, 2025. The same coverage grouped Mubadala with another Abu Dhabi entity holding IBIT, taking the combined stake to roughly $1.386 billion.
- Mubadala doubles down on IBIT as 13F filings show a 46% jump in shares: The Reuters-cited update says Mubadala increased IBIT shares by 46% from 8.7 million to 12.7 million by December 31, 2025. It also cites Al Warda Investments with an IBIT position valued around $408 million, putting the combined Abu Dhabi exposure at about $1.386 billion.
- Mystery Hong Kong firm Laurore Ltd disclosed a roughly $436 million IBIT stake: Laurore Ltd’s 13F for the quarter ended December 31, 2025 shows 8.79 million IBIT shares valued at roughly $436 million. The filing stood out because the entity surfaced as a large new holder with a limited public footprint.
- Strategy acquires 2,486 BTC and now holds 717,131 BTC: Strategy’s February 17, 2026 Form 8-K says it purchased 2,486 BTC and lifted total holdings to 717,131 BTC. The disclosure keeps the accumulation cadence intact through a volatile tape.
- Goldman Sachs CEO David Solomon says he owns a “very limited” amount of Bitcoin: Solomon said he holds a very small personal amount of Bitcoin while stressing the need to understand how crypto and finance are converging. He did not disclose position size or holding period in the remarks covered.
- Binance converts its $1,000,000,000 SAFU fund into 15,000 BTC: Binance finished moving its emergency SAFU reserve into Bitcoin, ending with 15,000 BTC after a final purchase that brought the stash to roughly $1.0 billion at the time. This matters because it turns a user-protection fund into a BTC-denominated reserve, so its value now moves with Bitcoin’s price.
- Bitcoin holds near $68,000 while the market struggles to reclaim $70,000: Bitcoin is hovering around $68,000 and still has not regained a clean hold above $70,000 after the early-month flush toward $60,000. The key implication is that the bounce is real, but the market is still treating $70,000 as the line that separates relief from a broader downtrend.
- Bitmine says it holds 4,371,000 ETH and targets up to $252,000,000 in annual staking revenue at scale: Bitmine is positioning itself as a corporate-scale Ethereum holder, with most of its ETH already staked and a runway to scale staking income toward a stated $252 million annual figure. The point to watch is whether this becomes a repeatable corporate-treasury playbook for ETH, not just a one-off balance sheet headline.
- BlackRock seeds its iShares Staked ETH ETF with 4,000 shares, $100,000: BlackRock has started the mechanics of launching its staking-focused ETH product by seeding the trust, with the proceeds intended to buy and stake ETH. This is the first concrete step that turns the concept into an operable product pipeline, and it sets expectations for how staking will be implemented inside an ETF wrapper.
- BlackRock and Coinbase to keep 18% of staking revenue in the proposed ETHB structure: The proposed setup takes an 18% cut of gross staking rewards before investors receive the remainder, which directly reduces net yield versus native staking. For allocation decisions, the fee split is the headline, because it frames how much of the staking carry investors are actually buying through the ETF.
- Brevan Howard’s BH Digital Asset fund fell about 29.5% in 2025: BH Digital posted its worst annual decline since launching in 2021, as crypto and related venture positions lagged Bitcoin through the year. The drawdown also landed alongside leadership change at the unit, with Gautam Sharma replaced by Chris Rayner-Cook.
- Canary launches the first spot Sui ETF with staking, ticker SUIS: Canary’s SUIS is positioned as regulated spot SUI exposure where staking rewards are reflected through the product’s structure. It extends the US spot ETF expansion beyond BTC and ETH into a proof of stake asset with native yield.
- Hyperliquid launches a DeFi policy center backed by 1,000,000 HYPE tokens: Hyper Foundation committed 1,000,000 HYPE, described as roughly $29 million at the time, to fund the Hyperliquid Policy Center in Washington. The stated aim is to push for clearer US rules around DeFi, especially for market infrastructure like perpetuals.
- Peter Thiel’s Founders Fund exits ETHZilla, per SEC filing: The filing shows entities linked to Founders Fund reporting zero shares, fully exiting the position after previously disclosing a stake. The move lands while “ETH treasury” trade narratives have been under pressure.
- XRP Ledger activates a permissioned, members-only DEX feature for regulated institutions: XRPL activated the Permissioned DEX amendment, allowing controlled versions of its built-in DEX where approved entities can decide who may place and take orders. The design targets compliance constraints like access control and participant screening while keeping trading on-chain.
- Riot stock jumps after Starboard urges an AI data center push: Starboard Value told Riot to move faster on AI and high performance computing deals, arguing Riot’s 1.7 GW power footprint is a strategic edge. The stock moved sharply on the letter, highlighting how quickly the market is repricing miners that can monetise power as data center capacity.
- Milo crosses $100m in crypto mortgages and closes a record $12m transaction: Milo says it has passed $100 million in crypto-backed mortgage originations and completed its largest single deal at $12 million. The significance is that borrowers can access liquidity against crypto without selling, which keeps this as a live use case even during choppy markets.
- Apex Group to pilot Trump-affiliated WLFI stablecoin USD1 for tokenized funds: Apex says it will test USD1 for subscriptions, redemptions, and distributions inside its tokenized fund workflows. This is a straight-through settlement experiment that could reduce frictions if it works at scale.
- American crypto holders say they are scared and confused about new IRS tax rules: A poll of 1,000 U.S. crypto holders by Awaken Tax found many are worried about penalties as reporting shifts toward automatic broker reporting. The immediate takeaway is that compliance uncertainty is still a demand drag, even when price and adoption narratives improve.
- Nakamoto to acquire BTC Inc and UTXO in a $107m all-stock deal: Nakamoto, described as a Bitcoin treasury company, signed definitive agreements to buy BTC Inc and UTXO Management GP in an all-stock transaction valued at $107 million. This consolidates a Bitcoin media and services footprint under one corporate umbrella, with the deal framed as part of building a Bitcoin-native operating company.
- Bitcoin stays near $68,000 as the market struggles to reclaim $70,000: Bitcoin is hovering around $68,000 with $70,000 still acting like the level the market needs to clear for cleaner momentum. The main implication is that price has stabilised after the flush, but the tape is still sensitive to broader risk sentiment.
- Moonwell confirms about $1.8m bad debt after a cbETH oracle misconfiguration: Moonwell took a hit after cbETH was mispriced around $1, which let liquidators repay almost nothing and seize collateral, leaving roughly $1.8 million in bad debt. This is another reminder that even “blue chip” DeFi can fail on integration and configuration, not just smart contract code.
- Aave “Aave Will Win” plan aims to route 100% of product revenue to the DAO: Aave Labs is pushing a framework that would send all Aave-branded product revenue to the DAO treasury, reframing the DAO as the cashflow owner rather than a governance wrapper. If it sticks, it tightens the link between usage and treasury value capture.
- Polygon flips Ethereum on daily fees as Polymarket activity spikes: Polygon briefly generated more daily fees than Ethereum, with the surge tied to heavy prediction market activity on Polymarket. The implication is that app-driven bursts can temporarily reshape chain revenue rankings, even when average fees stay low.
- Brevan Howard’s BH Digital Asset fund fell about 29.5% in 2025: BH Digital logged a roughly 29.5% loss for 2025, marking its worst year since launching in 2021. The piece also ties the drawdown to a leadership change inside the unit.
- Canary launches the first spot Sui ETF with staking, ticker SUIS: Canary launched SUIS, a spot Sui ETF that incorporates staking into the product structure. It extends the US spot ETF wrapper beyond BTC and ETH into a proof of stake asset with native yield mechanics.
- Hyperliquid launches a DeFi policy center backed by 1,000,000 HYPE tokens: Hyper Foundation committed 1,000,000 HYPE tokens to fund the Hyperliquid Policy Center in Washington. The stated goal is to push for clearer US policy treatment for DeFi market infrastructure.
- Peter Thiel’s Founders Fund exits ETHZilla, per SEC filing: The filing shows entities linked to Founders Fund reporting zero shares, fully exiting the position. It lands while “ETH treasury” style exposures have been closely watched after recent volatility.
- XRP Ledger rolls out a members-only DEX for regulated institutions: XRPL activated a Permissioned DEX feature that lets approved venues restrict who can place and take orders. The change is designed to support compliance requirements like participant screening while keeping trading on-chain.
Bitcoin Market Analysis
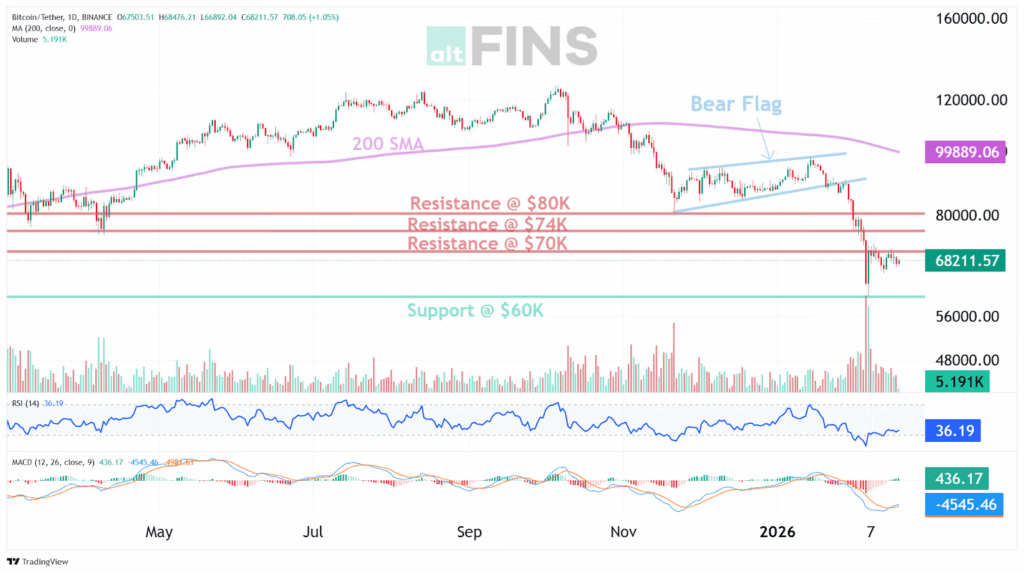
Over the seven days from February 13 to February 19, 2026, Bitcoin was closed lower, moving from $68,928 to $66,888, a decline of 2.96 percent. A high of $71,007 was reached during the week, and a low of $65,958 was set, so price was moved across a $5,049 span. Several attempts to hold above $70,000 were not maintained into the close, and the week was finished closer to the lower end of the range. Daily trading was therefore marked by a bounce early in the window, followed by renewed selling pressure.
Source: https://altfins.com/technical-analysis
A clear downtrend was indicated across short, medium, and long timeframes, and most moving average signals were pointed lower. A bullish MACD crossover was stated to have occurred 27 days earlier, which was consistent with improving momentum compared with the weakest part of the decline, even while the broader trend remained negative. RSI readings on the commonly used 14 period setting were described as neutral at present, and an earlier extreme oversold reading below 20 was stated to have occurred as price approached the $60,000 area. Price swings were described as large, with ATR cited at 3,666.96, and Bollinger Bands cited near $61,849 on the lower side and $78,722 on the upper side, placing recent trading closer to the lower side of that band.
The $60,000 zone was treated as the nearest major support area, with $70,000 marked as the nearest resistance, followed by $74,000. The week’s low at $65,958 was set above $60,000, yet it was set close enough for downside risk to remain tied to that support zone. A clear line for a breakdown risk was most cleanly placed below $60,000, because that level was presented as the key support reference and was also near a cited 52 week low around $60,006. On the upside, a sustained move back above $70,000 on daily closes would be needed before a stronger shift in tone could be justified, and any move toward $74,000 would still be treated as a test of resistance unless the broader trend signals also improved.
A sideways phase between $60,000 and $74,000 was presented as the base case, because momentum was described as improving while trend signals were still described as strongly negative. That mix was consistent with price being supported after an oversold event, while still being held back by the larger downtrend. Stronger conclusions were not supported by the available indicators alone, because the downtrend labels were still described as strong even after the MACD improvement. Any shift from a range to a renewed uptrend would remain uncertain without clearer evidence that selling pressure was no longer dominating the medium term picture.
Source: https://sosovalue.com/assets/etf/us-btc-spot
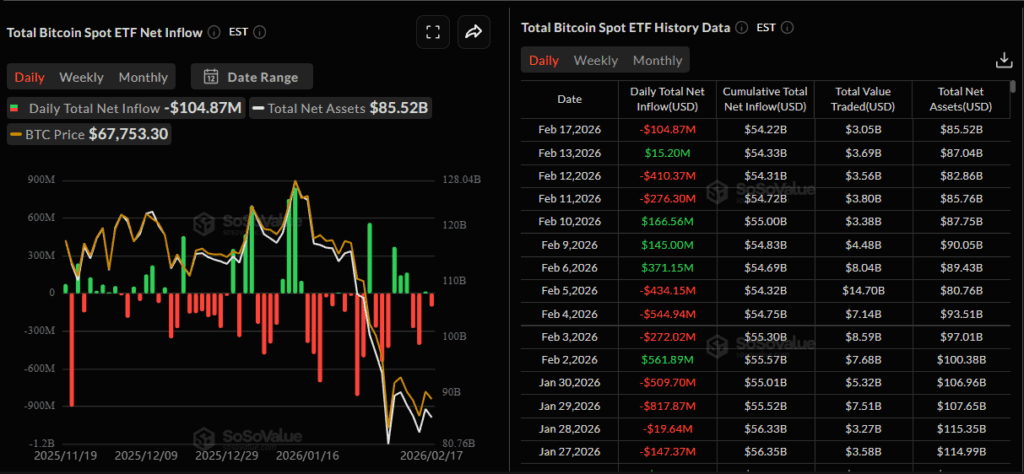
Spot Bitcoin ETF flows were described as choppy, with large inflows and outflows alternating across the period shown. Across the most recent seven entries presented, net flow was slightly negative at about $93.63 million of net outflows, even though several strong inflow days were included. The largest one day move in that seven entry window was shown as a $410.37 million net outflow, and the most recent three entries shown were negative overall at about $500.04 million of net outflows. Total net assets were shown at $85.52 billion on the latest date displayed, and a decline from $100.38 billion to $85.52 billion was shown between February 2 and February 17, while the split between flow impact and price impact could not be confirmed from the figures alone.
Mubadala was shown in US filings as having raised its BlackRock IBIT position to about $630.6 million, or 12.7 million shares, as of December 31, 2025, with coverage also noting a 46 percent increase in shares from 8.7 million to 12.7 million over the quarter. Laurore Ltd was shown as disclosing a roughly $436 million IBIT stake, or about 8.79 million shares, as of the same date, which added another large holder to the latest 13F cycle. Strategy bought 2,486 BTC, taking reported holdings to 717,131 BTC in a Form 8-K dated February 17, 2026. Binance converted SAFU, shifting the reserve into 15,000 BTC. Nakamoto to acquire BTC Inc and UTXO in a reported $107 million all stock deal, adding a Bitcoin treasury company angle to the week’s backdrop. A “very limited” personal Bitcoin holding was also acknowledged by Goldman Sachs CEO David Solomon with no size disclosed, so it was treated as colour rather than a measurable allocation.
Ethereum Market Analysis
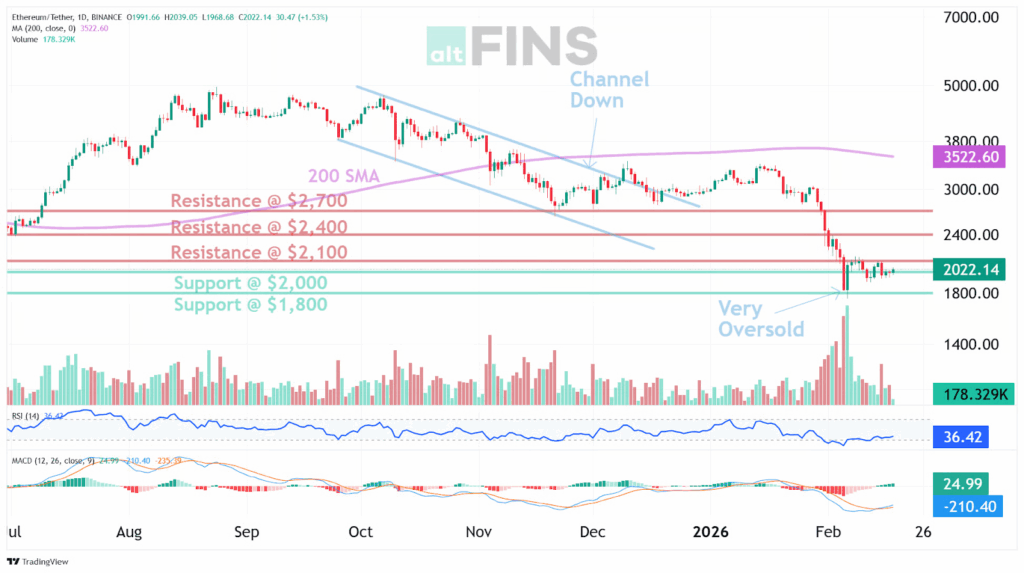
Ethereum fell over the last seven days, with the close moving from $2,049.30 on February 13 to $1,967.17 on February 19, a drop of about 4.0%. The highest intraday level in that span was $2,105.94 on February 14, and the lowest was $1,924.68 on February 18. A sharp down day was seen on February 15, when a move from the low $2,000s was followed by a close near $1,966, before trading settled into a choppy, slightly steadier pattern into February 19.
Source: https://altfins.com/technical-analysis
The broader picture still showed weakness across short, medium, and long time horizons, with most shorter moving averages still pointing down. At the same time, some momentum measures were described as improving, including a bullish MACD condition, while common RSI readings were described as neutral at the time of the snapshot. A very strong ADX reading was noted, which usually means the current direction tends to carry on unless a clear reversal is built. Day to day swings were also not small, with an ATR near $150, and the recent price range sitting between Bollinger Bands near $1,778 and $2,376.
The key price areas were simple. A support zone was set at $1,800, and resistance zones were set at $2,100 and then $2,400. An extreme oversold reading was described near the $1,800 area earlier, and heavy trading volume was noted there, which is often taken as a sign that strong buying interest was present at that level. The area around $2,100 was treated as a point where price could pause or be pushed back, because levels that once held as support often turn into resistance after they are broken.
Based on the current shape of the chart, a rebound was left possible, but the trend was still down until a clear change was shown in daily closes. A move up toward $2,100 was positioned as the first major test, and a move toward $2,400 was framed as the next hurdle only if the earlier resistance was cleared and held. The main risk boundary was tied to the $1,800 zone, because a sustained break below that area would mean the recent bounce point had failed. A tighter invalidation point was not provided, so it could not be stated precisely.
Source: https://sosovalue.com/assets/etf/us-eth-spot
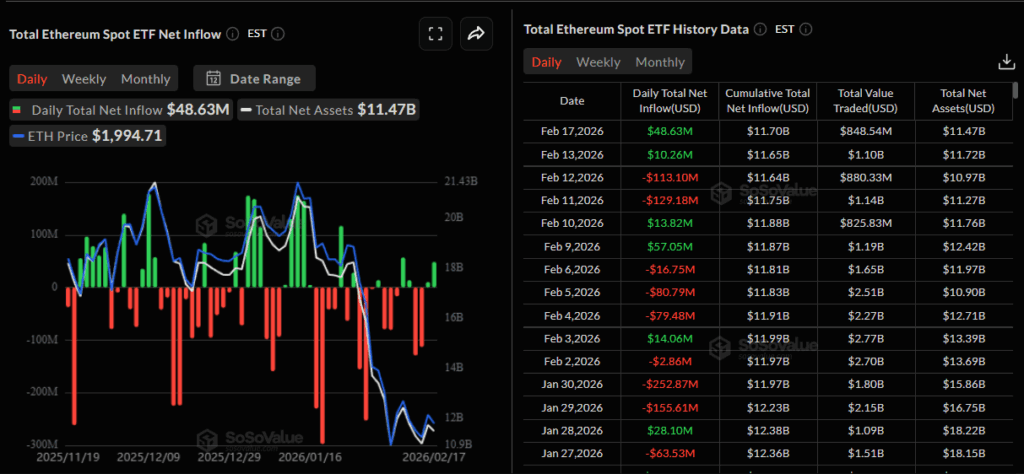
Spot Ethereum ETF activity showed a rough patch followed by improvement in the most recent reported session. Daily flows included inflows of $57.05 million on February 9, $13.82 million on February 10, $10.26 million on February 13, and $48.63 million on February 17, alongside outflows of $129.18 million on February 11 and $113.10 million on February 12. Across those listed days, the net result was about $112.52 million of outflows, with the single largest move being the February 11 outflow of $129.18 million. A market closure occurred on February 16 due to the US holiday schedule, which reduced the number of datapoints and made a strict short run trend call less certain, although the latest two reported sessions were inflow days.
This week, attention was pulled toward the growing corporate ETH treasury and staking theme after BitMine outlined holdings and a $252,000,000 annualised staking target at scale. A separate staking channel was put on the map as BlackRock seeded ETHB, with the proposed structure also indicating an 18% take on staking rewards by BlackRock and Coinbase, which would reduce the net yield passed through. Positioning looked less one way after entities linked to Founders Fund were shown to hold zero shares of an ETH treasury vehicle, while protocol risk was reinforced by Moonwell confirming about $1,800,000 in bad debt after a cbETH oracle misconfiguration. Fee leadership also shifted briefly as Polygon was reported to out-earn Ethereum on daily fees during a Polymarket burst, but it read as an app-driven spike rather than a broad reset in Ethereum demand.
Sovereign Dip Accumulation
Abu Dhabi linked capital appears to have treated the Q4 2025 Bitcoin drawdown as an accumulation window, but expressed that view through the most institution compatible rail, US spot Bitcoin ETFs. The story here is not just “they bought,” it is “how they bought,” via a regulated wrapper that fits custody, reporting, and mandate constraints, while still letting size show up when spot liquidity feels thin and risk budgets get tested. In the Q4 2025 13F disclosures (positions as of December 31, 2025), Reuters reported Mubadala’s IBIT stake was about 46 percent higher quarter over quarter, valued around $631 million at period end, and coverage in the same filing cycle pointed to Al Warda Investments also holding a large IBIT position, with combined Abu Dhabi linked IBIT exposure described at roughly $1.386 billion on reported values.
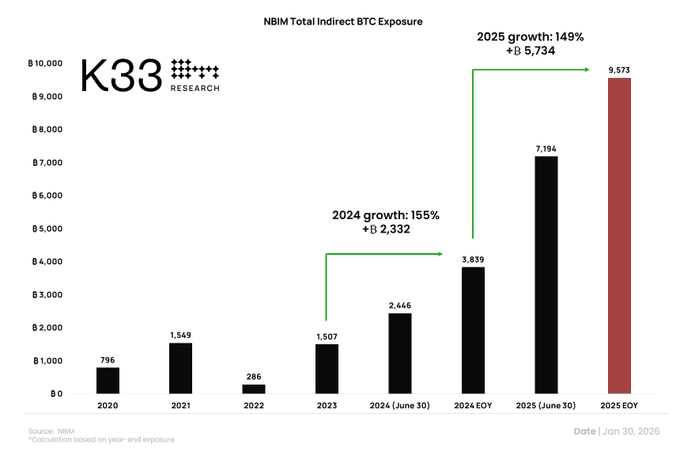
Source: https://k33.com/research/articles/nbims-indirect-btc-exposure-jumped-by-150-in-2025
Zooming out, sovereign Bitcoin exposure is better read as a two lane implementation spectrum than a single “buy spot BTC” decision. Lane one is direct beta through an ETF wrapper, which looks designed to slot into existing institutional plumbing without forcing a new custody posture. Lane two is indirect beta through listed equities where Bitcoin sensitivity comes bundled with business and equity risk, which is why Norway’s sovereign wealth fund is often discussed in the “indirect” lane. Vetle Lunde (K33) framed that Norway exposure as rising to 9,573 BTC equivalent by end 2025, reinforcing the point that sovereign participation can grow through portfolio construction choices even when the portfolio does not hold Bitcoin directly.
Mark Your Calendars
Economic Data Releases:
- February 27, 2026 (Friday): PPI index and Core PPI index
Token Unlock
- February 20, 2026 (Friday): ZRO (ZRO) unlocks US$38.56 M
- February 25, 2026 (Wednesday): H (H) unlocks US$17.00 M