Bitcoin Reclaims $70K as ETF Demand Fuels Recovery
5th March 2026 • 8mins read
This Week’s Recap
- U.S. spot bitcoin ETFs set for biggest week in 6 after adding $1.1 billion in three days: About $1.1 billion in net inflows was recorded across three consecutive sessions, and the week was positioned as the strongest in six weeks. Roughly half of those flows were attributed to BlackRock’s IBIT,
- Bitcoin Spot ETFs record $787 million inflows to break 5-week negative streak: A weekly net inflow of about $787 million was reported, and a five-week run of negative weekly flows was described as having ended. The shift was framed as a reversal in ETF flow momentum after consecutive weeks of outflows.
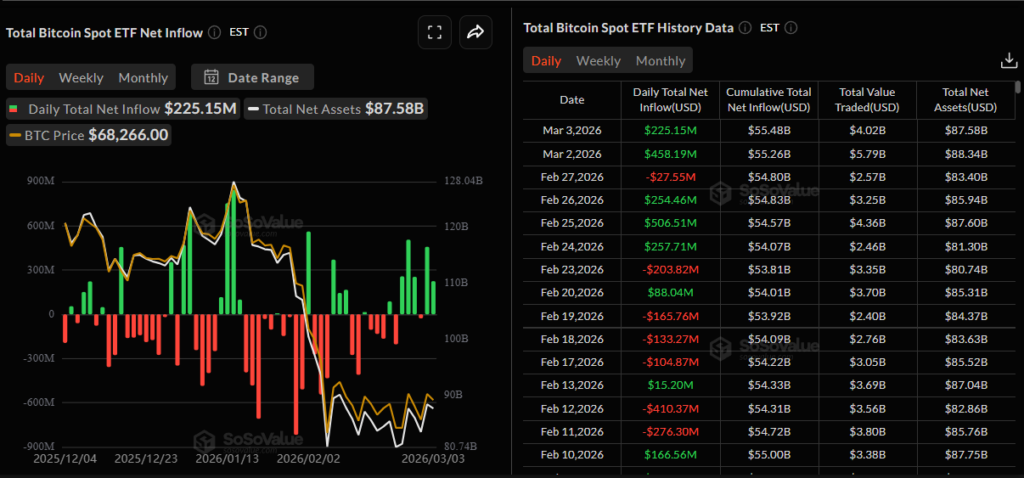
- US spot Bitcoin ETFs add $225 million as BlackRock IBIT offsets redemptions: A combined net inflow of $225.2 million on Tuesday was reported for spot bitcoin ETFs. The move was presented alongside a larger five-session inflow figure of about $1.4 billion.
- Ethereum Foundation targets transaction finality in seconds by 2029 with a seven-fork “strawmap”: A long-term roadmap described as a “strawmap” was released, outlining seven hard forks through 2029. The plan was reported as targeting finality in seconds, described as a roughly 480x reduction in finality time.
- Morgan Stanley applies for a trust bank charter to custody crypto assets: A de novo national trust bank charter application was reported as having been filed to enable digital-asset custody. The move was positioned as part of an expansion of crypto-related offerings at the firm.
- U.S. Strategic Bitcoin Reserve faces 30% reduction risk: A roughly 30% reduction was described as possible if a court-ordered restitution process shifts tens of thousands of BTC out of federal custody. The risk was framed as legal in nature, meaning the reserve balance could shrink without any discretionary selling.
- Stablecoin yield rewards likely will not be banned under OCC proposal: The OCC proposal was described as ambiguous on stablecoin yield procedures, with the current rulemaking plan not clearly spelling out specific restrictions. Regulatory interpretation was presented as leaning toward continued allowance of some yield-style incentives, depending on structure.
- Suspected insider trading detected in ZachXBT probe: At least 12 wallets were reported to have made more than $1 million by positioning on a prediction market outcome tied to ZachXBT’s investigation before the findings became public. The activity was presented as a case study in how advance knowledge can be monetized through onchain betting markets.
- Top Bitcoin miner MARA open to selling entire $3.8b BTC stash: A policy update was reported as expanding permitted sales beyond newly mined BTC to include existing reserves, with holdings cited at 53,822 BTC as of December 31, 2025. The shift was linked to funding priorities as the company broadened beyond mining into AI and high-performance computing infrastructure.
- Bitcoin rally leveraged by $1.279 trillion in margin debt: U.S. customer securities margin debt was cited at $1.279 trillion for January 2026, with a month over month increase of about $53.445 billion. The leverage build was presented as a cross-asset risk factor that could accelerate a broader unwind during correlated market stress.
- Barclays explores blockchain settlement engine: Discussions were reported as ongoing with technology providers about building a blockchain-based platform for processes like payments and deposits. The effort was framed as part of a broader push to strengthen payments infrastructure and compete with peers exploring tokenized deposits and related rails.
- South Korea tax office leaks recovery phrase; $4.8 million drained: A photo in an official release was reported as having exposed a wallet seed phrase tied to seized assets, after which tokens worth about $4.8 million were drained. The incident was treated as an operational security failure, prompting a review of how seized digital assets are handled.
- SBI Holdings unveils yen-backed stablecoin JPYSC, targeting Q2 launch: A trust-backed yen stablecoin branded JPYSC was announced, with a second-quarter 2026 launch target described as pending regulatory approval. Issuance was reported as being managed through SBI Shinsei Trust Bank, with development and distribution roles outlined among partners.
- U.S. Senate Democrats asked Treasury, DOJ to probe Binance’s illicit finance controls: A request for federal agencies to investigate Binance’s illicit finance controls was reported as having been sent by nine Democratic senators. The letter was framed around sanctions compliance and anti money laundering expectations following the firm’s 2023 settlements.
- Vitalik Buterin reveals his bold new plan to fix Ethereum’s scaling problem: A renewed emphasis on scaling Ethereum’s base layer was described, after years in which scaling effort was commonly associated with rollups. The plan was presented as combining near-term capacity gains with longer-term changes to how the execution layer and related components evolve.
- AI tool catches critical XRP Ledger bug that could have drained wallets: A critical logic flaw tied to the proposed Batch amendment was reported as having been found before any mainnet activation. The bug was described as potentially enabling unauthorized transactions on behalf of victim accounts without private keys, but the amendment had not been activated and no funds were reported as at risk.
- Tether says it has frozen $4.2 billion of its stablecoin over crime links: About $4.2 billion in USDT was reported as having been frozen over links to illicit activity, with most of the freezes occurring in the past three years. The action was described as being carried out in coordination with law enforcement requests, including a recent case tied to pig butchering scams.
- Bitcoin’s 15% difficulty spike resets network difficulty to about 144.40T: A roughly 15% upward difficulty adjustment to about 144.40T was reported as the largest since around 2021. The adjustment was described as compressing miner economics, with hashprice cited as having fallen to about $29.7 per PH/s/day in the referenced market wrap coverage.
- Vitalik Buterin unveils plan to curb Ethereum block builder centralization: A proposal was outlined to reduce block builder centralization risks, with attention directed at “toxic MEV” behaviors such as sandwiching and front running. Mitigations were framed around improving fairness and limiting concentrated influence over transaction ordering.
- Strategy purchased more than $200 million in Bitcoin last week: An additional 3,015 BTC purchase was disclosed at an average of about $67,700, and total holdings were reported at 720,737 BTC. The accumulation approach was presented as continuing to rely on capital markets activity to fund buys.
- Bitcoin $85b derivatives engine may move onshore as CFTC eyes April approval: A commentary segment described the possibility of regulated US crypto perpetual futures being approved by April and framed it as a potential “onshore” shift of activity. The discussion was presented as analysis and not as a confirmed CFTC decision in the video’s description.
- Scam token case against Uniswap dismissed with prejudice by U.S. district judge in NYC: Claims alleging the protocol assisted rug pulls were dismissed, and decentralized design was cited as central to the court’s reasoning. The dismissal with prejudice was described as closing the door on refiling the same claims.
- Visa and Bridge expand collaboration, with plans to bring stablecoin-linked cards to over 100 countries: An expansion plan was announced for stablecoin-backed Visa card issuance from 18 countries to over 100 countries by end of year, according to the release. Onchain settlement was described as enabled through Bridge’s partnership with Lead Bank in connection with Visa’s stablecoin settlement work.
- International finance watchdog warns stablecoins are increasingly used in sanctions evasion and money laundering: A FATF report was cited as describing stablecoins as a dominant vehicle in illicit crypto activity, with attention directed to sanctions evasion and money laundering risks. The warning was positioned as pressure for tighter oversight of stablecoin issuers and higher-risk transaction channels.
- Senate housing bill includes CBDC ban: A bipartisan housing package was reported as carrying language that would bar the Federal Reserve from issuing a CBDC before 2031. The clause was framed as a policy constraint embedded in a broader bill rather than a standalone digital asset measure.
- Bitcoin breaks $73,000 but traders warn of another bull trap: The move above $73,000 was described as a reclaim of a psychological level after weeks of consolidation, while skepticism was emphasized across positioning and sentiment. The rally was treated as vulnerable to reversal risk, given overhead supply and the market’s recent drawdown context referenced in the report.
- Kraken wins access to the Fed’s core payments system: Kraken Financial was reported as receiving a limited-purpose master account, enabling direct access to Fedwire for certain payment flows. The approval was presented as a step toward deeper integration of a crypto-linked bank into US payment infrastructure, while remaining narrower than a full master account.
- Brian Armstrong met with Trump before the president slammed banks over the crypto bill: A meeting between the Coinbase CEO and President Trump was confirmed by CoinDesk as having occurred ahead of public criticism aimed at banks in the context of crypto legislation. The sequence was framed as linking private engagement with subsequent public pressure on banking groups over digital asset policy outcomes.
Bitcoin Market Analysis
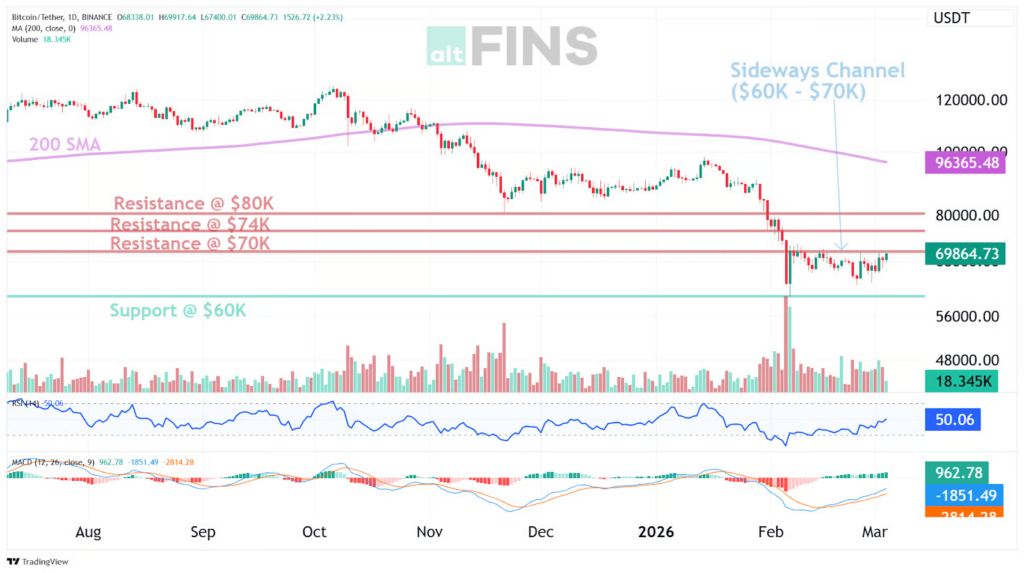
Bitcoin was marked by a sharp risk driven drop and a faster than expected recovery, with the week’s range being defined by a low at $63,068.7 and a high at $74,031.0. A late week surge was recorded, and the close was set above $70,000 after that level had acted as a ceiling during the prior consolidation, with the week’s tone being shifted by the strength registered into the final sessions.
Source: https://altfins.com/technical-analysis
A downtrend framework was maintained on the medium and long term horizon, while a neutral short term posture was reflected. RSI 14 was placed near the midpoint at 50.06, and neither overbought nor oversold conditions were indicated on that measure. MACD was presented in a configuration consistent with bearish higher time frame momentum still being present, even as a rebound impulse was suggested in the faster component, and a 200 day moving average was shown far above spot at $96,365.48, which kept the longer regime anchored as bearish until materially reclaimed.
A sideways channel was treated as the primary pattern, and the $60,000 to $70,000 band was used as the operative range that had contained price. A break above $70,000 was described as having been registered, but confirmation was not established by the breakout print alone, and it was explicitly left as uncertain pending a retest and hold. The nearest resistance zone was placed at $74,000, with $80,000 identified above it as the next major supply area, and the nearest support zone was placed at $60,000.
Risk boundaries were best defined by the same range rails that had governed the prior consolidation. A constructive short term read would be weakened if acceptance were to be reestablished back below $70,000 on closing terms, and the broader structure would be materially impaired if $60,000 were to be lost. Upside follow through would be strengthened if $70,000 were to be defended on pullbacks, with $74,000 then treated as the first overhead test where supply would be expected to be met, and $80,000 treated as the next level where positioning would likely be challenged.
Source: https://sosovalue.com/assets/etf/us-btc-spot
ETF demand was treated as supportive, with inflows having accelerated over three sessions, and the prior outflow sequence having been broken after a multi week drawdown. Daily leadership was also been led by IBIT on a day when redemptions were seen elsewhere. No causal linkage from flows to price was asserted, but the improved flow tone was treated as consistent with a market that was able to reclaim 70,000 and keep the focus on follow through rather than immediate failure.
Volatility was amplified as geopolitics and balance sheet headlines were rotated through, with risk appetite having been shocked during the initial strike cycle and a rebound having been extended as the news flow evolved. Network conditions were also tightened by a difficulty reset, corporate demand was reinforced by disclosed buying, and potential miner supply flexibility was been raised as an overhang. Policy uncertainty was also been flagged, while upside durability was been questioned, and the requirement for a confirmed hold above 70,000 was therefore kept as the central validation condition.
Ethereum Market Analysis
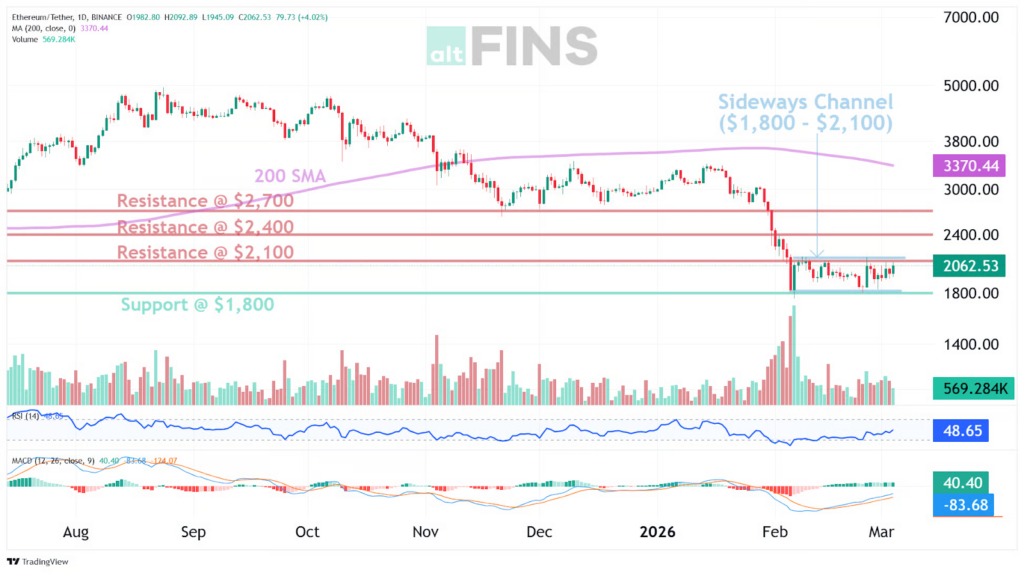
ETH has been kept in a sideways range between $1,800 and $2,100, with price recently closing at $2,062.53, leaving the market positioned in the upper half of the band without a confirmed breakout. A decisive move has continued to be awaited, because direction has been expected to be determined by acceptance beyond the range edges rather than by small moves within the middle.
Source: https://altfins.com/technical-analysis
The broader backdrop has remained heavy, because the short term trend has been treated as neutral while the medium term trend has been treated as down and the long term trend has been treated as strong down. A long horizon reference has stayed far above spot, with the 200 day simple moving average at $3,370.44, so sustained recovery has still been viewed as work that must be proven rather than assumed.Momentum has been kept balanced, with RSI 14 at 48.65, so neither overbought nor oversold conditions have been signaled. MACD has not been used as a primary driver for this read, because the values alone have not been sufficient to anchor a clean directional interpretation without full context, and the range structure has remained the clearer guide.
The level map has been kept simple. Support has been centered on 2,000 first and 1,800 next, while resistance has been centered on 2,400 first and 2,700 next. A clean upside trigger has been defined at 2,100, because continuation toward 2,400 has been linked to acceptance above that line, while a clean downside trigger has been defined at 1,800, because downside continuation has been expected if that base fails. The range thesis has been treated as invalidated on a sustained break below 1,800.
Source: https://sosovalue.com/assets/etf/us-eth-spot
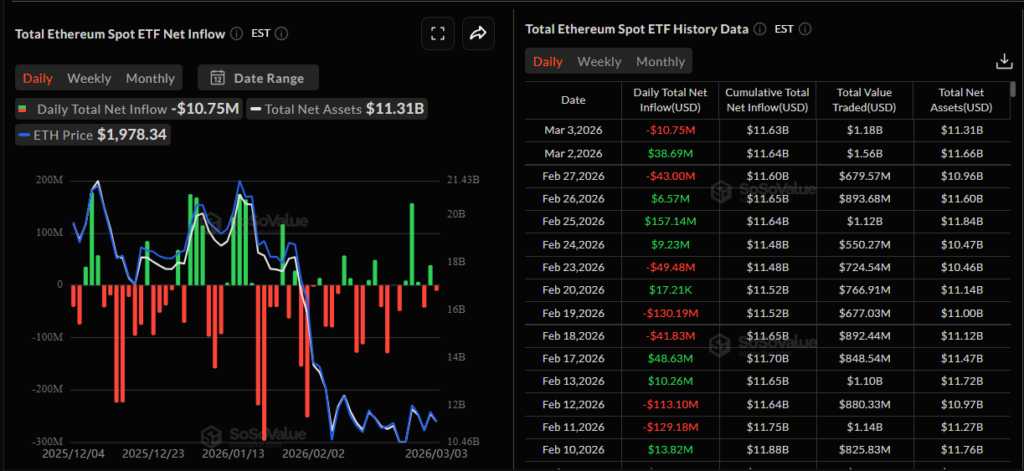
Flow has been mildly supportive in aggregate but mixed day to day. Over the seven day ETF flow window, net flows have summed to +108.40M, with the largest inflow at +157.14M, while the latest daily reading has been -10.75M, so demand has been present but not persistent in one direction. That mix has been treated as consistent with a market stuck in balance, where confirmation has been expected to come from price clearing the range rather than from flow alone.
Narrative support has been carried by longer dated protocol themes that have been treated as background context until the range is resolved. A push to reach finality in seconds by 2029 has been discussed, scaling work has been framed through fix scaling, and block production concentration risk has been addressed through curb centralization. For the near term, the playbook has remained level driven, with 2,100 treated as the upside gate toward 2,400, and 1,800 treated as the downside gate for continuation with the prevailing downtrend.
Crypto Rally After Escalation In the Middle East
Bitcoin’s pump after the escalation has been described as a rebound that followed a first wave of shock selling. In the broader market backdrop, a dash for cash move was described, where many assets were sold at the same time. When that kind of forced selling slows down, a relief bounce is often seen, and crypto is positioned to react quickly because it trades 24/7 and reprices faster than markets that pause overnight.
The second driver has been the oil and shipping channel, which has been treated as the practical “engine” behind the volatility. Stress around Gulf transit has been highlighted through reporting on tanker disruption, which has fed into higher oil and wider risk swings. When mitigation ideas entered the story flow, including an insurance backstop discussion, some worst-case fear was cooled at the margin, and a risk-on rebound was able to build, with crypto often leading that bounce because it is high beta.
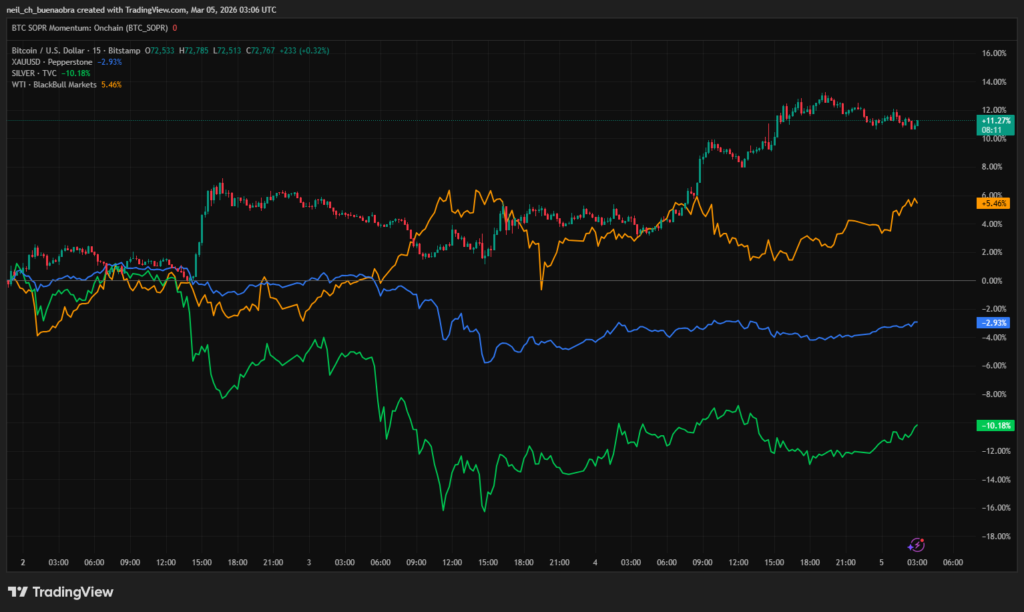
Bitcoin Performance vs Gold, Silver, and Oil
Source: https://www.tradingview.com/chart/2siDZm6r/?symbol=BITSTAMP%3ABTCUSD
The “safe haven” explanation has not been strongly supported by how Bitcoin moved on the peak stress day in this window. It is described as BTC having tracked equities while oil pressures stayed high, which is closer to risk-asset behavior than to an inverse hedge. Under that framing, the pump has been treated as a reversal out of hedging, liquidations, and defensive positioning, rather than as steady conflict-driven buying.
A similar two-step sequence was reported around the start of the Russia–Ukraine war in 2022. After the invasion began, Bitcoin was reported to have sold off in the initial shock window, then it was reported to have snapped back within days as the market adjusted. In the same period, crisis-linked cross-border demand signals were reported, with regional trading activity rising and volume spiking as sanctions tightened and payment routes were pressured. For continuation, the same conditions have been treated as the main checks: whether shipping disruption is stabilizing versus worsening, whether oil stops stepping higher day after day, and whether the rebound is being supported by sustained demand rather than only a short-covering and relief bid.
Mark Your Calendars
Economic Data Releases:
- March 11, 2026 (Wednesday): CPI and Core CPI
- March 13, 2026 (Friday): PCE and Core PCE
Token Unlock
- March 5, 2026 (Thursday): ENA (ENA) unlocks $20.17 M (2.24 % of market cap)
- March 6, 2026 (Friday): HYPE (HYPE) unlocks $319.02 M (2.73 % of market cap)
- March 12, 2026 (Thursday): APT (APT) unlocks $11.39 M (0.69 % of market cap)
- March 13, 2026 (Friday): WBT (WBT) unlocks $4.26 B (27.77 % of market cap)