War-Driven Macro, Regulatory Clarity, Mixed Cross-Asset Performance
Key Numbers:
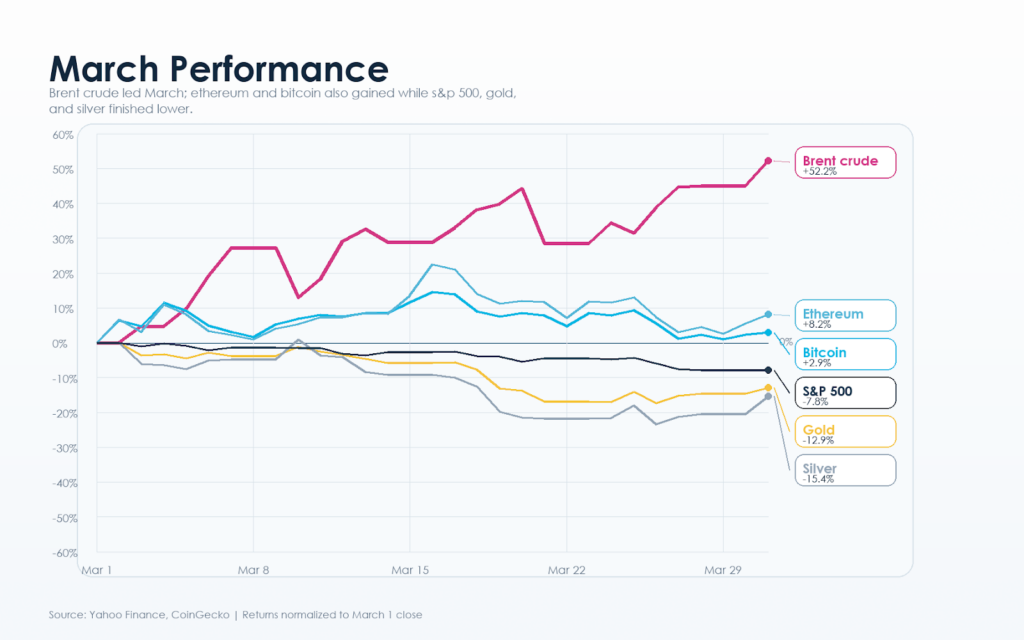
Bitcoin $66,698 (2.89%) Ethereum $2,053 (8.20%)
1-month return
Total Crypto Market Cap $2.40T (0.84%)
2026 returns
Bitcoin –24.14% Ethereum –31.17% Gold 5.36%
NASDAQ -10.53% S&P500 -7.33%
Key Takeaways
- March 2026 was described as a war-driven macro month, with the conflict involving Iran shaping crypto, commodities, equities, and rate expectations more than any crypto-specific factor.
- The report says the war mattered because it threatened oil transport and pricing through the Strait of Hormuz, turning geopolitical tension into a broader inflation, growth, and liquidity shock.
- Ethereum had the stronger month in price performance, rising 8.20% versus Bitcoin’s 2.89%, even though Bitcoin was still portrayed as the more resilient asset in broader market positioning and year-to-date performance.
- Bitcoin was presented as relatively resilient, but not a true safe haven. It recovered above $70,000 at points, briefly reached around $76,000, then fell back toward the upper-$60,000s by month end, showing support underneath but no confirmed breakout.
- Ethereum had a better monthly return than Bitcoin, but the report says its price still lagged its own network strength, with active addresses, transfers, and smart contract activity remaining healthier than ETH valuation suggested.
- Stablecoins were described as one of the clearest market structure signals, with capital rotating defensively into dollar-linked assets instead of leaving crypto entirely, suggesting investors stayed cautious but remained close to the market.
- Macro conditions stayed restrictive throughout the month. The report cites February CPI at 2.4% year over year, core CPI at 2.5%, and says the Federal Reserve kept rates at 3.5% to 3.75%, while war-related energy pressure reduced confidence in near-term easing.
- A large late-March Bitcoin options expiry, estimated in the report at roughly $14 billion to $18.6 billion in notional size, was described as adding to volatility in a market that was already thin and highly headline-sensitive.
- The report’s main positive crypto-specific development was U.S. regulatory guidance issued on March 17, which it says improved clarity around how federal securities laws apply to several crypto asset categories, reducing part of the sector’s regulatory overhang even as broader legislative progress remained uneven.
- Cross-asset performance suggests there was no clean defensive trade in March. Crypto, equities, gold, and silver all struggled under the combined pressure of war risk, oil shock, sticky inflation, and uncertainty around rates.
- The report’s closing view is that March was a transition month, not a simple bullish or bearish one, with crypto’s internal structure improving in some areas, especially regulation, accumulation, network activity, and stablecoin positioning, while the external macro backdrop became significantly more hostile.
The Iran Conflict as the Main Driver of March
The defining feature of March was that the conflict involving Iran turned a crypto story into a macro story. Before the conflict intensified, crypto had already been dealing with a difficult setup: inflation was not fully back under control, rate-cut hopes had weakened, and liquidity conditions were not especially supportive for risk assets. The war changed the scale of the problem. It hit energy flows, pushed oil much higher, raised concern about shipping through the Strait of Hormuz, and quickly spread into inflation expectations, bond yields, equities, currencies, and then digital assets. Crypto did not trade in isolation during the month. It traded inside a global market that was being repriced around energy shock, inflation risk, and uncertainty about growth.
What made March different was not only that geopolitical tension rose, but that it affected a part of the world with immediate importance to oil transport and pricing. That changed the reaction function across markets. A normal war headline can produce a temporary fear trade. This conflict created a direct economic transmission channel. The Strait of Hormuz handles around one-fifth of global oil and LNG transport. Once that channel came under threat, markets had to think less about isolated military headlines and more about the possibility of prolonged supply disruption. That pushed oil from being a commodity story into being a whole-market story.

Source: https://www.reuters.com/
The market also spent the month swinging between escalation and hopes of de-escalation. That produced repeated reversals across asset classes. There were sessions when crypto, stocks, and precious metals all bounced because traders thought the conflict might cool. Then those moves faded when the war narrative worsened again or when inflation and rate concerns came back into focus. This is important because it explains why the month felt unstable even when some individual data points improved. The market was not searching for one clean answer. It was moving between two competing views: one, that the war would keep energy high and make policy tighter for longer, and two, that de-escalation could bring a fast relief rally. Crypto moved inside that same tension throughout March.
Crypto fundamentals improved in some areas, but the macro environment became too hostile for a clean trend higher. The conflict around Iran created a new layer of uncertainty that overrode many asset-specific positives. Bitcoin and ether did not collapse in a disorderly way, but they also could not turn improving internal conditions into a sustained breakout. That is why March should be understood first as a war-driven macro month, and only second as a crypto-specific month. The one clear exception was regulation, which developed on its own track and added a separate positive force that was not directly tied to the conflict.
Macro Transmission: Oil, Inflation, Rates, and Risk Appetite
The war raised energy prices fast enough to change the inflation discussion. Oil forecasts were revised sharply higher by the end of the month, and Reuters described the jump as the steepest increase in its poll history. Brent rose so much in March that the move was compared with major historical oil shocks. The disruption was tied to the Strait of Hormuz, which handles around one-fifth of global oil and LNG transport. Once that channel came under threat, markets had to think less about isolated military headlines and more about the possibility of prolonged supply disruption. That pushed oil from being a commodity story into being a whole-market story.
That energy move fed directly into inflation concern. U.S. consumer inflation data in March already showed that price pressures had not disappeared. February CPI came in at 2.4% year over year, with core CPI at 2.5%, and monthly inflation was still firm. Personal consumption expenditure data also showed headline inflation above target and core inflation running hotter than would be comfortable for an easy policy pivot. When the war then pushed oil and gasoline higher, it reinforced the fear that inflation could reaccelerate or at least remain sticky for longer than markets had hoped. That mattered because crypto had relied on the idea that easier policy later in the year would improve liquidity and support higher valuations. That idea became harder to defend as March went on.
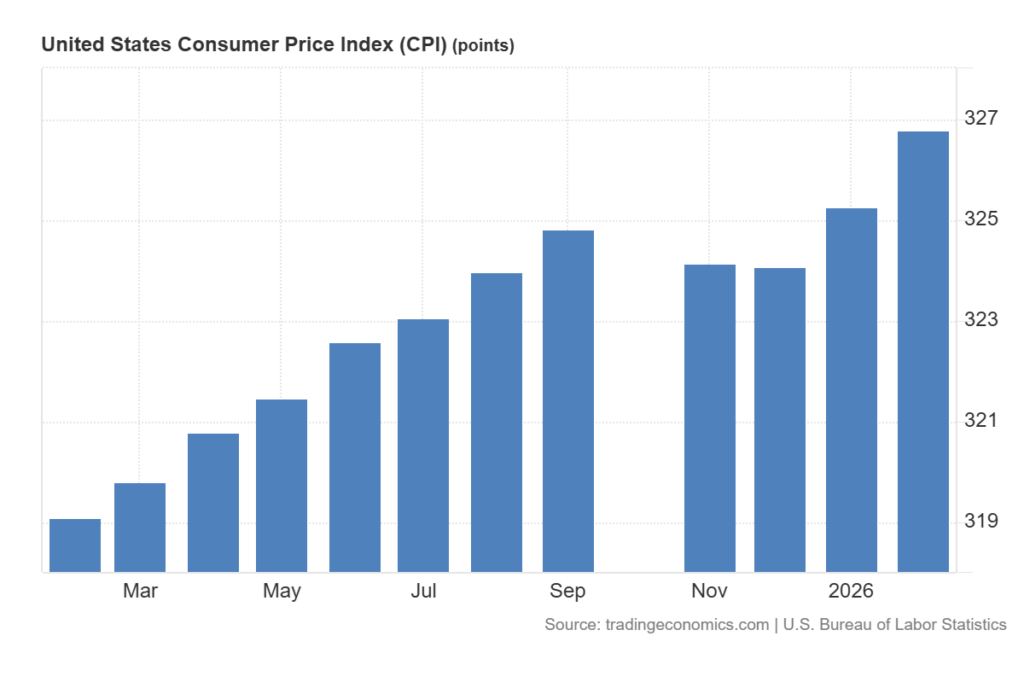
Source: https://tradingeconomics.com/united-states/consumer-price-index-cpi
The Federal Reserve’s March meeting fit this setup. The Fed held rates at 3.5% to 3.75% and kept its language careful. It did not deliver the kind of message that would let markets ignore inflation risk. Instead, it emphasized uncertainty and acknowledged the additional risk coming from developments in the Middle East. In a more stable month, holding rates steady might have been enough for a risk rally. In March, it was not. The market was looking past the rate hold and focusing on how war-driven energy inflation could limit future easing. That is why crypto’s reaction around the meeting was mixed. Price could bounce on relief, but it could not sustain follow-through because the larger policy picture still looked restrictive.
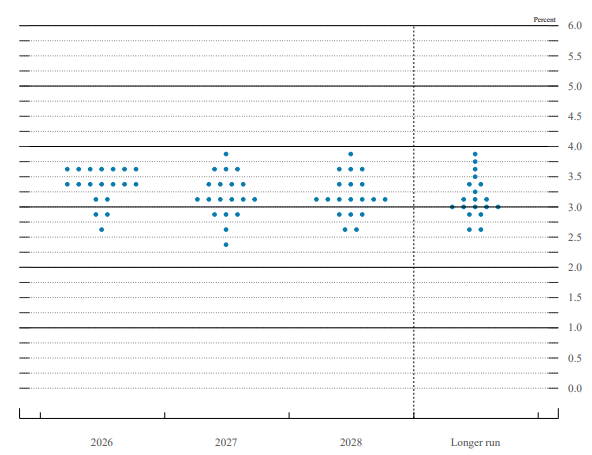
FOMC participants’ assessments of appropriate monetary policy: Midpoint of target range or target level for the federal funds rate
source: https://www.federalreserve.gov/monetarypolicy
This macro pressure helps explain why even positive crypto developments struggled to turn into lasting gains. The market was not only asking whether bitcoin and ether looked attractive on their own. It was asking whether any risk asset deserved a higher multiple in a world of war, elevated oil, sticky inflation, and uncertain central-bank response. March answered that question with caution. The result was a month where markets repriced growth risk, inflation risk, and geopolitical risk at the same time. Crypto was part of that repricing, not outside it.
Bitcoin Market Analysis
Bitcoin spent March caught between two identities. On one side, it showed resilience that many risk assets would have struggled to match. It was able to hold important ranges, recover from sharp selloffs, and briefly trade back into the mid-$70,000s during the month. On the other side, it did not behave like a clean safe haven. It rose at some points when fear intensified, but it also sold off when the broader macro implications of the war became clearer. That left bitcoin in an awkward middle position. It was stronger than a fragile speculative asset, but not strong enough to detach from the macro system and trade independently of inflation and liquidity concerns.
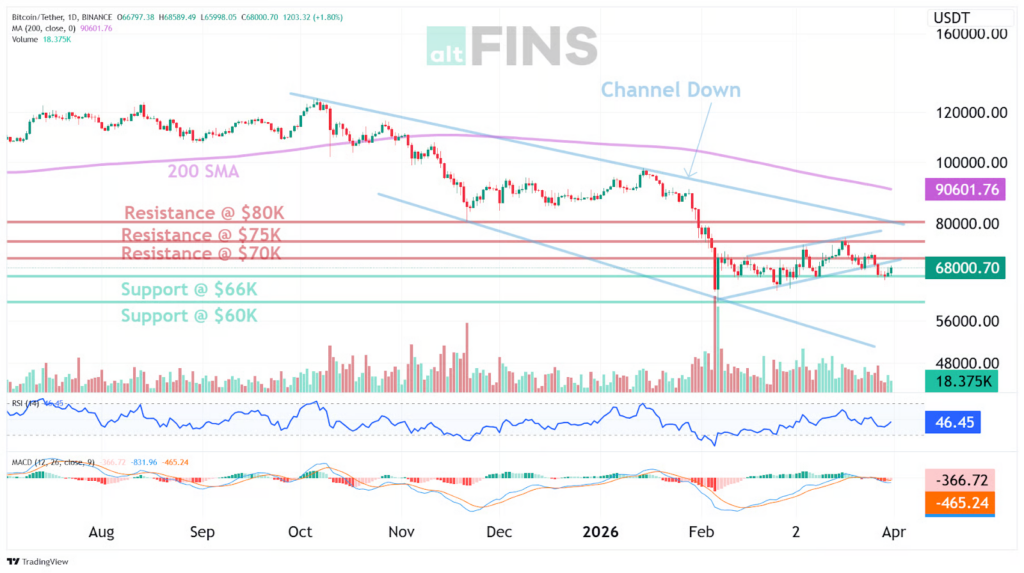
Source: https://altfins.com/technical-analysis
The best way to describe bitcoin’s chart in March is that it formed a fragile base rather than a confirmed uptrend. It started the month trying to recover from weak late-February conditions. Mid-month, it pushed above $70,000 and entered a thinner on-chain area where resistance looked lighter up to roughly the low-$80,000s. That made the rebound look promising. Later in the month, bitcoin rallied sharply to around $76,000, but the move did not hold. It then suffered a two-leg drop toward $67,000 before stabilizing again near $70,000. By the end of March and into April 1, prices were still sitting around the upper-$60,000s rather than reclaiming a strong trend. The chart therefore showed recovery attempts, but no decisive structural breakout.
What this price action says is that buyers were present, but conviction was limited. The market could respond to positive headlines, improving ETF demand, and temporary optimism around de-escalation. But each rally ran into overhead supply and macro hesitation. That is consistent with a market where many participants are still trapped at higher cost bases and are willing to sell into strength. It is also consistent with a market where new buyers are selective. They are willing to step in at lower levels or on extreme fear, but not yet willing to chase price much higher while macro conditions remain uncertain. In March, bitcoin’s moves reflected that balance almost perfectly.
A large late month options expiry added another source of instability. Around March 27 to 28, bitcoin faced a major options rollover, with reported notional size estimated at roughly $14 billion to $18.6 billion. BTC options open interest was still elevated by historical standards even as price had already started to soften, which suggests the market was carrying a heavy derivatives position into an already fragile backdrop. When open interest is this large, expiry can intensify short term price pressure, especially around heavily traded strike levels, and can produce abrupt moves as dealers and traders rebalance. This expiry did not drive the entire month on its own, but it likely amplified the volatility already created by the war, the oil shock, and broader uncertainty in risk positioning. In calmer tape, the market may have absorbed such an event more smoothly. In March, it hit a market that was already thin, reactive, and highly sensitive to headlines.
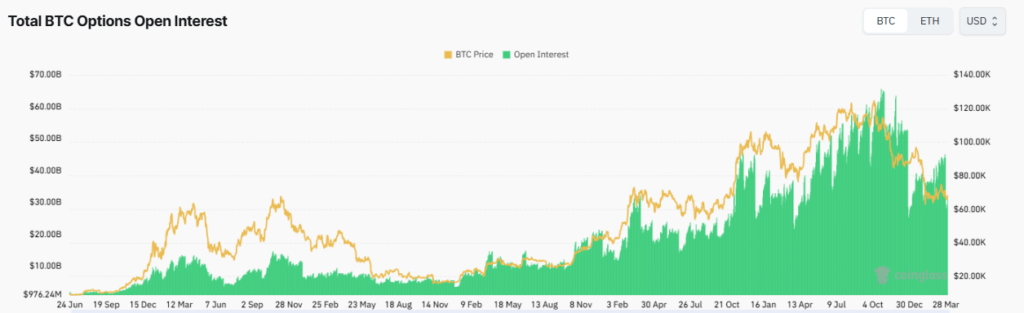
Source: https://www.coinglass.com/open-interest/BTC
The broader reading for bitcoin is that March was a stress test, and bitcoin passed it only partially. It avoided a disorderly breakdown even while global risk markets struggled, which says something positive about demand beneath the market. Yet it also failed to prove that it could become the primary destination for capital seeking protection from geopolitical chaos. Some days it looked like a hedge. Other days it traded like another high-volatility asset facing the same macro drag as equities. That mixed result is actually useful because it is descriptive rather than ideological. March showed bitcoin as a maturing asset with real holding power, but still deeply linked to global liquidity and policy expectations.
Bitcoin On-Chain and Positioning
The on-chain picture for bitcoin was better than the headline volatility suggested. Unrealized losses increased during the month, but remained within historical stress ranges rather than moving into panic territory. Realized losses were elevated, yet the selling pattern looked controlled rather than chaotic. A chaotic market tends to show forced exits, broad capitulation, and a collapse in positioning discipline. March did not look like that. It looked more like a tired market that had already endured significant weakness and was still trying to absorb supply. The result was a market under pressure, but not a market in full surrender.
Another important point was the location of supply overhead. March showed a large cluster of short-term holder supply sitting well above spot, with significant resistance zones forming first around the low-$80,000s and then more heavily between the low-$90,000s and high-$90,000s. This helps explain why rallies kept stalling. The market was not only fighting the news cycle. It was also fighting the memory of higher prices. Traders and holders who bought at elevated levels had incentive to reduce exposure on rebounds. That created a ceiling effect. The market could bounce, but every move higher approached areas where trapped supply was likely to come back to market.
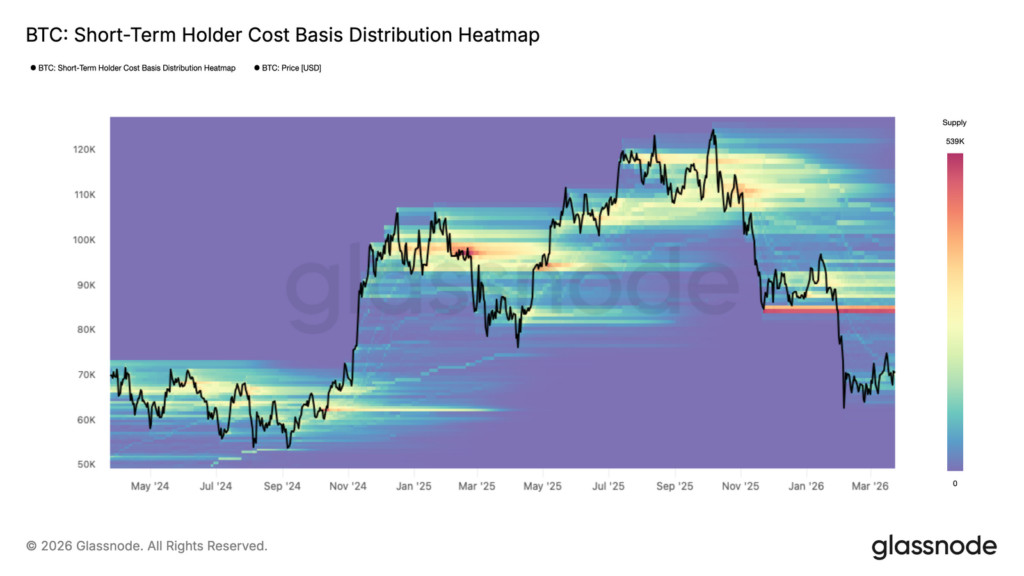
Source: https://insights.glassnode.com/the-week-onchain-week-12-2026/
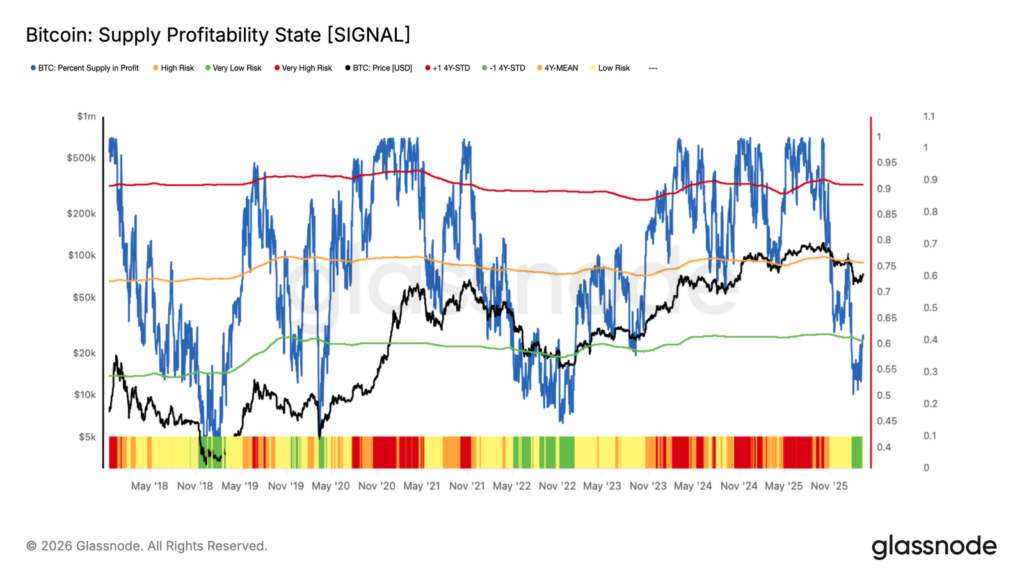
Profitability metrics also support the view that bitcoin was in a repair phase rather than a fresh expansion phase. The share of supply in profit recovered during parts of the month, but not to levels that would clearly confirm a robust bull transition. Realized profit was much lower than at strong prior peaks, showing that speculative heat had cooled substantially. That can be read in two ways. It is negative because it shows weak upside participation. It is also constructive because it means excess froth had been reduced. March was therefore a month where bitcoin looked cleaned up, but not yet re-energized. The market had shed some of the excess that made earlier highs unstable, yet it had not gained enough new demand to launch a new leg higher.
Source: https://insights.glassnode.com/the-week-onchain-week-11-2026/
Accumulation signals in late March added a more constructive layer. Research highlighted a divergence between surface-level price weakness and longer-term accumulation under the market. There were signs that stronger hands were adding while broader sentiment remained cautious. That fits what price was doing. Bitcoin was not attracting a fully risk-on crowd, but it was still finding buyers willing to step in on weakness. This kind of pattern often matters more for the medium-term setup than for the immediate headline move. It suggests that the market did not spend March simply breaking down. It spent March redistributing supply from weaker participants to more patient ones.
The most balanced conclusion is that bitcoin ended March in a better structural position than the raw monthly volatility might imply. It was not strong enough to break free from macro pressure, but it did show enough underlying support to avoid a full collapse. That matters because base-building months often look messy in real time. They feature failed rallies, repeated selloffs, negative headlines, and confused sentiment. March had all of those. But the underlying chain data suggests that beneath the noise, the market was slowly improving in quality even if it was not yet improving in trend.
Ethereum Market Analysis
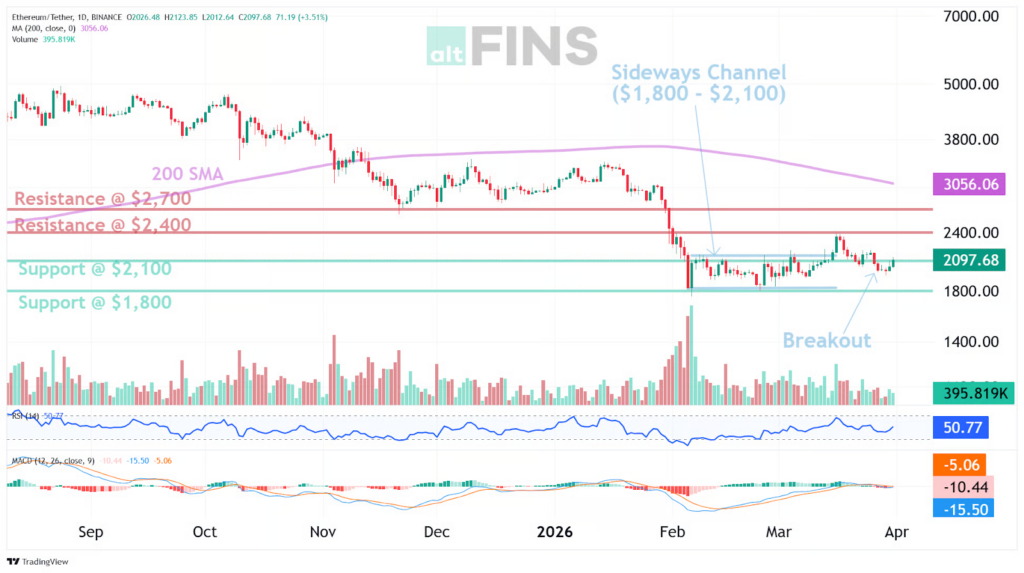
Ethereum had a harder month than bitcoin in price terms, even though its network activity remained healthier than price alone would suggest. That disconnect defined ETH in March. It traded as a weaker large-cap crypto asset in a hostile macro backdrop, but it did not show an equally weak underlying usage profile. Ether was near $2,345 in mid-March, fell below $2,000 during one of the early-month risk-off phases, and by the turn into April was trading around $2,100. That path shows a market that struggled to build directional strength even when it avoided a full breakdown.
Source: https://altfins.com/technical-analysis
Part of Ethereum’s problem was that it remained more exposed to questions about user activity, risk appetite, and the broader health of the crypto economy. Bitcoin can sometimes benefit from scarcity language, reserve-asset language, or store-of-value narratives during periods of stress. Ethereum has a more economically sensitive profile. It is tied more directly to network usage, smart contract activity, stablecoins, tokenization, and application demand. In a month dominated by war, oil shock, and inflation concern, those are not the easiest themes to re-rate higher. As a result, ETH had less narrative protection than BTC, even though it still held key areas and showed resilience compared with what a true risk collapse would have looked like.
Ethereum also faced the same broad market pattern as bitcoin: relief rallies existed, but they struggled to extend. When de-escalation hopes improved or when crypto-specific headlines turned more constructive, ETH could bounce. Yet those gains repeatedly ran into a market that was not comfortable taking strong directional risk. This matters because ETH often needs both internal network strength and broader market willingness to price future growth. In March, the first part was present more than many expected, but the second part was limited. That helps explain why ETH looked more subdued than its activity metrics would suggest.
The larger point is that ETH spent March trying to prove that the underlying network story still mattered, while the market kept forcing attention back to macro risk. That is not a failure of the asset itself. It is a reflection of what kind of month March was. In a calmer month, rising network usage might have produced a stronger response in price. In March, the war made macro conditions the main filter through which every asset was judged. ETH therefore ended the month not with a dramatic breakdown, but with a muted, hesitant, and incomplete recovery.
Ethereum On-Chain and Network Activity
Ethereum’s most important internal story in March was the disconnect between network activity and token performance. Research published during the month pointed to an adoption paradox in which active addresses, token transfers, and smart contract calls remained exceptionally strong even as ETH itself stayed soft. That matters because it suggests March was not primarily a story of collapsing utility or fading relevance. The network still looked busy, even as the token failed to command a stronger valuation.
That stronger activity profile gave Ethereum a firmer internal footing than the price chart alone implied. A follow-up read on rising network usage tied the increase in participation to DeFi, stablecoins, and automated smart contract activity, which supports a broader reading of Ethereum’s role during the month. Weak price alongside strong activity points less to internal deterioration and more to pressure coming from outside the network itself. March therefore looked less like a breakdown in Ethereum’s utility and more like a month in which the market simply did not reward that utility.
Source: https://insights.glassnode.com/
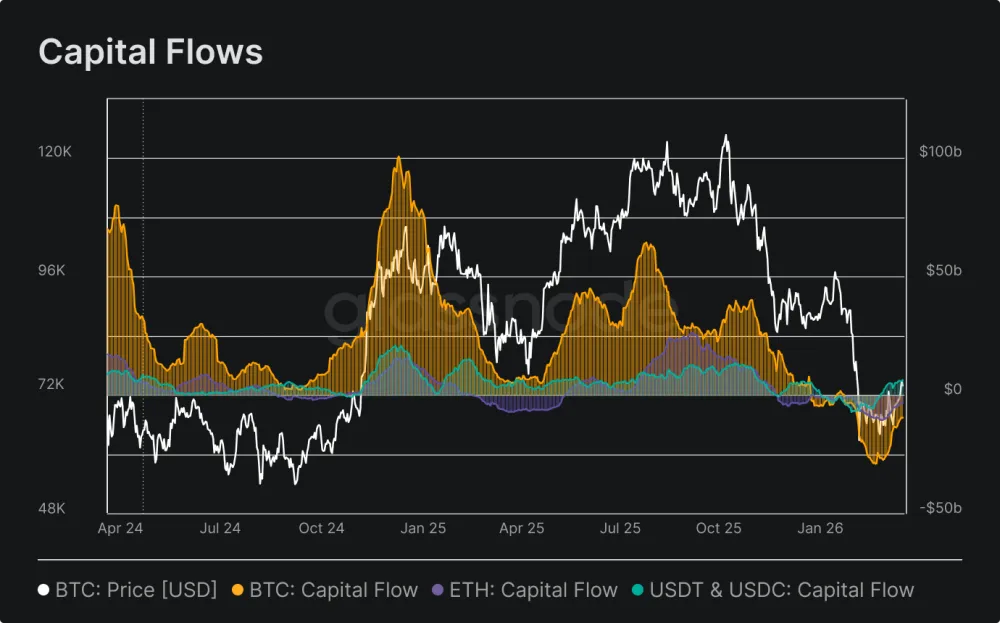
The problem was that usage growth alone could not overpower the broader macro and flow backdrop. By late March, capital flows into ETH remained deeply negative, while stablecoins saw large positive inflows, a sign that capital was rotating defensively into lower-risk, dollar-linked assets rather than back into higher-beta crypto exposure. The same data showed Ethereum ETF flows hovering near neutral and treasury flows stabilizing, which helped argue against collapse, but still fell short of signaling a decisive return of conviction.
Source: https://insights.glassnode.com/
Still, March left Ethereum on a more constructive foundation than the price chart alone would imply. Strong participation suggested the asset did not spend the month losing relevance. Instead, it spent the month being discounted by a market that remained more concerned with macro risk than with future growth stories inside crypto. That difference matters for how the next month is framed. If macro conditions ease, Ethereum has a stronger internal base to work from than its March price performance suggests. If macro conditions stay hostile, network usage can still act as a stabilizing force, even if it is not enough on its own to drive clear outperformance.
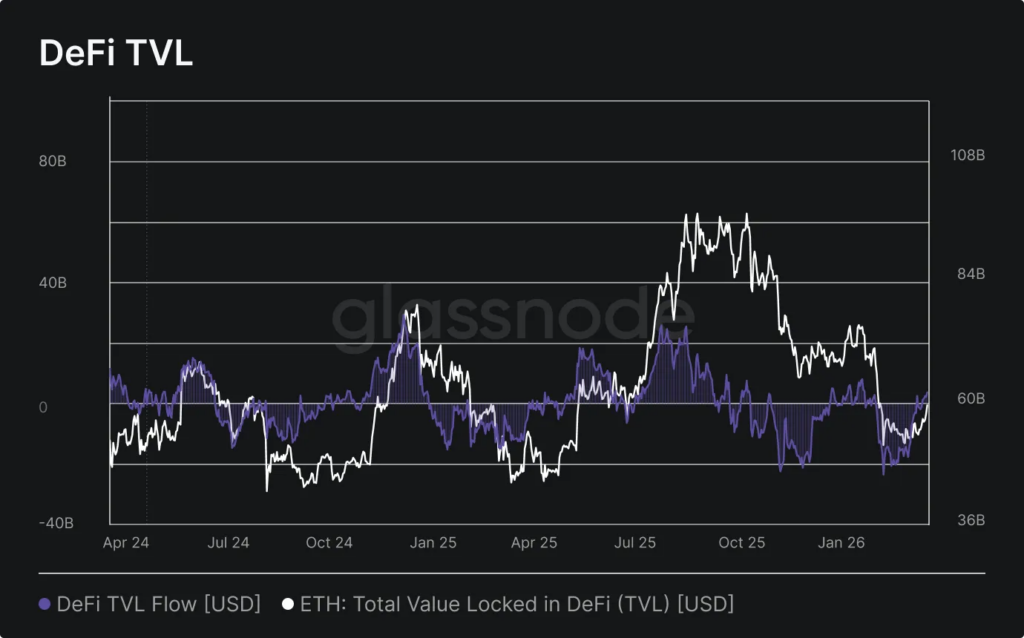
Stablecoins and Market Structure
One of the clearest market-structure stories of March was the role of stablecoins. Capital flows into bitcoin and ether remained negative through late February and into March, while flows into stablecoins turned positive. That tells a simple story. Investors did not leave the digital-asset ecosystem completely, but they moved down the risk curve inside it. Instead of deploying heavily into directional exposure, they preferred cash-like positioning on-chain. This is one of the most important clues for understanding the month because it shows that March was not only about fear. It was also about waiting. Capital stayed close enough to move later, but chose not to chase immediate upside.
That defensive rotation fits perfectly with the war-driven macro backdrop. Investors dealing with oil shock, inflation risk, and uncertain policy did not need to abandon crypto entirely to express caution. They could simply hold more stablecoins and less BTC or ETH. The result was a market that had dry powder, but was slow to deploy it. This helps explain why rebounds felt shallow. Buyers existed, but many of them were not yet fully committed. They were keeping optionality rather than taking strong directional views. In that sense, stablecoins became a kind of sentiment gauge for March. Their relative strength showed caution without full disengagement.
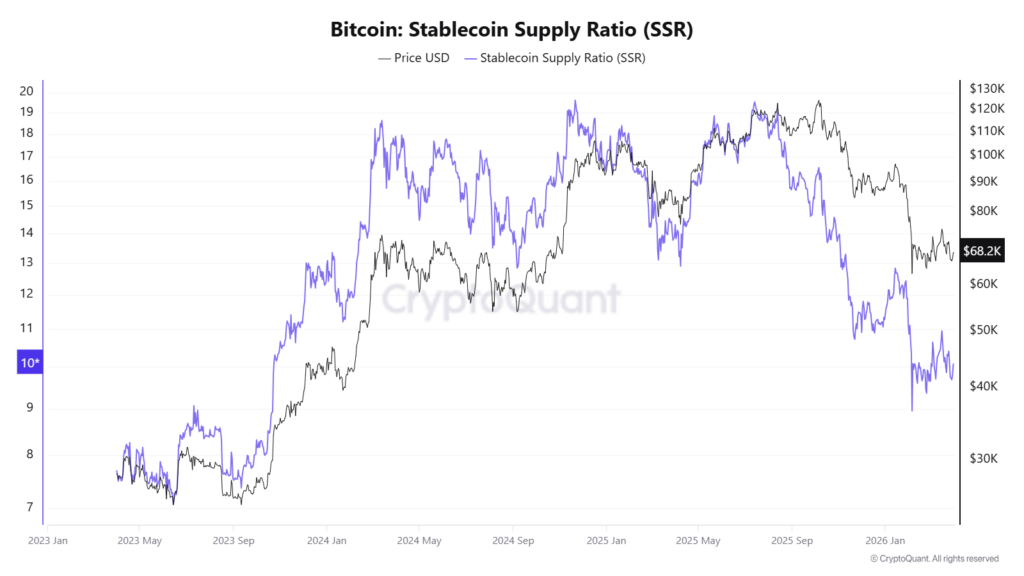
Late March also suggested that stablecoin buying power was becoming more supportive, but not forceful enough to drive an immediate repricing. As the Stablecoin Supply Ratio moved lower while BTC remained soft, the signal was less about aggressive risk-on demand and more about improving liquidity readiness in the background. In other words, the fuel was building faster than the move itself. That matters because markets can base on better internals for a time, but they usually need clear deployment of capital to produce lasting upside. March had signs of stabilization and accumulation, though not yet the kind of broad liquidity surge that typically powers a sustained trend higher.
Source: https://cryptoquant.com/
The main structural message is that March did not show a market being abandoned. It showed a market being parked cautiously. That is a healthier picture than capitulation, but it is not the same as renewed expansion. The difference is important. A parked market can recover quickly if the macro backdrop improves. A broken market needs much longer to repair. March left crypto looking more like the first case than the second, though still dependent on a better external environment.
Bitcoin and Ether Versus Gold, Silver, and the S&P 500
March was useful because it showed crypto in direct comparison with traditional assets under war pressure. The S&P 500 had a very weak month and finished the quarter with its worst decline since 2022. March losses for U.S. equities reflected the same forces that hit crypto: higher oil, inflation concern, rising yields, and uncertainty around growth. This matters because it prevents the wrong conclusion from being drawn about bitcoin or ether. Crypto was weak, but so were many major risk assets. In relative terms, crypto did not stand alone as the problem. It was participating in a wider repricing of risk.
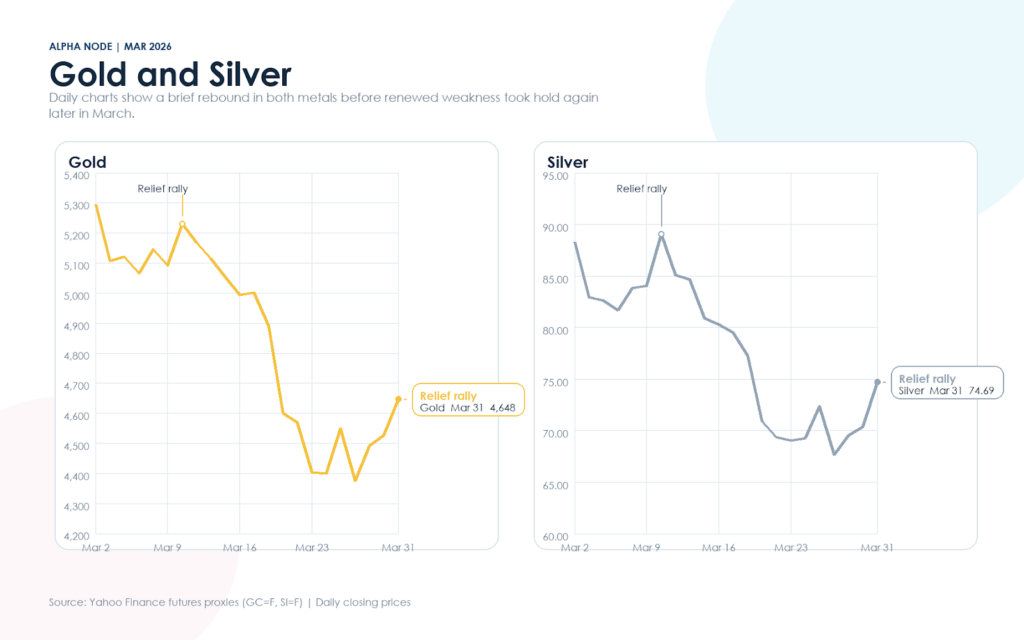
Gold and silver also produced a more complex outcome than a simple war equals safe-haven rally story would suggest. Gold rose on some days, especially when de-escalation hopes and dollar weakness shifted the tone, but it still finished March with its worst monthly decline in many years. Silver was even more volatile and also ended the month lower despite some strong rebound sessions. This is a critical point for comparing crypto with traditional havens. The war did not create a clean one-way bid into defensive assets. Instead, it created a conflict between safe-haven demand on one side and inflation plus rate concerns on the other. That conflict hurt metals too. Crypto therefore was not uniquely unable to act as a haven. The whole market struggled to decide what the correct defensive trade actually was.
In comparative terms, bitcoin showed mixed but notable resilience. It had risen to around $75,000 early in the conflict, then gave back much of that move and ended the month near the upper-$60,000s. Gold fell roughly 11% to 12% in March, while silver suffered an even steeper monthly decline. The S&P 500 fell a bit more than 5% for the month. These moves show that every major asset class was being pulled by the same macro forces, just in different ways. Equities suffered from growth and rate fears. Metals suffered from the stronger dollar and higher-rate implications of the oil shock. Crypto suffered from its sensitivity to risk appetite and liquidity, but it also held up better than a full washout might have suggested.
Ether’s comparison against gold, silver, and the S&P 500 is also revealing. ETH looked weaker than bitcoin, which fits its more growth-sensitive profile. But it still did not collapse in a way that would suggest deep internal failure. Instead, it looked like an asset whose internal fundamentals were being discounted by a macro environment hostile to future-growth narratives. In that sense, ETH behaved more like a risk-sensitive tech asset than like a hard defensive asset. That is not a new pattern, but March made it especially visible because the war sharpened the distinction. BTC retained some reserve-like demand. ETH remained more exposed to the overall mood of markets.
The cross-asset conclusion is straightforward. March did not prove that crypto is a perfect hedge, and it did not prove that crypto is merely a weak speculative sector either. What it proved is that under a real energy shock, all major assets can behave in complicated ways. Bitcoin sometimes traded like a partial hedge and sometimes like a risk asset. Ether mostly traded like a risk asset with healthy internal usage. Gold and silver failed to offer a clean refuge because the same shock that raised fear also raised inflation and rate concerns. Equities suffered from that same logic. In other words, the market spent March choosing between imperfect shelters.
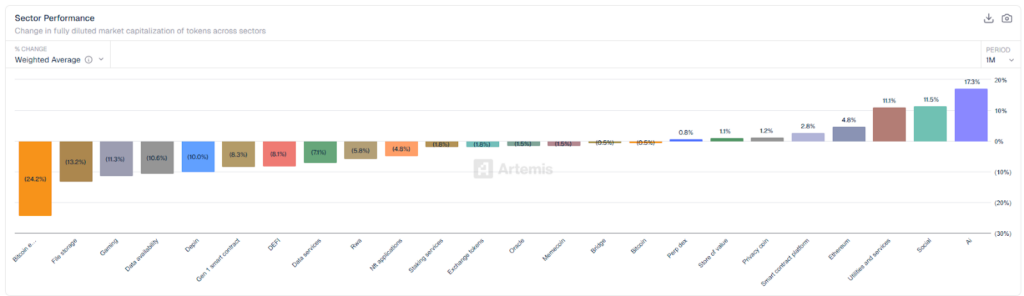
Sector Performance
Sector performance in March was clearly fragmented, with returns spread from -24.2% at the weakest end to +17.3% at the strongest. The distribution shows that most sectors still finished in negative territory, but the losses were concentrated in specific areas rather than spread evenly across the market. That points to selective weakness, not a uniform breakdown. The weakest performance came from Bitcoin ecosystem tokens, down 24.2%, followed by File Storage at -13.2%, Gaming at -11.3%, Data Availability at -10.6%, and DePIN at -10.0%. A second cluster, including Gen 1 Smart Contract at -8.3%, DeFi at -8.1%, Data Services at -7.1%, RWA at -5.8%, and NFT Applications at -4.8%, also remained under pressure. This concentration of declines suggests that large parts of the market continued to trade defensively, especially in sectors tied to higher beta or weaker near-term conviction.
Source: https://app.artemisanalytics.com/macro
Near the middle of the chart, returns were tightly compressed. Staking Services and Exchange Tokens both fell -1.8%, Oracle and Memecoin were down -1.5%, and Bridge and Bitcoin each slipped -0.5%. That flat middle matters because it suggests parts of the market were stabilizing rather than accelerating lower. In other words, selling pressure remained present, but it was no longer equally severe across all sectors. Leadership came from a relatively narrow group of sectors. Perp DEX rose 0.8%, Store of Value 1.1%, Privacy Coin 1.2%, Smart Contract Platform 2.8%, and Ethereum 4.8%. The strongest gains came from Utilities and Services at 11.1%, Social at 11.5%, and AI at 17.3%. That pattern shows capital was still willing to rotate into themes with stronger momentum, but leadership was concentrated rather than broad-based.
The broader takeaway is that March was a dispersion month. Most sectors remained weak, but a small number of higher-conviction themes meaningfully outperformed. That fits a market where investors stayed engaged, yet became much more selective about where they were willing to take risk.
Regulation as the Independent Positive Story
The most important crypto-specific positive event of March was the U.S. regulatory guidance issued on March 17. This deserves to be separated from the war narrative because it happened on its own policy track. The guidance clarified how federal securities laws apply to different categories of crypto assets and addressed the treatment of areas such as staking, mining, wrapped assets, and airdrops. For the market, that mattered because regulatory uncertainty has long acted as a valuation discount across the sector. The new framework did not eliminate every legal or compliance question, but it reduced ambiguity and made the landscape more legible.
This positive development helped explain why crypto never fully gave way during the month’s worst macro moments. Even though the war and the oil shock weighed on sentiment, regulation had become less of an immediate threat. That changed the baseline market mood. Traders and investors no longer had to price every crypto move through the assumption of maximum regulatory uncertainty. This did not make crypto immune to macro conditions, but it did improve the internal policy backdrop. The market was therefore dealing with one large external negative and one separate internal positive at the same time.
It is also worth noting that broader legislative progress still appeared uneven. Some market commentary in March linked weaker price expectations for bitcoin and ether to stalled movement on additional U.S. legislation, especially where stablecoin rules remained a point of friction. That means regulation in March was not a simple all-clear. It was more accurate to say that administrative clarity improved while broader legislative momentum remained incomplete. Even so, the clarity itself was meaningful enough to stand out as one of the month’s few clearly supportive developments.
The practical importance of this section is that it changes how March should be remembered. Without the regulatory improvement, the month would read mostly as a macro-dominated setback. With it, March looks more like a month where crypto’s internal foundations improved while the outside world made price action difficult. That distinction matters because it implies that once macro pressure fades, the market may have less internal friction than it had before. March did not fully reward that shift, but it did register it.
Wrap-up
The clearest summary of March is that the war involving Iran turned the entire market, including crypto, into an inflation-and-liquidity story. Oil rose sharply, transport risk through the Strait of Hormuz became central, gasoline prices climbed, and investors scaled back confidence in a fast or easy policy path. Those forces weighed equities, metals, and digital assets together. Crypto-specific positives existed, especially regulation and parts of the on-chain picture, but they were not powerful enough to overcome the macro backdrop. That is why March felt heavy even when the market was not actually breaking apart underneath.
Bitcoin ended the month looking like an asset that is still maturing. It was able to absorb stress, avoid disorderly collapse, and attract some accumulation under the surface. But it did not convincingly become the market’s main haven. Ethereum ended the month with a weaker chart than bitcoin, but stronger internal usage than price implied. Stablecoins showed that capital stayed near the market while refusing to chase risk aggressively. The S&P 500, gold, and silver all showed that there was no perfectly clean defensive trade in March. Nearly every asset was caught between fear, inflation, rates, and uncertainty over how long the conflict would last.
The full-market setup at month end was therefore cautious rather than broken. There were signs of accumulation, stabilization, and better structure under the surface, especially in bitcoin and in on-chain capital behavior. There were also obvious reasons for hesitation: overhead supply, subdued spot conviction, uncertain stablecoin deployment, and a macro environment still dominated by war-related energy risk. March did not resolve those tensions. It exposed them. That makes it a valuable month for analysis because it showed the market’s real shape under pressure rather than under ideal conditions.
The right closing view is not that March was bullish or bearish in any simple sense. March was a transition month. The internal condition of crypto improved in selected ways, especially in policy clarity and parts of market structure, but the external world turned sharply more difficult. The war involving Iran explains most of that external difficulty. It raised energy prices, altered inflation expectations, complicated the rate outlook, and forced markets to reduce risk. Crypto spent the month navigating that shock rather than escaping it. That is the most accurate way to frame what happened and why it mattered.