Fed Pressure Crypto Market Splits Momentum
30th April 2026 • 9 mins read
This Week’s Recap
- Fed leaves rates unchanged at Jerome Powell’s final meeting as chairman: The Fed kept the target range at 3.50% to 3.75%, and the decision landed with inflation language still firm enough to keep risk assets tied to the next data release.
- Bitcoin Coinbase premium turns negative as realized losses spike: Onchain data pointed to roughly $5.97 billion in realized losses as U.S. spot demand weakened, which made the $80,000 rejection feel less like a pause and more like a test of buyer depth.
- Robinhood and Coinbase lead crypto stock rout as Trump rejects Iran plan: Crypto-linked equities sold off as oil surged and investors cut exposure to high-beta names.
- Senator Thom Tillis says the CLARITY Act is ready for a hearing: Tillis said the bill could move toward a May hearing, giving the market a live regulatory calendar after weeks of delay around stablecoin yield and market-structure language.
- Visa expands stablecoin settlement as volume hits a $7 billion run rate: Visa added Arc, Base, Canton, Polygon, and Tempo to its settlement pilot, taking supported chains to nine and framing stablecoins as a working settlement tool rather than a lab experiment.
- Securitize and Computershare open a path for U.S. stocks to move onchain: Computershare serves as transfer agent for 58% of the S&P 500, so the partnership matters because tokenization is being pushed closer to official shareholder records.
- MoonPay acquires Israeli crypto security firm Sodot in a $100 million deal: The acquisition gives MoonPay a stronger institutional security arm and puts former CFTC official Caroline Pham in a visible role around the new business.
- Visa support expands to Base and Polygon: Cointelegraph reported the expansion as another step toward mainstream payment infrastructure, with Polygon and Base now part of the settlement program.
- Bitcoin miners face AI concentration risk: CryptoSlate tied miners’ HPC pivots to a broader equity-market warning after the 10 largest AI stocks reached about 41% of the S&P 500.
- Bitcoin ETFs fuel institutional surge with a $100,000 target still discussed: ETF demand remains the main institutional support line, even though the latest daily tape showed outflows.
- Czech central bank governor says Bitcoin can go higher or to zero: The comment kept sovereign allocation debate alive after a test portfolio reportedly showed a small Bitcoin allocation improving expected returns.
- Bitmine rockets past 5 million ETH with a fresh purchase: The treasury company acquired 101,901 ETH last week and lifted holdings above 5 million ETH, keeping the corporate ETH accumulation theme active.
- Jack Dorsey’s Block nears 9,000 Bitcoin after a Q1 addition: Block added 114 BTC and brought reported holdings to 8,997 BTC, reinforcing the corporate treasury bid even as prices stayed choppy.
- DeFi United unveils rsETH recovery plan after a $293 million exploit: A coalition of projects committed almost $240 million to restore backing after the KelpDAO-linked shortfall.
- Standard Chartered says DeFi is shaken but still resilient: The bank kept its $2 trillion real-world-asset outlook even after the latest exploit, showing that institutional DeFi expectations are being trimmed rather than abandoned.
- Israel approves its first regulated stablecoin: BILS was approved as a regulated digital shekel developed with Solana, Fireblocks, and EY.
- South Korea’s Kbank tests Ripple integration: The bank powering Upbit’s fiat access is conducting technical verification for blockchain-based overseas remittances.
- Acting AG Todd Blanche says code is not a crime: The DOJ shift matters because developers would not be charged unless they knowingly help third parties commit crimes.
- Polymarket seeks CFTC approval to reopen to U.S. traders: Prediction markets remained a live U.S. policy story as platforms looked for regulated access after state-level fights.
- CFTC sues Wisconsin over prediction-market authority: The agency moved to defend federal jurisdiction over event contracts, adding another state to the legal fight.
- Prediction market volume hits $25.7 billion: Retail repeat activity is turning prediction markets into a broader trading category rather than a one-off election product.
- Robinhood shares drop after Q1 earnings miss: Crypto revenue and volume fell sharply even as prediction-market products helped diversify the platform.
- Hyperliquid prepares to challenge Polymarket: The platform is looking at event trading as prediction-market volumes grow.
- Litecoin MWEB bug allowed an attacker to create 85,034 LTC: A validation flaw led to an inflated pegout in March before a coordinated response recovered funds.
- Judge rejects Sam Bankman-Fried’s new trial request: Judge Lewis Kaplan dismissed the request tied to the former FTX CEO’s 25-year sentence.
- Celsius founder Alex Mashinsky settles FTC case with a $10 million payment: The settlement sits against a suspended $4.72 billion judgment that can be revived depending on asset disclosures.
- Bullish brings Bitcoin options to Ripple Prime clients: The integration gives institutions a prime-brokerage route into Bitcoin options.
- Solana introduces post-quantum solution Falcon: Firedancer and Anza are testing cryptography meant to harden the network against future quantum threats.
- EU bans digital rubles in a 20th round of Russia sanctions: The package restricts support for ruble-backed tokens and state-linked CBDCs.
- XRP drops below the $1.40 pivot: Selling pushed XRP through a watched support area, turning the former floor into near-term resistance.
Bitcoin Market Analysis
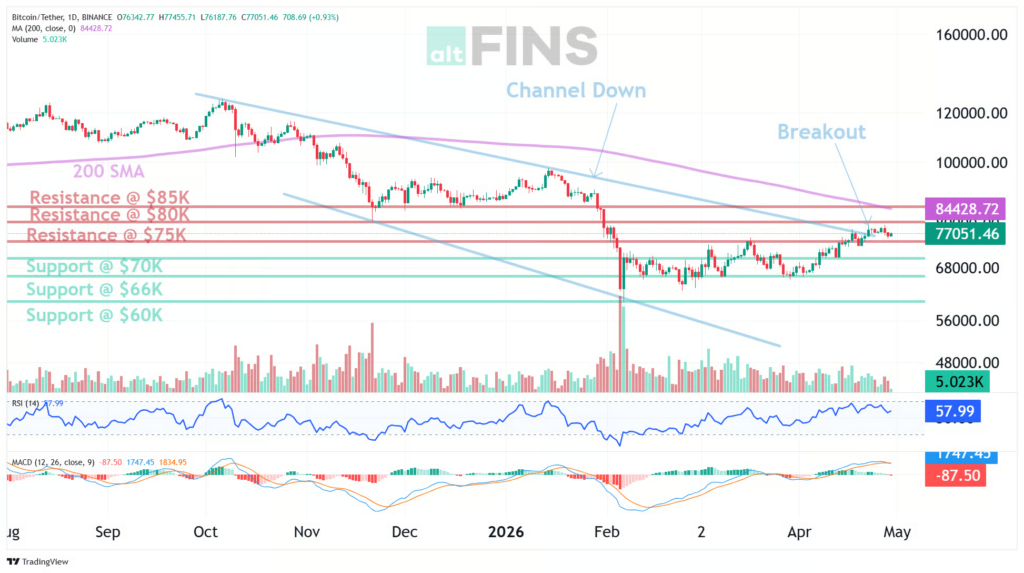
Bitcoin held a cleaner structure than the macro headlines suggested, but it still had work to do. Price was near $75,896 in the latest technical snapshot, down 0.56% on the session, with short-term and medium-term trend labels both pointed up while the long-term trend remained down. That mix fits the week: a rebound has formed, but the market has not earned a full-cycle trend reset.
Source: https://altfins.com/technical-analysis
The chart is still organized around a channel-down breakout. The break above $75,000 improved the setup and opened a path back toward $80,000, with $85,000 as the next higher target if buyers can turn the first level into support. Nearest support sits at $70,000, then $66,000. That leaves the market with a fairly clean map: hold the breakout area and $70,000 remains a base; lose it and the April recovery starts to look fragile.
Source: https://sosovalue.com/assets/etf/us-btc-spot
Momentum was not stretched. RSI-14 was neutral around 54, and the broader oscillator stack did not show an overbought reading. Bollinger Bands were listed near $71,552 on the lower side and $79,839 on the upper side, which puts price closer to resistance but not outside the band. ATR was about $2,288, so a normal daily move can still carry price through several thousand dollars of range without proving a larger trend change.
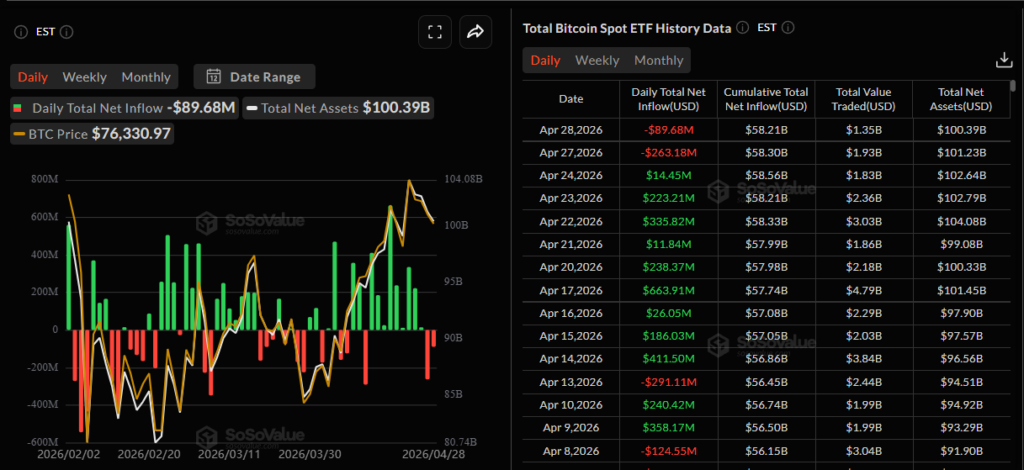
ETF flows were no longer a one-way support. The latest table showed a $89.7 million spot BTC ETF outflow, $1.35 billion in value traded, $100.4 billion in net assets, and $58.2 billion in cumulative net inflows. That is still a large asset base, but the daily flow turned red at the same time Coinbase premium data pointed to weaker U.S. spot appetite. The message from flows was simple: institutions are still present, but marginal demand is more selective.
The narrative around Bitcoin stayed split between institutional conviction and macro pressure. Block added to its treasury, and ETF strategists continued to discuss a path toward $100,000 by year-end, but realized losses near $6 billion show that plenty of buyers are still underwater. A market can absorb that, but it needs time or fresh demand. Oil and the Fed kept the final word for now. A hold at 3.50% to 3.75% did not kill the recovery, but it made every data point more important. If Bitcoin holds $70,000 and reclaims $80,000, the April base starts to look useful. If $70,000 fails while ETF flows stay negative, the market probably checks whether the $66,000 support zone is real.
Ethereum Market Analysis
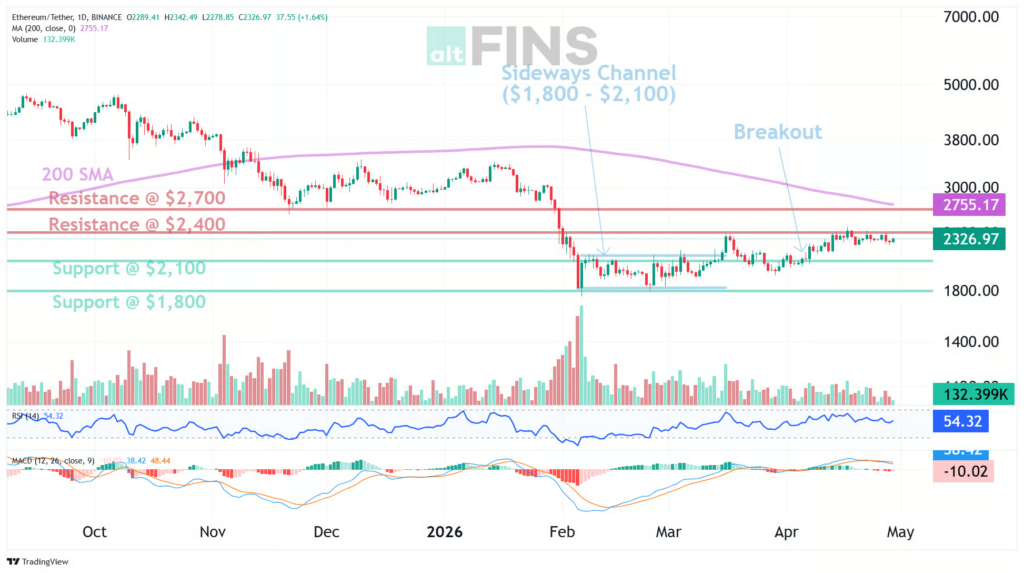
Ethereum’s week was less about panic and more about waiting for confirmation. Price was near $2,256.95 in the latest snapshot, down 1.42% on the session, after reaching the $2,400 resistance area. The medium-term trend had improved to up, while the short-term trend was neutral and the long-term trend remained down. ETH has stopped acting like a breakdown, but it has not yet earned the right to act like a breakout.
Source: https://altfins.com/technical-analysis
The $2,400 line is the first real decision point. ETH already reached that target after breaking back above $2,100, and now the chart needs either a clean break above $2,400 toward $2,700 or a controlled pullback that keeps $2,100 intact. The support map is straightforward: $2,100 first, then $1,800. Resistance sits at $2,400, then $2,700.
Source: https://sosovalue.com/assets/etf/us-eth-spot
Momentum leaned softer than Bitcoin. RSI-14 was neutral around 49, but several short-term oscillators were oversold, including Stoch readings and CCI. MACD was bearish, and ATR was about $92.52, which gives ETH enough room to retest $2,100 without turning the whole structure into a failed recovery. The setup is a pause at resistance, not a confirmed reversal higher.
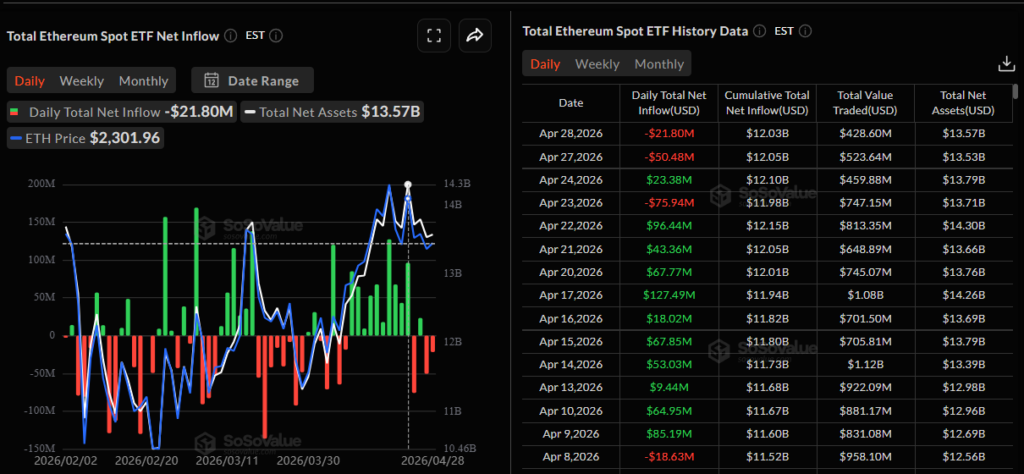
Spot ETH ETF flows were also negative in the latest table. Net flow was listed at -$21.8 million, value traded at $428.6 million, net assets at $13.6 billion, and cumulative net inflow near $12.0 billion. That puts ETH in a similar position to BTC, only with a smaller flow base and less room for disappointment. A few strong treasury headlines can help sentiment, but the ETF tape still needs persistence.
The biggest ETH-specific support came from corporate accumulation. Bitmine added 101,901 ETH and pushed holdings above 5 million ETH, reinforcing the view that ETH can sit on corporate balance sheets for staking and treasury strategy. That matters because ETH’s post-upgrade story is no longer only about network activity; it is also about who wants the asset, at what size, and for what yield. The risk side stayed visible through DeFi. DeFi United’s rsETH recovery plan showed that the sector can coordinate around damage, but the need for that coordination is itself the warning. ETH can push toward $2,700 if $2,400 breaks and ETF flows improve. If $2,100 gives way, the recovery turns into another range trade.
Miners Pick Up an AI Risk
Bitcoin miners spent the past year explaining that they were becoming power and data-center companies, not just hash-rate operators. That helped equity stories during the AI boom. It also created a second risk channel. CryptoSlate reported that the 10 largest AI stocks now account for about 41% of the S&P 500, close to the concentration levels seen around prior market extremes, while public miners have announced more than $70 billion in aggregate AI and HPC contracts.
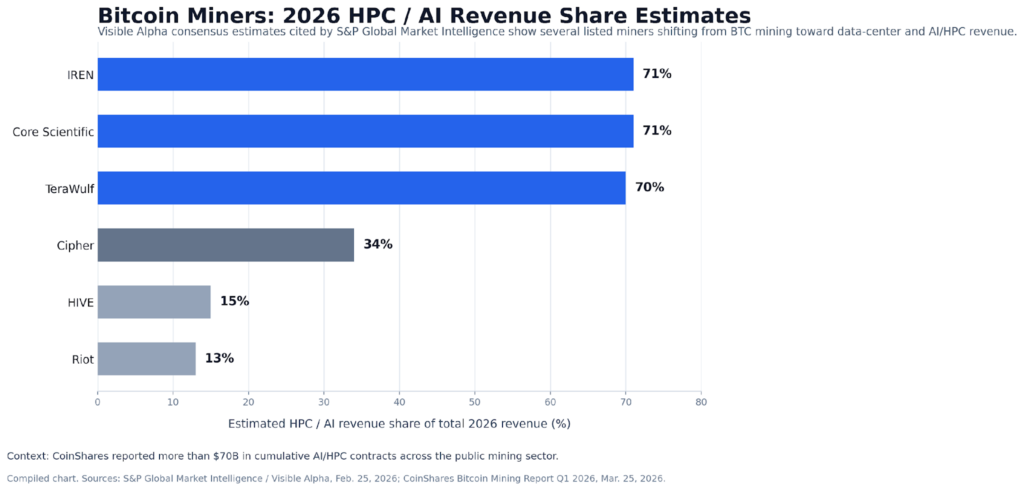
Source: Compiled from S&P Global Market Intelligence / Visible Alpha and CoinShares Bitcoin Mining Report Q1 2026
The problem is that the AI pivot changes what investors are underwriting. A miner with long-duration HPC leases, power-conversion commitments, debt-funded buildouts, and GPU utilization risk is no longer judged only by Bitcoin price, mining difficulty, and hashprice. It is judged by whether AI demand remains strong enough to support the new valuation story.
The split is useful. A weaker AI cycle could reduce pressure on scarce power, cooling equipment, rack space, and interconnection queues, which might help pure miners over time. It would hurt the listed miners whose market value now depends on the HPC pipeline. That makes miner equities a less direct Bitcoin proxy than they used to be.
Stablecoin Rails Move Into Payments
Visa’s stablecoin announcement was the week’s cleanest infrastructure signal. The company said its settlement pilot now supports nine blockchains after adding Arc, Base, Canton, Polygon, and Tempo, and that the program reached a $7 billion annualized run rate, up 50% since last quarter. Those numbers are still tiny beside Visa’s legacy network, but they move stablecoin settlement out of the proof-of-concept bucket.
The chain list matters because it covers different use cases. Base and Polygon point toward cheap, public-chain settlement. Canton points toward regulated capital markets. Arc and Tempo are more purpose-built payment rails. Visa is not making a single-chain bet. It is building an options layer for issuers and acquirers that want stablecoins without rebuilding their whole treasury stack.
Tokenized equities added a second leg to the same story. Securitize and Computershare are working on issuer-sponsored tokens for U.S. public companies, with Computershare serving as transfer agent for 58% of the S&P 500. That is different from offshore stock wrappers or synthetic price trackers. It brings tokenization closer to shareholder records, corporate actions, and issuer control. If it scales, the market will not need to ask whether assets can move onchain. It will ask which parts of the market still need to stay offchain.
Mark Your Calendars
Economic Data Releases:
- May 8, 2026 (Friday): U.S. Employment Situation for April 2026
Token Unlock
- May 1, 2026 (Friday): SUI unlocks about $65 M
- May 3, 2026 (Sunday): JUP scheduled token unlock
- May 29, 2026 (Friday): HYPE unlocks about $521 M