
Bitcoin Tests $65k as Prediction Market Surge
16th July 2026 • 8 mins read
This Week’s Recap
- Bitcoin pushed toward $65,000 after the CPI print: June CPI fell 0.4%, annual inflation slowed to 3.5%, and BTC traded as high as $64,832 after the report landed. The catch was energy: Brent crude moved back above $85 as the Strait of Hormuz story worsened, so the same inflation relief that lifted Bitcoin may already be stale.
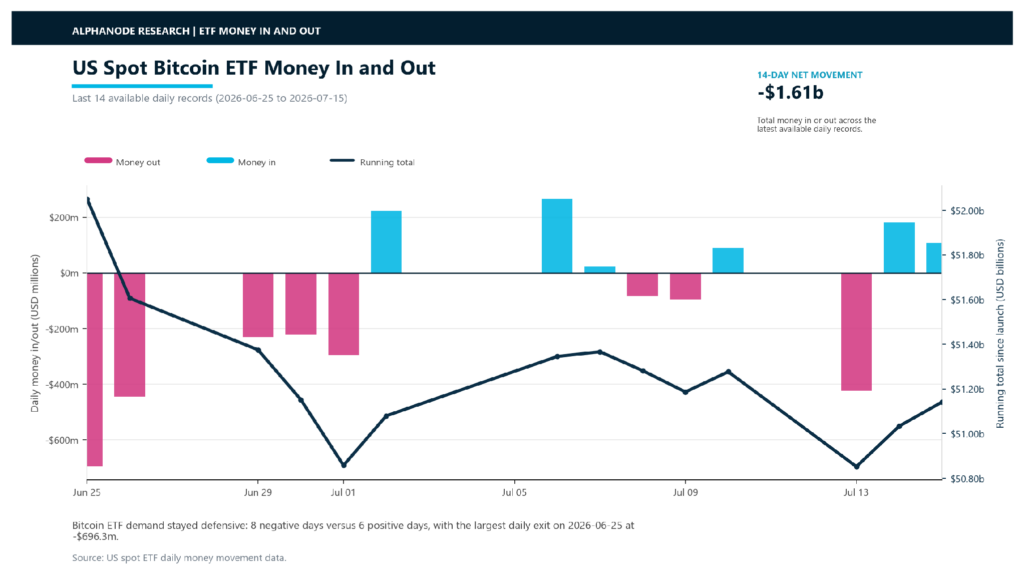
- US spot Bitcoin ETFs lost $424.7 million on July 13: The single-day exit wiped out the prior rebound and showed how fragile ETF demand still is. API data then showed $181.1 million entering on July 14 and $107.8 million entering on July 15, so the fund channel improved late but still lost $1.61 billion across the latest 14 records.
- DTCC moved tokenized securities into live production trades: More than two dozen firms, including JPMorgan, Goldman Sachs, BlackRock, and Vanguard, took part in transactions involving tokenized stocks, ETFs, and US Treasurys. The important detail is ownership: DTCC described the tokens as digital twins of existing securities that preserve shareholder rights.
- Japan reclassified crypto as a financial asset: The bill moves crypto from a payment-focused regime into investment-product rules and opens the path for future spot Bitcoin ETFs. It also sets up a tax cut from as high as 55% to a flat 20% from 2028, which could change how Japanese investors treat crypto gains.
- Trump’s CLARITY Act meeting put ethics language at the center of the bill: The White House was expected to meet senators over restrictions on senior officials’ crypto business interests. The bill still has a path, but the August recess clock means every delay now matters.
- Senate Democrats attacked the CLARITY Act as corrupt: Critics focused on Trump’s personal crypto ties and demanded stronger conflict rules. That changes the bill’s near-term risk from technical policy design to whether lawmakers can separate market rules from presidential business interests.
- Strategy sold $466.7 million of MSTR shares and kept its BTC stack unchanged: The company lifted its cash reserve to $3 billion and reported 843,775 BTC at an average purchase price of $75,476. The move was a cleaner signal than last week’s BTC sale because it rebuilt cash without adding direct Bitcoin supply.
- Bitcoin treasury loans already faced collateral calls in 2026: Some Bitcoin-backed loans can move from warning to liquidation in as little as 12 hours. That matters because public-company BTC holders are no longer judged only by how many coins they own, but by the financing terms around those coins.
- The US government moved $297 million in seized Bitcoin and Ether to Coinbase Prime: The transfer involved assets tied to Farace and BTC-e seizures. It does not prove an immediate sale, but exchange custody by a government wallet is the kind of supply signal traders watch closely.
- Bitcoin whales exited $4.3 billion during the rebound: Wallets holding 100 to 1,000 BTC reportedly distributed 67,000 BTC on July 13. Smaller buyers and ETF investors may be returning, but large-holder selling can cap rallies before the chart looks damaged.
- BlackRock’s crypto assets fell 39% despite $15 billion of net inflows: Price losses overwhelmed new money entering the firm’s crypto products over the past year. That is the cleanest reminder that ETF adoption does not remove market risk when the underlying assets fall.
- Stripe and Advent made a $53 billion bid for PayPal: The reported $60.50 per-share offer was a 28% premium to PayPal’s prior close. Both companies sit close to stablecoin payments, so the deal would not just reshape online payments; it would concentrate more stablecoin distribution power in one payments stack.
- Open USD pressure kept Circle’s business model in focus: CoinShares framed Open USD as the toughest rival yet for USDC economics. The threat is less about Circle losing all users and more about partners demanding a larger share of the income behind the token.
- US officials froze $131 million in Iran-linked USDT: Authorities targeted four Tron wallets as geopolitical pressure climbed. Stablecoins keep proving useful for fast settlement, but the same features also make freezing power part of the product’s political story.
- JCB and Circle agreed to explore USDC payments in Japan: Japan’s largest card network reaches roughly 40 million merchants. The pilot gives USDC a regulated payments angle in a market that is now rewriting crypto as an investment and payments category at the same time.
- Hyundai completed an internal USDT settlement pilot between the US and Mexico: The company used stablecoins for cross-border corporate settlement rather than consumer speculation. That kind of use is easy to underestimate because it looks boring, which is exactly why large companies may test it.
- Visa, Mastercard, and Ripple backed the x402 AI payment standard: The protocol reportedly settled $24 million across 75 million payments last month. If AI agents are going to buy data, software, and services automatically, tiny stablecoin payments are one of the few payment models that fit the job.
- Prediction markets topped $50 billion in monthly World Cup volume: Decentralized venues reportedly beat traditional sportsbooks during the tournament. The number puts prediction markets in the same conversation as sports betting, brokerage apps, and exchange-traded event contracts.
- SEC staff were reviewing more than 24 ETFs tied to election betting: Funds from Bitwise and Roundhill were among the proposals under review. If approved, event markets could move from crypto-native venues into brokerage accounts, which would widen access and raise the political stakes.
- Polymarket sought approval to bring margin trading to US customers: Margin would make the platform more capital efficient and more dangerous. Prediction markets are already moving fast; leverage would force regulators to treat them less like novelty apps and more like trading venues.
- Ostium lost $18 million in an oracle attack: The attacker reportedly used false future-dated data to create fake trading profits. The problem was not a new token narrative; it was the old DeFi weak point of trusting the wrong price at the wrong time.
- Bonzo Lend lost $9 million after an oracle failure: A zeroed signature allowed the attacker to drain the Hedera-based lender. Two oracle stories in the same week make the risk hard to dismiss as a one-off implementation bug.
- Humanity Protocol refocused security after a $36 million hack: The project said it would prioritize operational security and human behavior risk. The statement matters because many losses now start outside smart contracts, with staff processes, permissions, and social engineering doing the damage.
- BitMine earned $46 million staking ETH, then lost $92.1 million on ETH-linked bets: The company’s staking business worked, but the trading book overwhelmed it. That split is a useful warning for ETH treasury firms: staking income does not automatically make a leveraged ETH strategy safe.
- EthSystems spun out of the Ethereum Foundation to target banks with privacy technology: The new entity is aimed at large financial users that need privacy before using public-chain infrastructure. For Ethereum, bank adoption depends as much on confidentiality and controls as it does on throughput.
- Aave launched V4 on Avalanche: The deployment is designed to support tokenized asset lending and more flexible risk controls. It gives Ethereum’s broader lending stack another growth path, even if value does not always accrue directly to ETH.
- South Korea moved to classify crypto as national assets: The proposal updates a 76-year-old law and sits beside a planned tokenized government bond pilot in 2027. Asia’s policy story is becoming less about bans and more about how governments account for digital assets.
- The ECB picked 36 firms for a digital euro pilot: Deutsche Bank, Revolut, and other providers were selected to test a beta version of the currency. The pilot keeps central bank money in the same payments conversation as stablecoins, bank tokens, and tokenized deposits.
- New York froze large data-center permits above 50 MW: The moratorium hits the exact energy footprint miners need for AI hosting pivots. Bitcoin miners can tell investors they are becoming data-center companies, but power permits are now a bottleneck as important as machines.
- CleanSpark signed a $6.6 billion AI infrastructure lease before securing the full buildout capital: The 20-year agreement covers 175 MW of IT load in Georgia. It shows how miners are chasing AI revenue, but also how quickly the capital bill can outrun a Bitcoin balance sheet.
Bitcoin Market Analysis
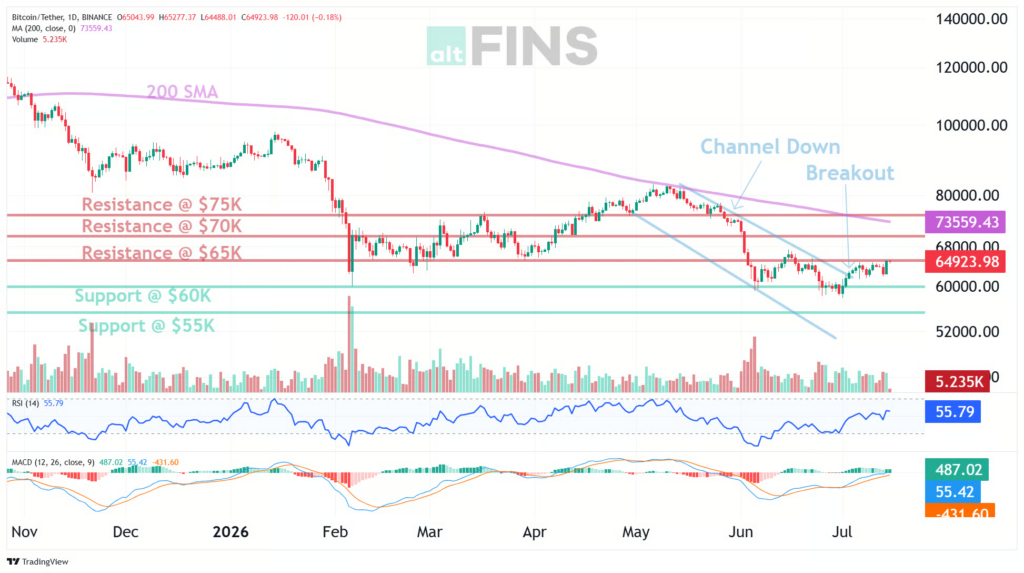
Bitcoin traded like a market trying to recover before the evidence was fully there. The latest chart data put BTC near $64,571, down 0.28% on the day but up 3.67% over the week, after touching an intraday high near $65,588. Price is still 48.84% below the October 2025 high, but the week did move the market away from the June low near $57,794. The CPI print gave buyers a cleaner reason to test $65,000. They still have to prove they can hold it.
Source: https://altfins.com/technical-analysis
The chart setup improved at the front end and stayed damaged underneath. Short-term direction was up, medium-term direction was down, and long-term direction remained strongly down. MACD stayed bullish, RSI-14 sat in neutral territory near 55, and the shorter moving averages had turned higher. The 50-day, 100-day, and 200-day averages were still pointed lower, so this is a bounce inside a larger repair job rather than a fully healed trend.
The level map is still blunt. $60,000 is the first support zone, with $55,000 beneath it if the rebound fails. $65,000 is immediate resistance, and $70,000 is the next level that would make the market look less trapped. The upper Bollinger Band near $66,235 shows why the first attempt stalled near the mid-$60,000s. A daily close through $65,000 would help, but a move through $70,000 would change the tone more clearly.
Source: https://sosovalue.com/assets/etf/us-btc-spot
ETF data kept the rally honest. Across the latest 14 available daily records, $1.61 billion left US spot Bitcoin ETFs, with eight negative days and six positive days. The week ended better than it began: $181.1 million entered on July 14 and $107.8 million entered on July 15, while net assets rose to $78.47 billion and cumulative net money entering the funds stood at $51.14 billion. The improvement matters. The window still shows that Bitcoin has not fully repaired the fund demand problem that hurt it in late June.
The narrative was less about pure accumulation and more about balance sheets under stress. Strategy raised $466.7 million through share sales, rebuilt its cash reserve to $3 billion, and left 843,775 BTC untouched after selling coins the prior week. That was the better version of the treasury story. The harder version came from Bitcoin-backed loans already facing collateral calls and whales reportedly distributing $4.3 billion of BTC into the rebound.
Bitcoin’s cleanest path is still through the same gate. Softer inflation helped, but the CPI relief is vulnerable to an oil rebound if energy prices feed back into July data. The market can live with uneven ETF demand if price clears $65,000 and then $70,000. It will struggle if those levels reject again while oil keeps the Fed cautious. This week gave Bitcoin a chance. It did not give it a free pass.
Ethereum Market Analysis
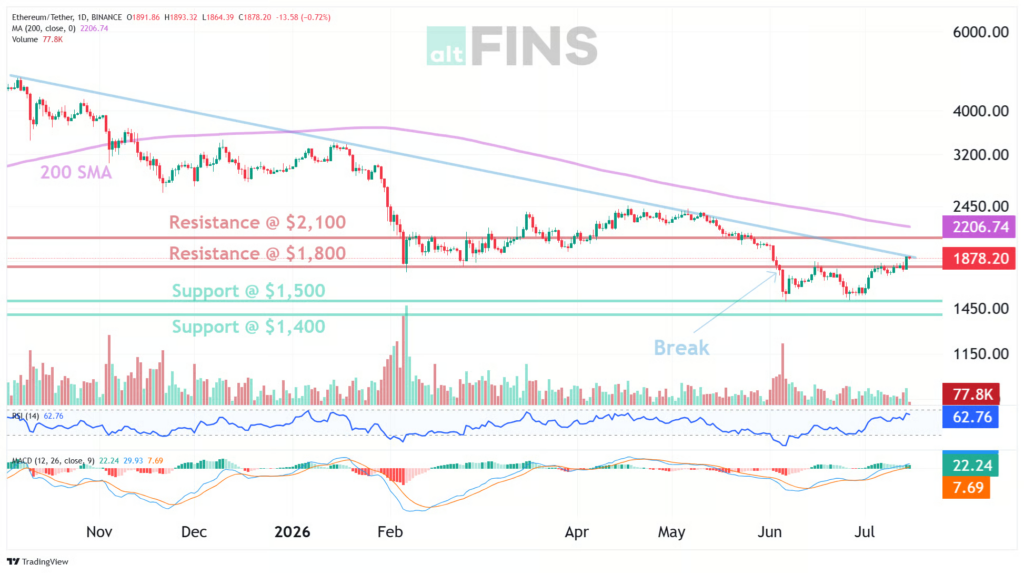
Ethereum led with the chart instead of the headline tape. ETH traded near $1,916, almost flat on the day but up 10% over the week, after bouncing from the $1,500 support area and breaking back above $1,800. That move put price at the downtrend line and close to the upper Bollinger Band near $1,948. The rebound is strong enough to matter because ETH is now testing whether a recovery can become a trend change.
Source: https://altfins.com/technical-analysis
The internal readings were better than Bitcoin’s at the short end. Short-term direction was up, medium-term direction was neutral, and long-term direction was still strongly down. MACD was bullish, momentum was positive, and RSI-14 was neutral, though faster oscillators had moved into overbought territory. That mix argues for patience near resistance. ETH has improved, but it has also moved far enough in a week to invite a pause.
Support sits at $1,500, then $1,400. Resistance is higher at $2,100, which is the level that would confirm the $1,800 reclaim was more than a relief move. ETH remains 61.34% below its August 2025 high near $4,957, and the 200-day moving averages are still deep above spot. The chart can now make a bullish argument, but only if buyers keep ETH above the reclaimed $1,800 area and then attack $2,100.
Source: https://sosovalue.com/assets/etf/us-eth-spot
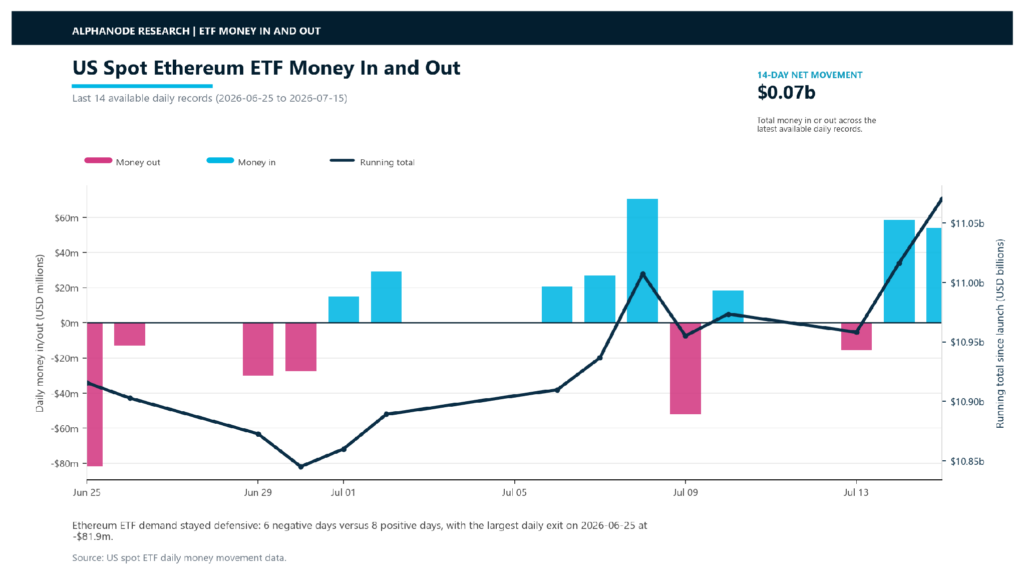
ETH ETF data was the cleaner fund story. Across the latest 14 available daily records, $72.8 million entered US spot ETH ETFs, with eight positive days and six negative days. The latest two sessions added $58.3 million and $53.8 million, lifting net assets to $10.40 billion and cumulative net money entering the funds to $11.07 billion. Bitcoin still carried a negative 14-day fund window. Ethereum did not.
The ETH-specific news had two sides. BitMine made $46 million from Ethereum staking but lost $92.1 million on ETH-linked bets, which is a sharp reminder that yield does not protect a bad trading book. The stronger long-term thread came from EthSystems targeting bank privacy needs and Aave launching V4 on Avalanche. Those are useful because they tie Ethereum’s role to lending, privacy, and tokenized assets rather than just ETF demand.
Ethereum’s next test is cleaner than Bitcoin’s. If ETH holds $1,800 and moves through $2,100, the fund data and chart will finally point in the same direction. If it fails at the downtrend line, the week becomes a strong bounce inside a weak long-term structure. The better part of the story is that ETF money has already turned positive on a 14-day view. The weaker part is that one resistance break does not erase a 61% drawdown from the high.
Prediction Markets Become the Week’s Breakout Trade
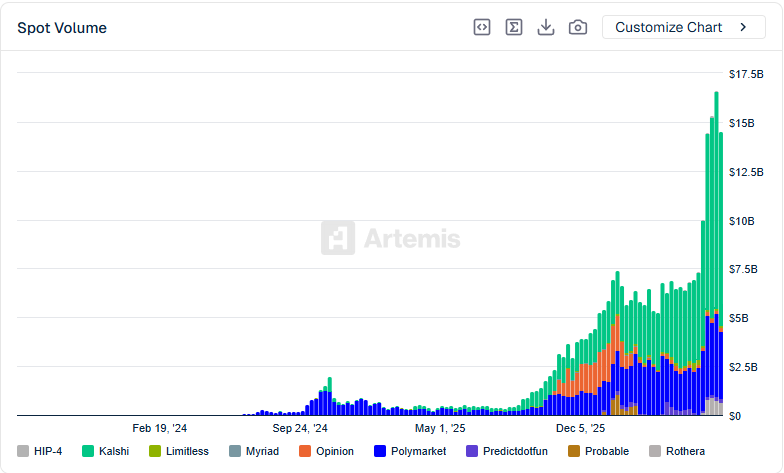
Prediction markets were the week’s least stale story because the numbers moved beyond crypto curiosity. CoinDesk reported that World Cup trading pushed monthly volume above $50 billion, while DefiLlama’s sector page showed $3.974 billion of seven-day prediction-market volume, $12.55 million of seven-day fees, and $6.98 million of seven-day revenue. Artemis data published through TradingView showed the same break in visual form: monthly trading volume climbed from a few billion dollars earlier in the cycle to more than $50 billion around the World Cup window, led by Kalshi and Polymarket. The category is no longer waiting for a bull-market explanation.
Source: https://classic.artemis.ai
The shift matters because prediction markets now sit between three industries that all want the same user: sportsbooks, brokerage apps, and crypto exchanges. Polymarket is seeking US margin approval, the SEC is reviewing more than 24 ETFs that could put election bets in brokerage accounts, and Kalshi keeps pushing regulated event contracts into sports and economic releases. That is a different business from a token launch. It is a fight over whether people will trade events the way they trade stocks, options, and sports lines.
Regulators will not treat $50 billion of monthly activity as a side project. Sports contracts pull in gambling law, election contracts pull in political risk, and leveraged event contracts pull in market-structure risk. The opportunity is obvious: high-volume event markets can turn news into tradable prices faster than polls or analyst notes. The risk is just as clear. If the products add leverage before user protections catch up, prediction markets could inherit the worst parts of both crypto trading and sports betting.
Mark Your Calendars
Economic Data Releases:
- July 17, 2026 (Friday): US Import and Export Price Indexes for June 2026
- July 21, 2026 (Tuesday): State Employment and Unemployment for June 2026
Token Unlock
- July 17, 2026 (Friday): deBridge (DBR) unlocks about $10.38 million, equal to 11.43% of reported market cap
- July 20, 2026 (Monday): LayerZero (ZRO) unlocks about $21.11 million, equal to 4.60% of reported market cap
- July 20, 2026 (Monday): Kaito (KAITO) unlocks about $13.44 million, equal to 4.30% of reported market cap