
ETF Demand Carries Crypto Into Overbought Territory
27th August 2026 • 9 mins read
This Week’s Recap
- July PCE inflation reached 3.7% year on year: The Federal Reserve’s preferred headline inflation gauge rose 0.2% in July and 3.7% from a year earlier, while core PCE increased 3.3% year on year. Real consumer spending was flat for the month, leaving the market with sticky prices and little growth cushion after crypto’s sharp rally.
- The Dallas Fed mapped a $700 billion risk from more mobile deposits: Its scenario shows that a 10% increase in deposit rate sensitivity could cut banks’ appetite for duration risk by $700 billion in ten-year-equivalent terms. Banks could preserve lending by issuing more term debt, but that would raise funding costs and feed into the price of credit.
- A $6.4 billion Bitcoin options expiry lands Friday: The expiry follows a fast move from roughly $62,000 to above $80,000, leaving dealers and leveraged traders exposed to larger hedging flows near major strikes. With spot momentum already overbought, positioning can move price faster than fresh fundamental news.
- Shinhan Financial and Visa will test stablecoin issuance and business settlement in South Korea: The work covers remittances, business-to-business settlement and AI-assisted payment models. A large domestic financial group and a global card network are trying to connect issuance with distribution rather than building another isolated token pilot.
- Japan began planning blockchain settlement for stocks and government bonds: The FSA, Ministry of Finance and Bank of Japan are expected to develop a plan by early 2027, with a system potentially operating in the early 2030s. Tokenized central-bank reserves would settle against securities transfers, compressing a process that now takes one or two days toward real time.
- Thirty-nine state banking groups formed BankChain Alliance: The association-owned network is intended to support tokenized deposits, stablecoins, automated settlement and smart payment tools for banks of different sizes. The group is selecting a technology partner and targets a 2027 launch.
- The SEC sent its crypto custody overhaul to the White House for review: The proposal would replace rules that have made digital-asset custody difficult for investment advisers and registered funds. White House review moves the package closer to a formal proposal, where the definition of a qualified custodian will decide how much crypto can sit inside conventional portfolios.
- Revolut began rolling out its euro stablecoin EURR: Customers in Denmark, Poland and Portugal are first in line, giving the token distribution through an existing consumer-finance app. Euro stablecoins remain small beside dollar tokens, but retail access is no longer the main bottleneck in those markets.
- LayerZero introduced ATLAS for matching, clearing and settlement: The headless backend is provisioned for 200,000 transactions per second at launch, with sub-millisecond median latency in its current deployment-like environment. Trading venues keep their own customer interface and receive fee rebates, while the remaining economics flow to market creators and ZRO buybacks and burns.
- POSCO brought trade receivables to Avalanche: The South Korean trading company is using Intain’s platform to finance receivables onchain. The structure moves tokenization into working capital, where faster verification and settlement can release cash before an invoice reaches maturity.
- Chainalysis counted $457 billion in potentially taxable onchain activity: The United States accounted for about $112.6 billion of the 2025 total. CARF directly captures $63.8 billion in the firm’s model, or 14%, while decentralized exchanges, self-custody, peer-to-peer transfers and several income categories sit outside the reporting framework.
- XRP’s 44% rally pulled leverage back into the market: Binance leverage ratios reached their highest level since January after the price surge. A crowded long base makes the next decline easier to accelerate because falling collateral values and liquidations reinforce each other.
- The crypto Fear and Greed Index reached 74: The reading is the highest since just before October’s $19 billion liquidation event. Sentiment alone does not reverse a trend, but the combination of high leverage, overbought momentum and a large options expiry has narrowed the margin for error.
Bitcoin Market Analysis
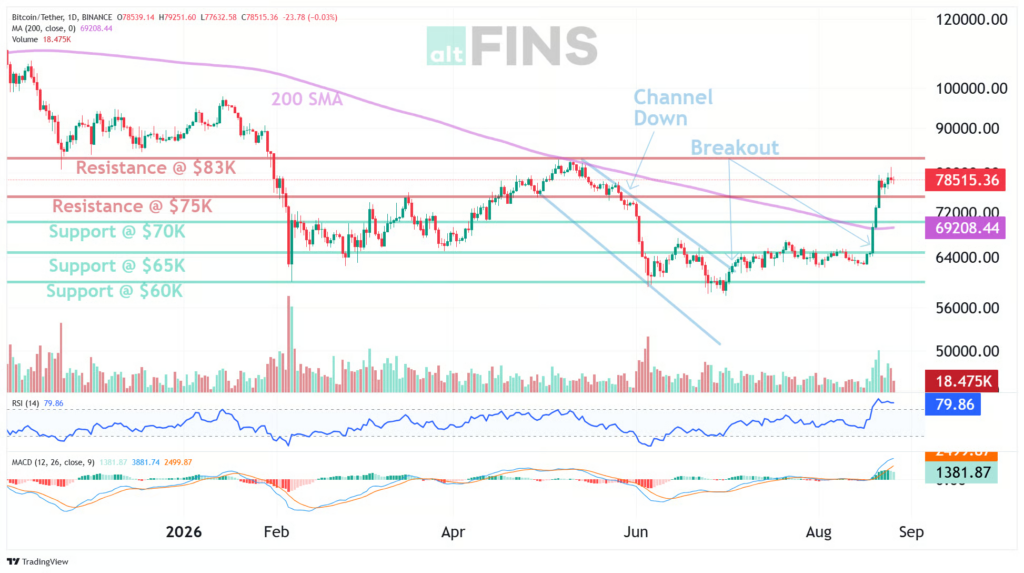
Bitcoin opened August 21 at $73,027 and traded near $78,810 early Thursday, a 7.92% gain across the seven-day window. Friday established the move with a 7.27% advance, a $5,311 increase from open to close, and $3.40 billion in quoted US-dollar volume. The weekend then held: Saturday lost 1.61%, Sunday recovered 0.86%, and Monday added 1.62% before Tuesday reached the weekly high at $81,273. Sellers defended $80,000 on the close, yet the next session still finished at $79,024. The full $8,246 high-to-low span equalled 11.29% of the opening price. That is a wide weekly range, but its shape matters. Most of the Friday impulse survived five later sessions, and no daily low returned to the $73,027 starting point. Thursday’s candle remained open when the data were collected, so its small decline carried little evidentiary weight.
Source: https://altfins.com/technical-analysis
The breakout repaired several layers of the chart at once. Bitcoin cleared the $65,000 ceiling that rejected earlier attempts, pushed through $70,000 and moved 13.80% above its 200-day simple moving average at $69,254. Price also sat 13.11% above the 20-day average and 18.61% above the 50-day average, evidence that the advance is broader than a one-session spike. The shorter averages show where the first pressure should appear: spot was only 0.24% above the five-day average at $78,620, but 4.30% above the ten-day average at $75,560. A shallow consolidation can therefore occur without damaging the trend. The former $65,000 to $70,000 resistance band is now the structural pullback zone, with $73,027 adding a nearer weekly reference. AltFins marks $83,000 as the next resistance, almost level with the upper Bollinger Band at $83,225.
Momentum has moved past strong and into crowded. RSI-14 sits at 87.5, RSI-9 at 89.2 and RSI-25 at 81.6, so the stretch extends across several lookback periods. The stochastic reading of 86.9 places price near the top of its recent range. MACD remains bullish at 4,026 against a 2,812 signal line, while the 1,215 histogram confirms positive momentum; AltFins’ declining histogram bars show that the acceleration is easing even though direction remains up. ATR-14 at $2,511 means a routine one-day move now covers about 3.2% of spot. The $4,415 gap from $78,810 to the upper Bollinger Band is less than two ATRs, putting $83,000 within ordinary volatility. The same arithmetic works in reverse. A two-ATR retreat reaches roughly $73,800 without breaking the weekly structure. Overbought conditions raise the cost of chasing. They do not set a reversal date.
Source: https://sosovalue.com/assets/etf/us-btc-spot
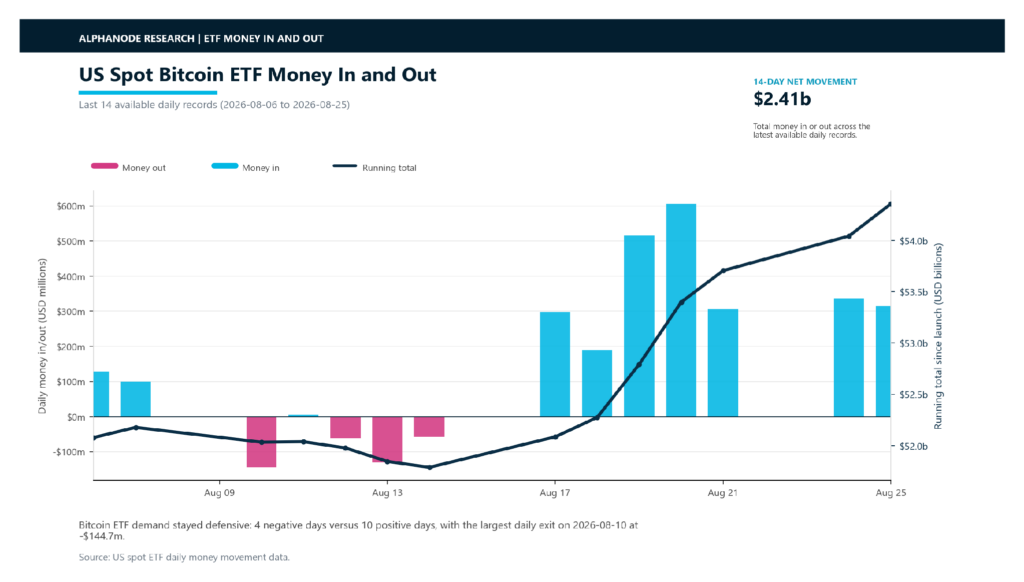
US spot Bitcoin ETFs supplied persistent cash demand through the latest settled session. The funds added $2.08 billion from August 19 through August 25: $517.2 million, $606.3 million, $307.5 million, $337.6 million and $314.4 million on five consecutive trading days. That sequence matters more than the largest print because it shows buyers returning at higher prices rather than waiting for a pullback. Across the full 14-session dataset, Bitcoin funds drew $2.41 billion with ten positive days and four negative days. The latest five sessions delivered about 86% of that net total. Net assets rose from $84.31 billion on August 19 to $99.05 billion on August 25, while cumulative net inflows reached $54.36 billion. Asset growth includes Bitcoin’s appreciation, so it cannot be read as subscriptions alone. The daily flow series isolates the cash component, and that component stayed positive throughout the breakout.
Friday’s $6.4 billion options expiry arrives after a 30-day advance of 23.3% and a weekly test above $80,000. Large expiries concentrate hedging decisions around strike prices: a move through a heavily populated call strike can force dealers to buy spot or futures, while a decline through put-heavy levels can push hedges the other way. The market is entering that event with RSI above 87 and a two-day failure to close above $80,000, so positioning can dominate the tape for several hours. The decision tree is clean. A daily close above $83,000 would clear chart resistance and the upper band together, opening room toward the next untested area. A retreat toward $75,500 would revisit the ten-day average. A close below $70,000 would break the reclaimed resistance zone and force a broader reassessment of the breakout.
July PCE inflation reached 3.7% year on year, with core inflation at 3.3% and real consumer spending flat for the month. Bitcoin absorbed the release without surrendering its weekly gains, which strengthens the case that ETF demand and position adjustment drove the move. The macro setting remains restrictive. Sticky inflation limits the speed of rate cuts, and a higher cash yield raises the hurdle for assets that do not distribute income. Bitcoin has overcome that hurdle for one week because regulated funds kept buying and short exposure was forced out during the advance. That support is measurable. It is also narrower than a rally backed by falling inflation, easier policy and improving growth together. The next phase depends on whether spot buyers continue after the options reset and whether $80,000 changes from a profit-taking level into a base.
Ethereum Market Analysis
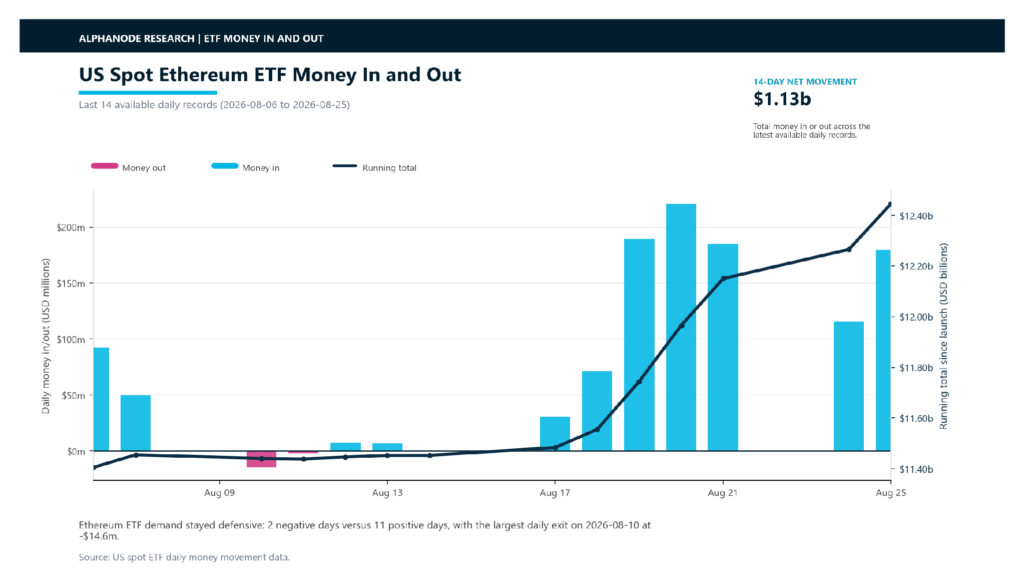
ETF demand gave Ether the cleaner accumulation pattern. US spot funds recorded $890.3 million of net inflows across the five settled sessions from August 19 through August 25, every session positive: $189.2 million, $220.8 million, $184.9 million, $115.6 million and $179.8 million. The distribution is steadier than a single headline day and shows buyers continuing after price jumped on August 21. Across the complete 14-session window, Ether funds added $1.13 billion with eleven positive days, two negative days and one flat session. The latest five trading days supplied nearly four-fifths of that total. Net assets climbed from $12.06 billion to $14.88 billion over those sessions, and cumulative net inflows reached $12.45 billion. The ETF base is smaller than Bitcoin’s, so $890.3 million carries more weight relative to the $14.88 billion asset pool and creates a stronger marginal demand signal.
Source: https://altfins.com/technical-analysis
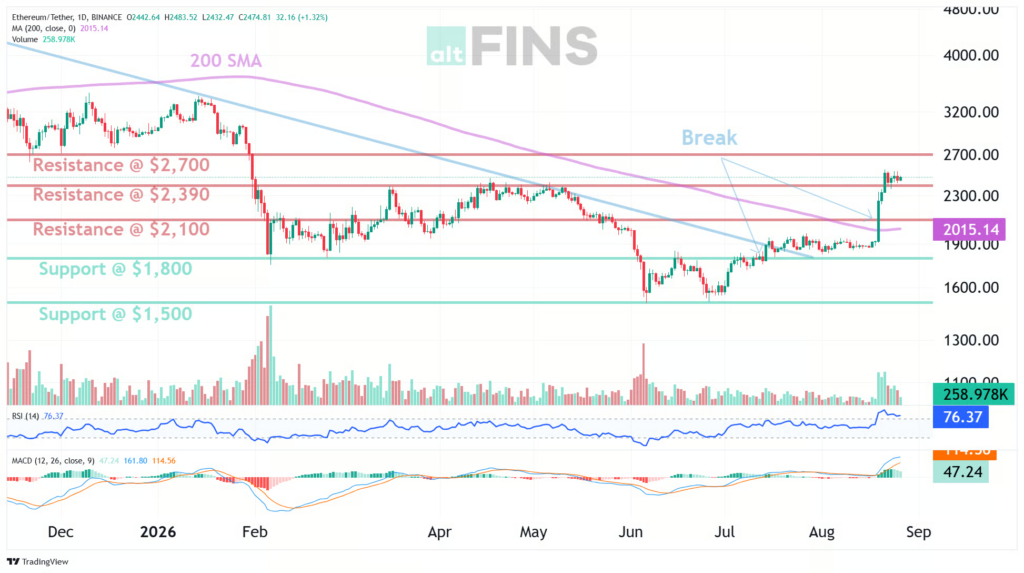
Price confirmed the fund-flow signal, though almost all of the weekly gain arrived at the start. Ether opened August 21 at $2,327, surged 8.14% and closed at $2,516 after touching $2,547. Saturday gave back 3.72%, yet its $2,385 low stayed well above the prior opening level. Sunday and Monday rebuilt the position, Tuesday slipped 1.60%, and Wednesday added 2.63% to close at $2,507. Early Thursday trading near $2,496 left the seven-day gain at 7.26%. The $222 span between the weekly low of $2,325 and high of $2,547 equalled 9.54% of the opening price, smaller than Bitcoin’s proportional range. Ether therefore produced a similar weekly return with less total travel. Repeated failures to close above $2,500 still mark an active supply pocket, but sellers have not reversed the August 21 repricing.
The chart completed a deeper repair than the weekly percentage implies. Ether broke its descending trendline and moved 23.72% above the 200-day simple moving average at $2,017. Price also stands 16.81% above the 20-day average and 26.14% above the 50-day average, confirming a reversal while showing rapid separation from the mean. The five-day average at $2,478 is almost level with spot, making it the first short-term balance point. The ten-day average at $2,383 sits near Saturday’s pullback low. Beneath it, the $2,000 to $2,100 breakout zone contains the 100-day and 200-day averages. AltFins’ longer-range supports remain $1,500 and $1,400.
Source: https://sosovalue.com/assets/etf/us-eth-spot
Momentum is stretched across every major oscillator. RSI-9 is 83.3, RSI-14 is 83.1 and RSI-25 is 78.5, while the stochastic position at 92.5 puts Ether close to the top of its 14-day range. MACD remains bullish at 167.6 against a 125.6 signal line, leaving a positive 42.0 histogram. ATR-14 is $109, or about 4.4% of spot, so one routine daily range can carry price back toward $2,387 or up toward $2,605. The upper Bollinger Band at $2,688 sits less than two ATRs above the current price; the lower band at $1,585 reflects how fast volatility expanded during the monthly advance. Ether has gained 29.84% in one month and 23.89% over three months. The trend is intact, but the risk-reward has changed. Fresh buyers are paying for confirmation after most moving averages have already been reclaimed.
Ether slightly lagged Bitcoin despite the stronger relative ETF impulse. ETH gained 7.26% against Bitcoin’s 7.92%, and the ETH/BTC ratio slipped from roughly 0.03187 at the opening prices to 0.03167 at the latest marks. That 0.6% relative decline is small, yet it shows the rally remained led by Bitcoin even while Ether funds absorbed a larger share of their own asset base. LayerZero’s ATLAS launch adds pressure at the infrastructure layer. ATLAS promises 200,000 transactions per second at launch for matching, clearing and settlement, functions Ethereum has usually left to applications, exchanges and rollups. Ethereum still owns deep stablecoin liquidity, broad collateral use and a large developer base. Competitors are moving above raw blockspace into the exchange stack where order flow and fees accumulate. Ether’s investment case increasingly depends on how much of that activity remains economically connected to the base network.
The SEC’s custody rewrite reached White House review as Ether ETFs logged five straight inflow sessions. The rule matters beyond safekeeping. Investment advisers need clarity on qualified custodians, control of private keys, recordkeeping and the treatment of assets used in network functions before they can allocate at scale. Ether already has a regulated spot wrapper, but native staking and onchain collateral use create operational questions that a plain Bitcoin holding does not. A workable custody framework could widen the adviser channel and let service providers compete on security and execution. A restrictive definition could concentrate assets among a small group of firms and keep staking outside many portfolios. White House review is only a procedural step before publication and comment. The current inflow streak shows demand under today’s rules; the custody proposal will shape how broad that demand can become.
Faster Deposits Could Make Credit More Expensive
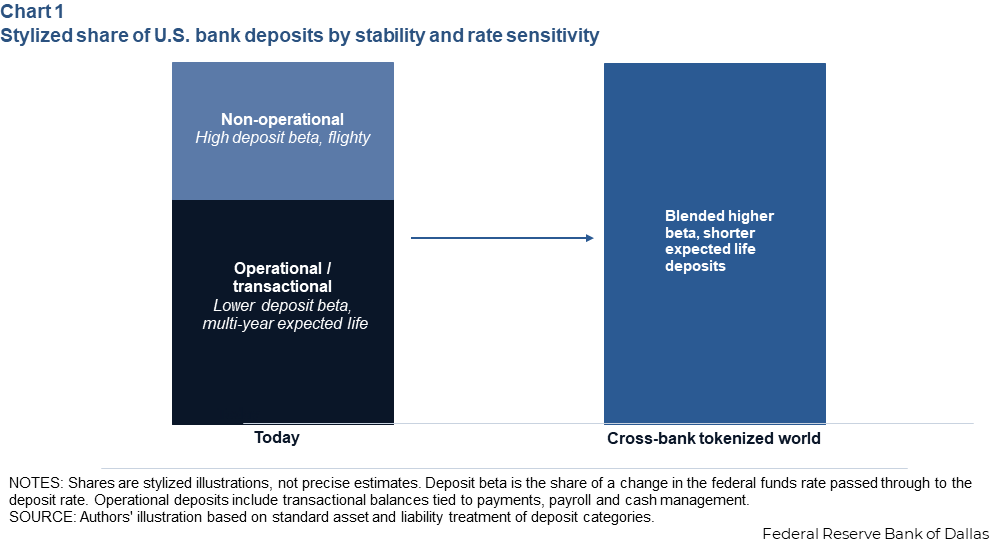
The Dallas Fed put a price on one of tokenization’s least discussed trade-offs. If cross-bank tokenized deposits let customers and software agents move cash instantly toward the highest yield, deposits become shorter-lived and more sensitive to interest rates. A 10% increase in deposit rate sensitivity would reduce banks’ appetite for duration risk by an estimated $700 billion in ten-year-equivalent terms.
Source: https://www.dallasfed.org/research/economics/2026/0825
Long-lived, low-cost deposits let banks fund mortgages and business loans without matching every asset with expensive term debt. Tokenization weakens that advantage if operational balances turn into mobile cash. Banks could preserve the same loan book by issuing more wholesale debt, but borrowers would pay for the higher funding cost.
Brazil’s Pix system offers an early warning from outside crypto. The Dallas Fed cites research linking heavier instant-payment use with larger holdings of liquid government bonds and less credit intermediation. Tokenized deposits may improve settlement and programmable payments. Their fastest feature also changes what a deposit is worth to a bank.
Tax Reporting Sees Only the Easy Part
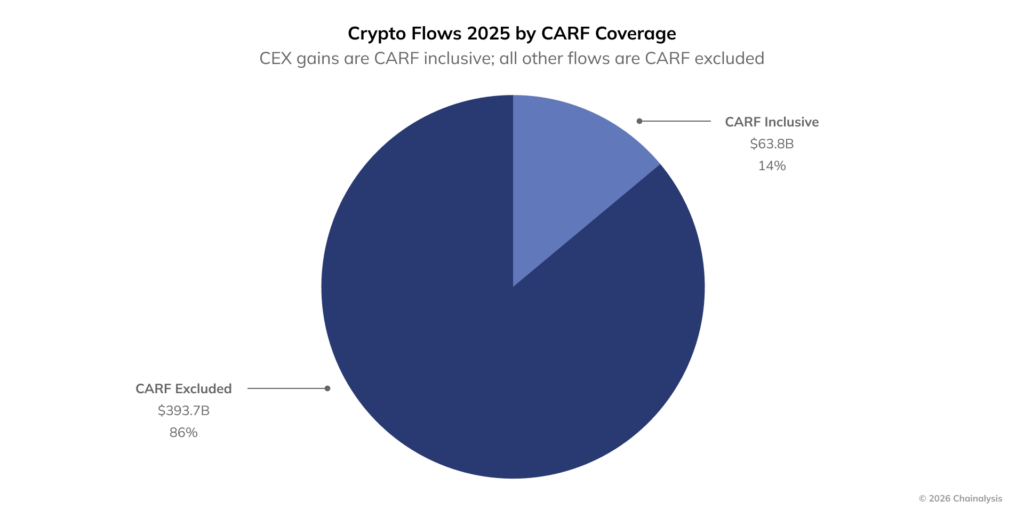
Chainalysis estimates that at least $457 billion in onchain activity created potential tax consequences during 2025. The United States led individual countries at roughly $112.6 billion, followed by large totals across Europe and East Asia. The estimate excludes centralized-exchange activity and several blockchains, so it is a floor rather than a complete tax base.
Source: https://www.chainalysis.com/blog/crypto-tax-reporting-carf/
CARF is built around service providers that already know their customers. In Chainalysis’ model, that captures $63.8 billion of centralized-exchange gains, just 14% of the measured total. The remaining $393.7 billion runs through decentralized exchanges, self-custody, peer-to-peer transfers, mining, staking, lending and payments that CARF does not directly observe.
Reporting therefore gets the cleanest records first. The harder work sits onchain, where cost basis can cross wallets, protocols and jurisdictions before an asset is sold. CARF will expand the information tax authorities receive when exchanges begin sharing data, but it will also expose how much context is missing from each isolated report.
Mark Your Calendars
Economic Data Releases:
- September 1, 2026 (Tuesday): US job openings for July, ISM Manufacturing PMI for August and construction spending for July.
- September 2, 2026 (Wednesday): US manufacturers’ shipments, inventories and orders for July.
- September 3, 2026 (Thursday): US international trade for July and revised second-quarter productivity and costs.
Token Unlock
- September 1, 2026 (Tuesday): Sui (SUI) unlocks US$10.18 M (0.33% of released supply).
- September 5, 2026 (Saturday): Ethena (ENA) unlocks US$25.05 M (1.92% of released supply).
- September 6, 2026 (Sunday): Hyperliquid (HYPE) has a US$806.13 M scheduled unlock ceiling (2.37% of released supply); the actual claimed amount may be lower.