Cross-Asset Rout or Just the 4-Year Cycle?
Over the few weeks, Bitcoin and Ethereum fell hard, and they did it alongside stocks, tech, and even assets that usually catch a bid when fear hits. Bitcoin dropped from the mid-$80,000s in mid-January to briefly below $64,000 on Feb 5, roughly a 50% slide from its $126,000 peak in October 2025. Ethereum followed with high double-digit losses, breaking below $4,000 after topping $7,000 last fall, per exchange data. The timing sits near the familiar “post-halving hangover” window, but the feel of the move was broader than crypto, it looked like a risk-off wave rolling through everything.
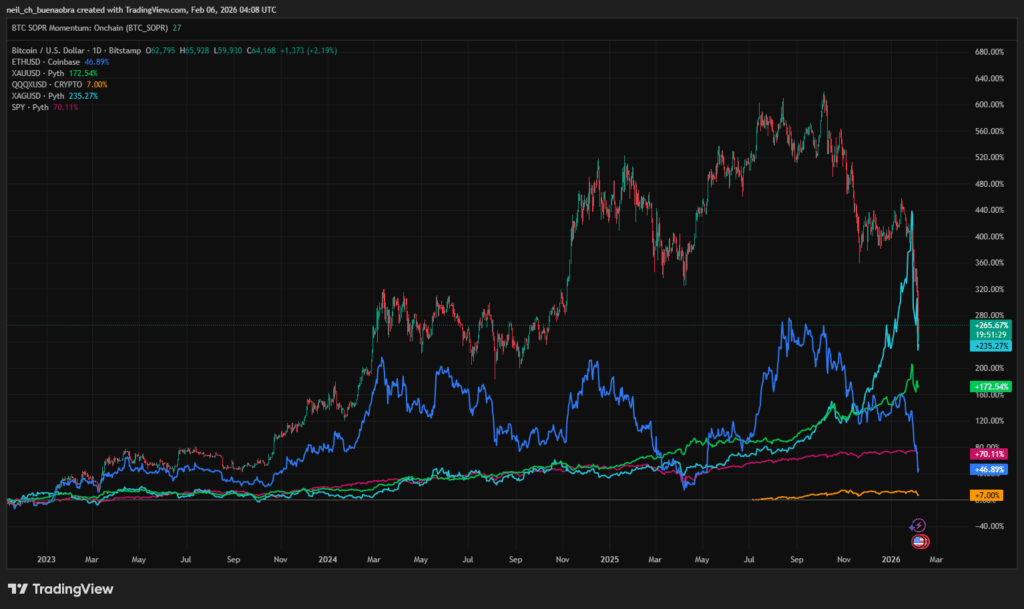
Bitcoin (BTC) and Ethereum (ETH) vs Macro Assets, Cumulative Return (%) Since 2023
Source: https://www.tradingview.com/chart/2siDZm6r/?symbol=OANDA%3AXAUUSD
The thread that ties the window together is liquidity and positioning, not a neat cycle script. The claim here is that crypto weakness was linked to broad risk-off sentiment across markets, with the pressure coming from policy headlines and a tech shock, rather than a clean halving rhythm. That matters because it changes what you blame: this looks less like a crypto-only excess getting wrung out, and more like a market-wide pullback where correlations tighten and the highest beta stuff gets hit first. The text points to late-January acceleration alongside the Fed leadership story (Trump nominating Kevin Warsh, seen as hawkish) and the tech break (Microsoft’s Azure growth disappointment spooking investors). If crypto is trading as part of the same risk bucket as AI-heavy equities, it does not need its own internal trigger to fall fast.
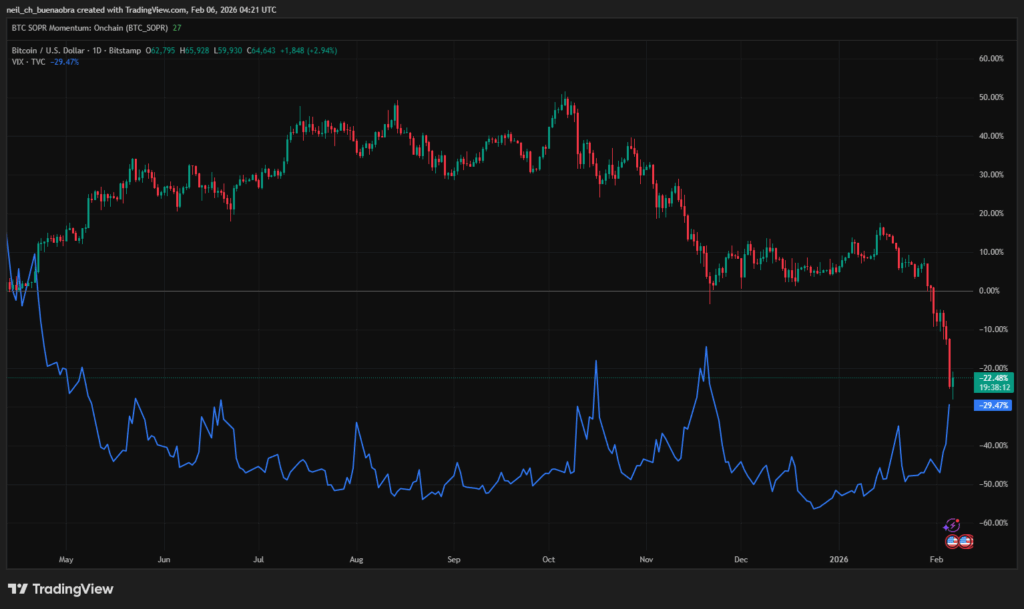
Bitcoin and Volatility (VIX)
Where Did the Money Go?
When everything is down at the same time, “rotation” is usually the wrong mental model. The picture painted here is simple: money moved toward cash and Treasuries, and a chunk of it just stepped back. Inside crypto, there was no broad “Bitcoin into alts” shift; the stablecoin data is used to argue that some capital exited entirely. The stablecoin market cap is cited at $310.4 billion on Jan 16, 2026, then down by roughly $6 billion over the next two weeks, drifting from around $311 billion in mid-January to about $305 billion by Feb 1. Binance’s USD balances are described as falling over the same stretch, which fits the idea of liquidity leaving exchanges rather than hiding on-platform.
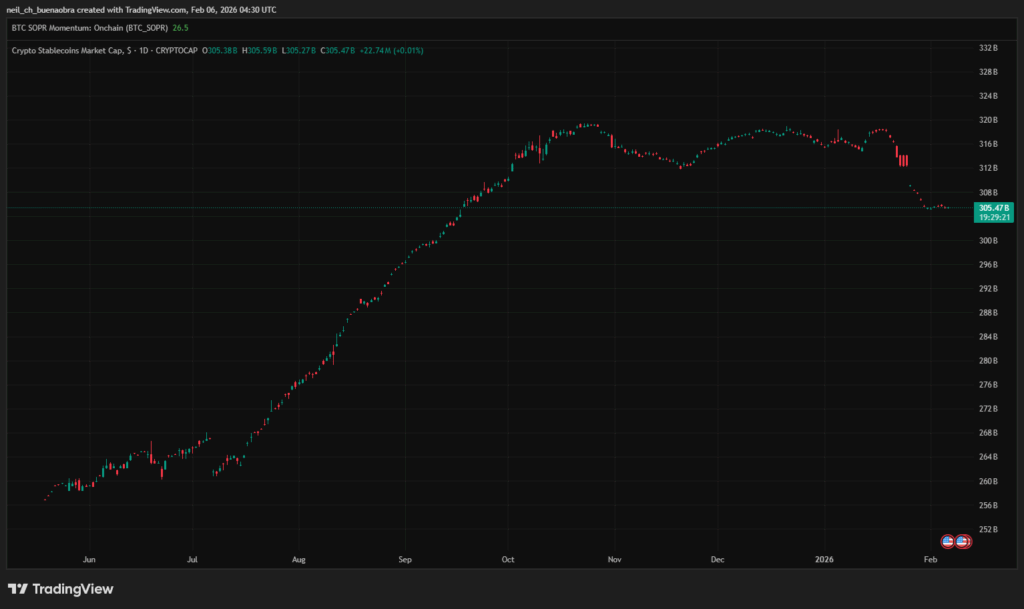
Total Stablecoin Marketcap
Source: https://www.tradingview.com/chart/2siDZm6r/?symbol=CRYPTOCAP%3ASTABLE.C.D
In traditional markets, the classic safety bid shows up in rates: on Feb 5, as risk assets hit fresh lows, the 10-year Treasury yield is cited falling to 4.19% from 4.29% the day prior. The dollar story is mixed but still risk-off flavored: DXY is described as having been weak into late January, then rebounding about 1.4% into early February as fear rose and policy expectations shifted. Crypto ETF flows underline the same point. Spot Bitcoin ETFs are described as bleeding assets most days, including about $272 million of net redemptions on Feb 3, pushing AUM below $100 billion for the first time since April 2025, then sitting around $97 billion by Feb 4 versus about $168 billion at the October peak. On the margin, Ether ETFs and XRP products are described as seeing small inflows on Feb 3, but the amounts are tiny next to the Bitcoin exit. In derivatives, the “money went nowhere” in the bluntest way: roughly $2.5 to $2.7 billion in long liquidations is cited into Feb 5, forced exits that show leverage being cleared, not reallocated.
Macro, Geopolitics, Policy, Signals, and Noise
This window threw a lot of headlines at the tape, but only a few line up with the moments when selling intensified. The policy narrative was the loudest: the Fed is described as holding rates steady at 3.50% to 3.75% on Jan 28, then attention shifting to leadership, with Trump naming Kevin Warsh as nominee on Feb 3. The argument is straightforward: a more hawkish chair implies a tighter stance, higher discount rates, and less tolerance for high-volatility assets. That is exactly the environment where tech and crypto tend to get treated the same way: cut exposure first, ask questions later.
The tech shock is treated as the other main driver. Microsoft’s Jan 28 earnings are described as an inflection point because the Azure growth commentary hit a market that was already priced for perfection, and the stock drop is cited around 12% on Jan 29. Then AMD is described as piling on, with guidance and AI-chip doubts leading to a 17% drop when markets opened Feb 4, its worst one-day fall since 2017. Qualcomm and Alphabet are mentioned as contributing to the broader AI wobble. The takeaway is not that crypto “copied” stocks, it is that both were responding to the same thing: crowded positioning in risk, thin liquidity, and a sudden change in what investors were willing to pay for growth.
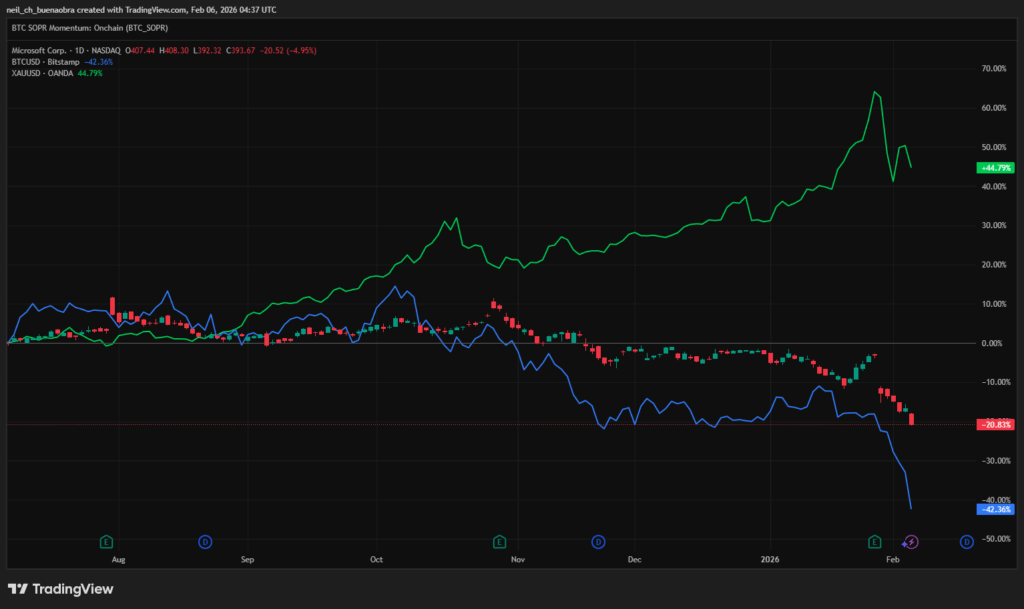
Microsoft (MSFT), earnings shock window and how BTC and Gold reacted
Source: https://www.tradingview.com/chart/2siDZm6r/?symbol=NASDAQ%3AMSFT
Gold and silver add a useful detail because they show stress, not safety, by the end. The text cites gold peaking at $5,594 per ounce and silver at $121.64 per ounce by Jan 29, then snapping lower, including a 5% intraday drop in gold on Jan 29 and a deeper slide to about 4,450 by Feb 2, with silver down nearly 40% from its peak. The argument is that when a crowded “safe” trade breaks violently, it can force selling elsewhere through margin and liquidity needs, which fits the broader deleveraging theme. On the other hand, the write-up treats most crypto-regulatory chatter in this window as background, because it did not map to a specific, confirmed event that would explain the timing of the sell-off.
Institutional Adoption Rising, So Why the Crash?
The point here is not that adoption stalled, it is that adoption does not act like a price floor. The text cites the growth of spot Bitcoin ETFs since 2024, reaching over $160 billion AUM by late 2025, and still sitting around $97 billion after outflows. It also highlights product development like a covered-call “Premium Income” style Bitcoin ETF filing, plus examples of institutions moving coins through venues like Coinbase Prime. The logic that follows is practical: institutions have risk budgets, and they reduce exposure when volatility spikes and correlations tighten, even if the long-term thesis is unchanged. In this framing, the crash is less about “belief” and more about mechanics: rebalancing, volatility targeting, and forced de-risking when the tape turns hostile.
Sentiment and the Flush
By Feb 5, the write-up argues conditions looked like capitulation. The Crypto Fear and Greed Index is cited at 9 out of 100 on Feb 5, described as the lowest since June 2022. It also points to negative funding, collapsing open interest, and large liquidations as signs leverage had been cleared, not gently unwound. Price action is used as supporting context: Bitcoin is described wicking down near near $60,000 on Feb 5 then rebounding above above $65,000. That does not prove a durable bottom, but it does fit the “forced selling then snapback” pattern.
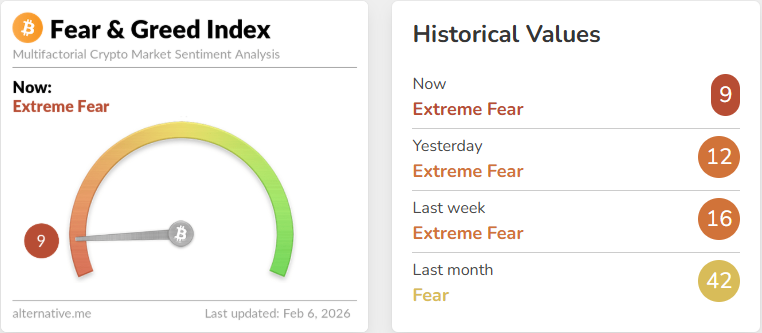
Crypto Fear and Greed Index
Source: https://alternative.me/crypto/fear-and-greed-index/
The caution is also clear: extreme fear can stick around, and flows matter more than vibes. ETF outflows are described as continuing even as prices tried to stabilise around Feb 3 to Feb 4. The piece suggests watching whether fund flows stabilise, whether stablecoin market cap stops shrinking, and whether funding and volatility normalise. Those are the tells for whether the market is simply catching its breath or shifting into a longer reset.
Even after a drawdown that pushed sentiment to extremes, the adoption arc has not been reversing, it has been widening. The milestones below are a reminder that this cycle’s plumbing is deeper than prior cycles, with regulation moving from vague enforcement to written frameworks, access shifting from offshore venues to regulated products, and utility expanding through stablecoin rails that major payments and financial firms are willing to support. That does not prevent sharp sell-offs, but it changes what those sell-offs mean, because the underlying system keeps gaining distribution even when risk appetite temporarily disappears.
| Date | Milestone |
| June 29, 2023 | The EU’s Markets in Crypto-Assets Regulation (MiCA) entered into force. |
| December 15, 2023 | The FASB issued ASU 2023-08, introducing fair value accounting for eligible crypto assets (effective for fiscal years starting after December 15, 2024). |
| January 10, 2024 | The U.S. SEC approved the listing and trading of spot Bitcoin exchange-traded products. |
| January 11, 2024 | U.S. spot Bitcoin ETFs began trading, bringing regulated BTC access to mainstream brokerage channels. |
| April 15, 2024 | Hong Kong regulators granted initial approval for spot Bitcoin and Ether ETF products. |
| April 30, 2024 | Spot Bitcoin and Ether ETFs began trading in Hong Kong. |
| May 22, 2024 | The U.S. House of Representatives passed FIT21 (H.R. 4763). |
| May 23, 2024 | The SEC approved exchange rule changes that enabled spot Ether ETF listings. |
| June 30, 2024 | MiCA’s stablecoin framework began applying in the EU. |
| July 23, 2024 | U.S. spot Ether ETFs began trading. |
| November 21, 2024 | Total assets in U.S. spot Bitcoin ETFs surpassed $100,000,000,000. |
| January 23, 2025 | The SEC issued SAB 122, rescinding SAB 121 (effective January 30, 2025). |
| February 4, 2025 | Stripe completed its acquisition of stablecoin platform Bridge. |
| April 1, 2025 | Circle filed a public registration statement with the SEC for an IPO. |
| June 4, 2025 | Circle announced pricing of an upsized IPO and stated its registration statement was declared effective. |
| June 11, 2025 | PayPal announced plans to expand PYUSD to Stellar, subject to regulatory approval. |
| July 17, 2025 | PayPal expanded PYUSD to Arbitrum. |
| July 18, 2025 | The White House published a fact sheet stating the President signed the GENIUS Act into law. |
| October 21, 2025 | CME reported a record count of large open interest holders for crypto products. |
| December 16, 2025 | Visa announced stablecoin settlement for U.S. institutions. |
| February 6, 2026 | Total stablecoin market capitalisation was about $306,000,000,000 on a point-in-time dashboard reading. |
Taken together, the table supports a simple interpretation of the prior section, the flush can be violent and still be consistent with a market that is structurally maturing. In this window, price was driven by cross-asset de-risking, leverage compression, and macro uncertainty, while the longer-dated adoption pathway continued to compound in the background. The practical implication is not a price call, it is a framing, short-term positioning and liquidity conditions can reset quickly, but the institutional rails, regulatory recognition, and payment utility that shape medium-term demand have been building through 2023 to 2026 and remain the main reason the market keeps reloading after fear peaks.
Wrap-up
This drawdown was sharp, but the evidence in this note points to a cross-asset de-risking episode rather than a crypto-specific break in fundamentals. Correlations tightened, liquidity thinned, and leverage was forced out, which is the kind of setup that can hit BTC and ETH hard even without a single “crypto headline” driving the move. In that sense, the sell-off reads more like a reset in positioning and risk budgets than a reversal in long-term adoption.
The constructive part is that the underlying rails kept compounding in the background. Regulated access via spot ETFs remains a large, functioning channel, institutional execution and custody workflows continue to be used, and product development did not pause simply because prices fell. The same plumbing that made flows larger on the way up also makes exits faster during stress, but the existence and continued use of these channels is a structural positive that prior cycles did not have at the same scale.
Going forward, the most useful tells are still measurable. Stabilisation looks more like flows steadying, stablecoin supply flattening, and derivatives stress normalising, not a single day of price relief. If those indicators begin to heal, it supports the interpretation that this was a violent, but ultimately mechanical flush inside a market that is still maturing and widening its distribution.