Bitcoin Breaks the Oil Shock
7th May 2026 • 8 mins read
This Week’s Recap
- Bitcoin rips past $82,000 as shorts liquidated: A pause in military operations near the Strait of Hormuz helped send oil lower, and Bitcoin used the relief to clear the $82,000 area. More than $200 million of short positions were reportedly liquidated as the move accelerated.
- Bitcoin faces $80,000 resistance as derivatives show risk aversion: Early in the week, derivatives markets showed traders hedging and taking profits around $80,000. That made the later break above the level more important, because it came after a visible seller test.
- Bitcoin edges above $77,000 while institutional activity suggests downside hedging: The first recovery leg was cautious, with Bitcoin trading near $77,000 while options and ETF activity pointed to defensive positioning. The setup made the $80,000 area the week’s first real barrier.
- Bitcoin ETFs draw $2 billion in April: April flows gave the week a stronger base, with spot Bitcoin ETFs pulling in about $2 billion for their best month of the year. Late-week daily flow data then reinforced that institutional demand had not disappeared during the oil shock.
- Spot Bitcoin ETFs add about $467 million in the latest daily snapshot: The latest flow table showed roughly $467 million of net inflows, about $2.6 billion of trading value, and total net assets near $109 billion. Cumulative net inflow rose to about $59.7 billion.
- Strategy reports a $12.7 billion Q1 loss: Strategy reported a large paper loss tied to digital asset markdowns while still holding 818,334 BTC. The filing kept the corporate treasury trade under scrutiny just as Bitcoin was trying to rebuild momentum.
- Strategy pauses Bitcoin buys before earnings: Michael Saylor confirmed the firm did not buy Bitcoin in the week before earnings, despite raising $82 million. The pause stood out because investors have treated Strategy’s accumulation cadence as a live demand signal.
- CME to launch regulated Bitcoin volatility futures: CME’s planned June 1 launch gives institutions a listed way to trade Bitcoin volatility. That matters in a week when oil, rates, and short liquidations all pushed volatility back into the center of the market.
- Morgan Stanley brings crypto trading to E*Trade: Morgan Stanley is rolling out retail crypto trading through E*Trade with lower fees than several rivals. The move puts a major wealth platform more directly into spot crypto access.
- CLARITY Act markup could come next week after stablecoin deal breakthrough: A compromise on stablecoin rewards moved the bill toward a possible committee vote as soon as the week of May 11. The deal would ban passive yield on idle stablecoin balances.
- Banking lobby attempts to stall the CLARITY Act: Trade groups pushed back against the stablecoin provisions, arguing they could reduce loan capital by as much as 20%. The fight shows why the stablecoin debate is now a banking debate too.
- Meta rolls out USDC payouts for creators: Meta started USDC payouts on Solana and Polygon for creators in the Philippines and Colombia. The launch turns stablecoins into a creator-payment tool instead of a trading-only asset.
- Visa stablecoin settlement reaches a $7 billion run rate: Visa expanded its stablecoin settlement pilot to nine blockchains, with annualized volume reported near $7 billion. The number is still small relative to Visa’s card network, but the direction is clear.
- Western Union launches USDPT on Solana: Western Union’s Solana-based stablecoin is aimed at 24/7 settlement across its agent network. Coverage framed the first rollout around Bolivia and the Philippines, where remittance utility is easy to understand.
- Anchorage Digital and M0 team up for stablecoin issuance: Anchorage and M0 announced a partnership to support regulated stablecoin issuance in the United States. It adds another bank-grade custody and issuance route to the stablecoin stack.
- Brazil central bank bans stablecoin settlement in cross-border payments: Brazil restricted fintechs and payment firms from using stablecoins or crypto for regulated cross-border settlement. The move is a reminder that payment adoption will move at different speeds by jurisdiction.
- Bullish to acquire transfer agent Equiniti for $4.2 billion: Bullish agreed to buy Equiniti to build tokenized securities infrastructure. The target’s transfer-agent role gives the deal a practical link to cap tables, fund records, and regulated asset servicing.
- DTCC plans October launch for tokenized securities: DTCC is targeting a July pilot and October launch for tokenized securities infrastructure. The clearing giant already sits near the center of traditional settlement, so even a limited rollout matters.
- Standard Chartered takes stake in GSR at a $1 billion valuation: Standard Chartered’s venture arm became the first outside shareholder in GSR. The deal ties bank capital to market-making infrastructure at a time when tokenisation demand is broadening.
- Coinbase asset manager launches tokenized stablecoin credit fund: Coinbase’s asset-management arm launched CUSHY, a credit fund with a tokenized share class. The product targets institutional yield from onchain lending.
- Ethereum Foundation finalizes sale of 10,000 ETH to BitMine: The foundation completed an OTC sale to BitMine as part of its treasury strategy. The deal also reinforced BitMine’s position as the loudest corporate ETH buyer of the week.
- BitMine reaches 86% of its 5% ETH supply goal: BitMine reportedly held 5.18 million ETH as it pursued a corporate Ethereum treasury strategy. The firm has made staking income part of the story alongside balance-sheet exposure.
- Ethereum holders move back into profit as price targets $3,000: Coverage said Ethereum holders had moved back into profit as ETH worked toward a possible $3,000 target. The setup still depended on reclaiming resistance above the current range.
- Aave fights to protect $71 million in recovered ETH: Aave filed an emergency motion to prevent creditors from seizing recovered ETH intended for exploit victims. The dispute shows how legal process can collide with recovery plans after hacks.
- Drift outlines plan for $295 million exploit recovery: Drift proposed tokenized claims and a revenue-backed pool for affected users. The plan follows one of the year’s largest exploit headlines.
- North Korean hackers account for 76% of crypto exploit losses this year: TRM-linked coverage said North Korean actors drove most crypto exploit losses in 2026. The figure kept security risk near the top of the weekly narrative.
- Coinbase cuts 14% of staff in AI pivot: Coinbase cut about 700 roles as it reorganized around AI-native teams and a flatter structure. The move shows how public crypto companies are trying to protect margins while trading conditions remain uneven.
- MARA Holdings to buy Long Ridge Energy in $1.5 billion AI data center push: MARA’s deal includes a 505 MW gas plant tied to AI and IT infrastructure plans. The acquisition pushes the miner further into power and compute monetisation.
- Hut 8 shares jump on a $9.8 billion AI lease: Hut 8’s Texas data center contract lifted the stock sharply, with options that could take total value to $25 billion. Miner equities are being repriced around power assets as much as Bitcoin production.
- Zcash liquidations surge as ZEC rallies 30%: ZEC short liquidations reached $46.7 million after a position disclosure from Multicoin Capital. It was one of the clearest examples of single-token positioning stress outside Bitcoin.
Bitcoin Market Analysis
Bitcoin’s week changed character at the $80,000 line. The asset had spent the early part of the window fighting a seller zone near that level, with macro pressure from oil and Treasury yields keeping traders defensive. By the latest technical snapshot, BTC was near $80,862, down modestly on the day but up 6.69% over one week and 17.41% over one month. The daily range shown ran from about $80,727 to $82,841, which put price just below the upper Bollinger Band near $81,510 and close enough to make the breakout attempt feel live rather than theoretical.
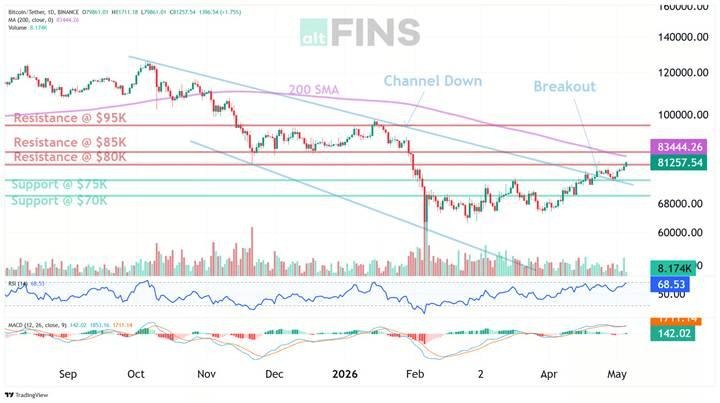
Source: https://altfins.com/technical-analysis
The trend stack improved in a way that was missing from several old reports. Short-term trend was marked Strong Up, medium-term trend was Up, and long-term trend was still Neutral. MACD had crossed above its signal line 27 days earlier, and RSI readings were neutral rather than overheated. That combination leaves Bitcoin in a healthier place than the late-January and February downtrend reports, but it also explains why the market is still arguing over confirmation. Momentum has turned. The longer trend has not fully followed.
The map is clean. Support sits at $75,000 first, then $70,000. Resistance sits at $85,000, then $95,000. The $75,000 zone matters because it was already tested after the prior channel-down breakout, and buyers held it. The $80,000 reclaim matters because it turned a defensive range into a continuation attempt. A daily close above $85,000 would give the move a stronger target toward $95,000, while a failed hold above $80,000 would pull attention back to the $75,000 floor.
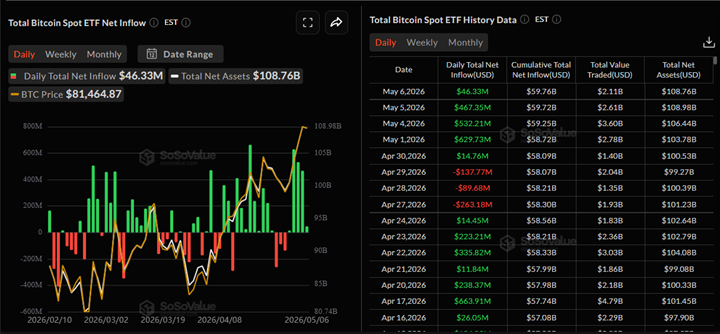
Source: https://sosovalue.com/assets/etf/us-btc-spot
Spot Bitcoin ETF demand strengthened into the end of the week. The latest SoSoValue snapshot showed about $467 million of net inflows, around $2.6 billion of value traded, total net assets near $109 billion, and cumulative net inflow near $59.7 billion. Earlier snapshots were choppier, including a negative day near $138 million and later inflow days above $500 million and $600 million. The tape ended in better shape than it began.
The corporate side was less comfortable. Strategy reported a $12.7 billion Q1 loss tied to unrealised digital asset markdowns while still holding 818,334 BTC, and Saylor paused Bitcoin purchases before earnings. That does not remove the treasury bid. It makes the bid easier to question when balance-sheet volatility hits earnings and preferred-stock obligations.
The better Bitcoin story came from access and risk-transfer rails. Morgan Stanley is bringing crypto trading to E*Trade, and CME plans Bitcoin volatility futures for June 1. Those are not price targets. They are signs that the market is building better ways for traditional users to buy, hedge, and trade the asset. Bitcoin still needs to hold $82,000 to $83,000. The rails around it keep getting thicker.
Ethereum Market Analysis
Ethereum’s strongest weekly story was not the chart. It was the corporate ETH treasury and staking lane. The Ethereum Foundation sold 10,000 ETH to BitMine, and BitMine reportedly moved closer to its 5% supply goal. That gave ETH a cleaner institutional narrative than it had in prior weeks, when price action and ETF outflows were doing most of the talking.
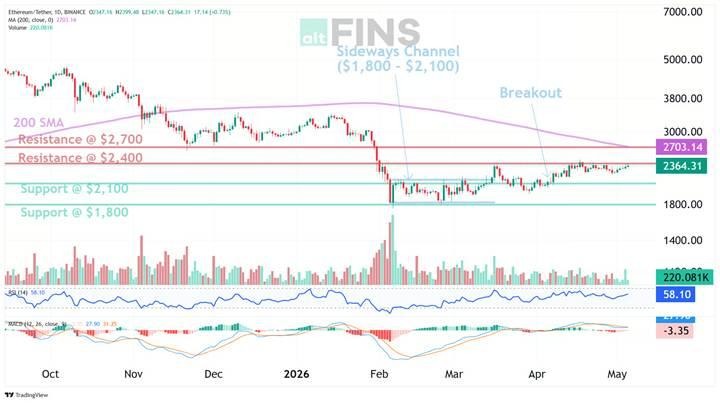
Source: https://altfins.com/technical-analysis
The price setup still improved. ETH was shown near $2,322 in the latest technical snapshot, with a 3.11% one-week gain and a 10.22% one-month gain. The weekly trading reference showed a high near $2,424 and a low near $2,313, which left price pressed into the first resistance area rather than stuck near the lower support band. ETH had already broken above the $2,100 area and reached the $2,400 target zone. Now it has to decide whether that level is a ceiling or a launch point.
The trend labels were constructive but less convincing than Bitcoin’s momentum profile. Short-term trend was Strong Up, medium-term trend was Up, and long-term trend was Neutral. RSI was neutral, but MACD was still marked bearish after a signal-line cross 28 days earlier. That mismatch fits the tape: price has recovered, but the momentum confirmation is lagging. ETH can trade higher from here, yet the chart has not earned the same clarity as BTC’s $80,000 reclaim.
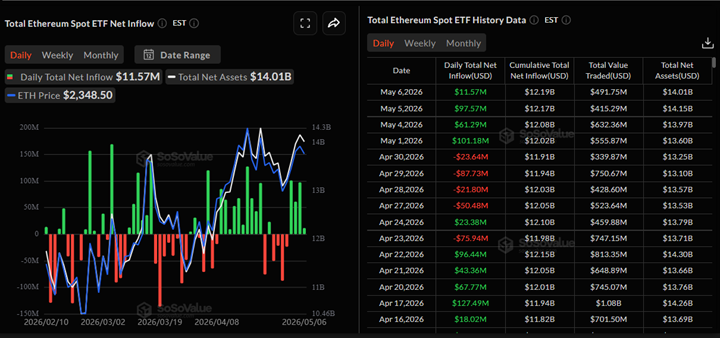
Source: https://sosovalue.com/assets/etf/us-eth-spot
Support sits at $2,100, then $1,800. Resistance sits at $2,400, then $2,700. A close above $2,400 would make $2,700 the next obvious test, while a pullback toward $2,100 would still fit a swing-trade structure if buyers defend it. A break back below $2,100 would weaken the recovery fast, because that level is the line that turned the prior range from damage control into a rebound.
Spot ETH ETF flows helped. The latest snapshot showed about $98 million of net inflows, roughly $415 million of value traded, total net assets near $14.2 billion, and cumulative net inflow near $12.2 billion. That followed other positive readings above $60 million and $100 million after an early-week outflow day near $88 million. ETH does not have the same ETF asset base as BTC, but the latest flow direction supported the recovery.
The narrative layer around ETH is getting busier. Aave is trying to protect $71 million of recovered ETH for exploit victims, Drift outlined a $295 million recovery plan, and dormant Ethereum wallets were drained in a separate security story. ETH’s upside case is being supported by treasury and staking demand. Its risk case still comes from the same place Ethereum has always been tested: complex infrastructure, real money, and no room for sloppy controls.
Strategy’s Treasury Trade Gets Its First Real Stress Test
Strategy changed the corporate Bitcoin story this week. The company reported a $12.7 billion first-quarter loss, including a $14.46 billion unrealised loss on digital assets, while still holding 818,334 BTC. Saylor also opened the door to selling some Bitcoin to pay preferred-stock dividends, a break from the simple accumulation script that has defined the company for years.
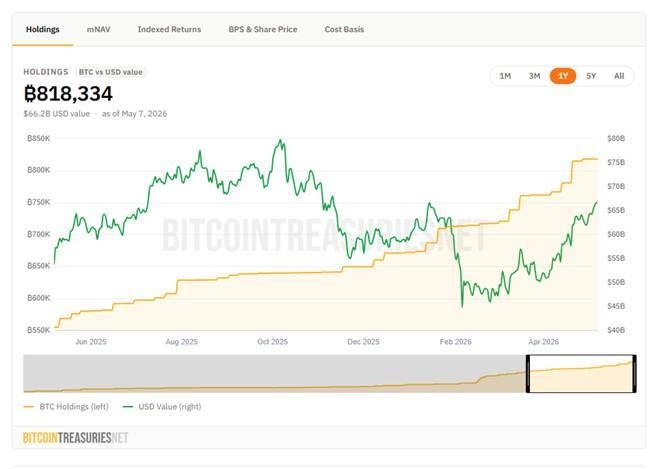
Source: https://bitcointreasuries.net/public-companies/strategy
The issue is funding design. Strategy has used credit and preferred equity to keep buying Bitcoin, and that works best when BTC rises faster than the claims built around it. Dividend obligations make the model less abstract. If cash has to come from the treasury stack, investors can no longer treat every corporate Bitcoin headline as pure demand.
That does not make Strategy a forced seller today. It does make the company’s capital structure part of the Bitcoin market story. A treasury trade that once looked like a one-way accumulation machine now has to answer a harder question: how much pressure can the structure absorb when the asset is volatile and cash obligations keep arriving?
Bitcoin Becomes a Policy Object
Bitcoin kept showing up outside the usual trading frame. U.S. public debt held by investors reached $31.27 trillion at the end of March, just above trailing nominal GDP of $31.22 trillion, according to the Committee for a Responsible Federal Budget. Defense Secretary Pete Hegseth reportedly framed Bitcoin as strategic leverage, Colombia’s president floated renewable-powered Bitcoin mining on the Caribbean coast, and Japan’s suspected $35 billion yen intervention reminded markets how quickly currency stress can spill into risk assets.
Source: https://bitcointreasuries.net/governments/united-states
The common thread is policy utility. In Washington, Bitcoin is being pulled into fiscal and national-security arguments. In Colombia, it is being discussed as a way to monetize surplus energy and attract investment. In Japan, the link is less direct but still relevant: a fast yen squeeze can force macro funds to cut risk across unrelated markets, including crypto.
That is a different backdrop from a normal ETF-flow week. Bitcoin is still trading around support, resistance, and liquidity, but the questions around it are becoming bigger than allocation. Governments are asking whether it is a reserve asset, an energy buyer, a sanctions tool, a mining industry, or a pressure valve for weak currencies. The market does not need one answer yet. The fact that the questions are being asked is the change.
Mark Your Calendars
Economic Data Releases:
- May 8, 2026 (Friday): U.S. unemployment rate
- May 12, 2026 (Tuesday): U.S. CPI and Core CPI for April
- May 13, 2026 (Wednesday): U.S. PPI for April
Token Unlock
- May 8, 2026 (Friday): SXT unlocks about $6.5 M
- May 9, 2026 (Saturday): STABLE unlocks 0.89% of supply
- May 12, 2026 (Tuesday): APT unlocks about 11.3 M tokens, roughly $102 M
- May 15, 2026 (Friday): STRK unlocks about 127 M tokens, roughly $145 M
- May 16, 2026 (Saturday): ARB unlocks about 92.6 M ARB, roughly $90 M