Bitcoin Finds Its Feet As Vanguard And Big Banks Embrace ETFs
4th December 2025 • 11mins read
This Week’s Recap
- Bitcoin ETFs Are Now BlackRock’s Top Revenue Source, Exec Says: BlackRock executives said its Bitcoin ETFs, led by IBIT, have become the firm’s single biggest revenue source. The flagship fund has gathered around 70 billion dollars in assets, generating hundreds of millions in fees since launch. Watch how competitors respond on pricing and product design as ETF flows and market share concentrate around a few dominant issuers.
- Spot bitcoin, ether ETFs recover momentum with first net-positive inflow week since October Spot Bitcoin and Ether ETFs logged their first net-positive inflow week since October, ending a four week stretch of outflows. The rebound coincided with improving macro expectations and rising odds of a December Federal Reserve rate cut. Watch if December brings a sustained turn in ETF demand or just a brief positioning bounce ahead of key data and the FOMC meeting.
- Vanguard opens platform to crypto ETFs in major shift Vanguard is reversing its long standing stance by allowing clients to trade spot Bitcoin, Ethereum, XRP, and Solana ETFs on its platform. The move helps explain the sharp rebound in crypto market cap and ETF volumes as investors reallocate from traditional funds into regulated digital asset products. Watch how client uptake and any follow on product launches reshape ETF flows and fee competition across the big US retail platforms.
- Bank of America greenlights wealth advisors to recommend up to 4% bitcoin allocation Bank of America will now allow more than 15,000 wealth advisers to recommend crypto allocations of up to 4 percent and initiate coverage on several spot Bitcoin ETFs. This marks a major shift from earlier restrictions and puts one of the largest US banks more directly into the digital asset allocation conversation. Watch how quickly BofA platforms see net inflows into covered ETFs and whether guidance expands to Ethereum or multi asset products.
- Bitcoin miners face worst profitability crunch on record, analyst says The Block reports that Bitcoin miners are experiencing their worst profitability squeeze on record, with margins compressed despite elevated BTC prices. Post halving difficulty increases, higher energy costs, and muted fee revenue have all weighed on miner economics. Monitor balance sheets, capex plans, and any signs of forced selling or consolidation among weaker operators if conditions persist.
- Ethereum activates Fusaka upgrade, aiming to cut node costs, speed layer-2 settlements Ethereum activated the Fusaka upgrade, introducing PeerDAS to lower data availability costs and reduce computational load on validators. The change supports higher throughput for rollups and lowers the cost base for DeFi and other high volume applications. Watch how L2 fees, transaction speeds, and validator economics evolve as the upgrade beds in over the coming weeks.
- European asset manager Amundi debuts tokenized share class on Ethereum Amundi launched a tokenized share class of its euro cash fund on Ethereum, offering blockchain based access to money market exposure. The product uses CACEIS infrastructure to support 24/7 order processing and on chain settlement. Watch whether Amundi expands its tokenized range and how quickly other major asset managers follow with similar structures.
- Spot XRP ETFs outpace market with 12-day inflow streak, nearing USD1B mark Spot XRP ETFs have recorded 12 consecutive days of inflows, with cumulative net subscriptions approaching 1,000,000,000 dollars. XRP products have recently outpaced Bitcoin and Ethereum ETFs on flow metrics, even as the token’s price has lagged majors. Watch whether this demand remains sticky or fades if price underperformance continues or macro conditions shift.
- Franklin Templeton launches Solana ETF, expanding Wall Street’s crypto offerings Franklin Templeton has launched a Solana ETF, adding another major altcoin vehicle to the exchange traded product lineup. The listing follows sustained inflows into Solana products and growing institutional interest in high beta layer 1 exposure. Monitor trading volumes, tracking quality, and whether rival issuers accelerate their own Solana or multi L1 filings.
- LINK surges 7% as Grayscale’s Chainlink ETF sees USD37M in first-day inflow Grayscale’s GLNK Chainlink ETF attracted around 37,000,000 dollars on its first trading day, coinciding with a 7 percent rally in LINK. The fund is the first US ETF tied specifically to an oracle token, giving institutions a regulated route into Chainlink exposure. Watch whether GLNK maintains momentum and if it opens the door for ETFs tied to other infrastructure and middleware assets.
- Crypto exchange KuCoin’s European arm wins MiCA license in Austria KuCoin’s European entity obtained a Markets in Crypto Assets (MiCA) license in Austria, letting it passport services across 29 EEA countries. This makes KuCoin one of the earliest large global exchanges to secure full MiCA authorisation, after years of heightened regulatory scrutiny. Watch how KuCoin adjusts products, leverage, and listing standards to align with its new regulatory obligations.
- South Korea suspects North Korea-linked Lazarus behind USD36M Upbit hack South Korean authorities suspect the Lazarus Group was behind a roughly 36,000,000 dollar exploit of Upbit’s Solana wallet infrastructure. Upbit has covered all affected user balances from corporate reserves, but the incident highlights persistent vulnerabilities in centralized exchange custody. Watch for any new sanctions designations, mandatory security standards, or insurance requirements emerging from Korean regulators and peers in the region.
- Stablecoins drive 90% of Brazil’s crypto volume, tax authority data shows Brazil’s tax authority data indicates that stablecoins account for about 90 percent of reported crypto transaction volume in the country. Dollar-pegged tokens dominate use cases such as remittances, savings, and hedging against local currency volatility. Watch how Brazil’s DeCripto reporting framework shapes compliance obligations and whether regulators push for stricter oversight of stablecoin issuers serving local users.
- Visa taps Aquanow to expand stablecoin settlement across Europe, Middle East, and Africa Visa has partnered with infrastructure provider Aquanow to extend its USDC based settlement program into Europe, the Middle East, and Africa. The initiative is already processing volumes at an estimated 2,500,000,000 dollar annualised run rate, signalling that on chain settlement is moving beyond pilot scale. Watch for additional bank and fintech participants and any expansion to new corridors, currencies, or stablecoins.
- ‘We wear your loathing with pride’: Tether’s downgrade at S&P sparks online battle S&P Global downgraded Tether’s USDT to its weakest stability rating, pointing to increasing exposure to Bitcoin, gold, and secured loans. Tether’s leadership responded aggressively online, criticising the decision and defending the composition of its reserves. Watch for any knock on effects in USDT market share, changes in reserve disclosures, or regulatory reactions to the new rating.
- Stablecoins Drive 90% of Brazil’s Crypto Volume, Tax Authority Data Shows Brazil’s tax authority revealed that stablecoins account for the overwhelming majority of reported crypto transaction volume, underscoring their central role in local usage. The data highlights how dollar-denominated tokens function as de facto savings and payment instruments in an inflationary environment. Watch how policymakers balance tighter reporting through systems like DeCripto with maintaining access to stablecoin rails for households and businesses.
- Kraken agrees to buy tokenization specialist Backed Finance as RWA trend accelerates Kraken has agreed to acquire Backed Finance, a tokenisation firm issuing on chain versions of stocks and bonds. The deal strengthens Kraken’s position in real world assets just as RWA narratives gain traction among institutions and ahead of a potential IPO. Watch for new tokenised products on Kraken’s platforms and whether rival exchanges pursue similar acquisitions.
- U.S. FDIC chief says first GENIUS Act regulations heading for proposal this month The FDIC’s acting chair said the agency plans to propose its first GENIUS Act rules, including standards for bank issued stablecoins, by year end. The rules are expected to clarify how insured banks can issue and hold tokenised deposits and other dollar-pegged instruments. Watch how banks, stablecoin issuers, and lawmakers respond to proposed capital, reserve, and activity constraints during the comment period.
Bitcoin Market Analysis
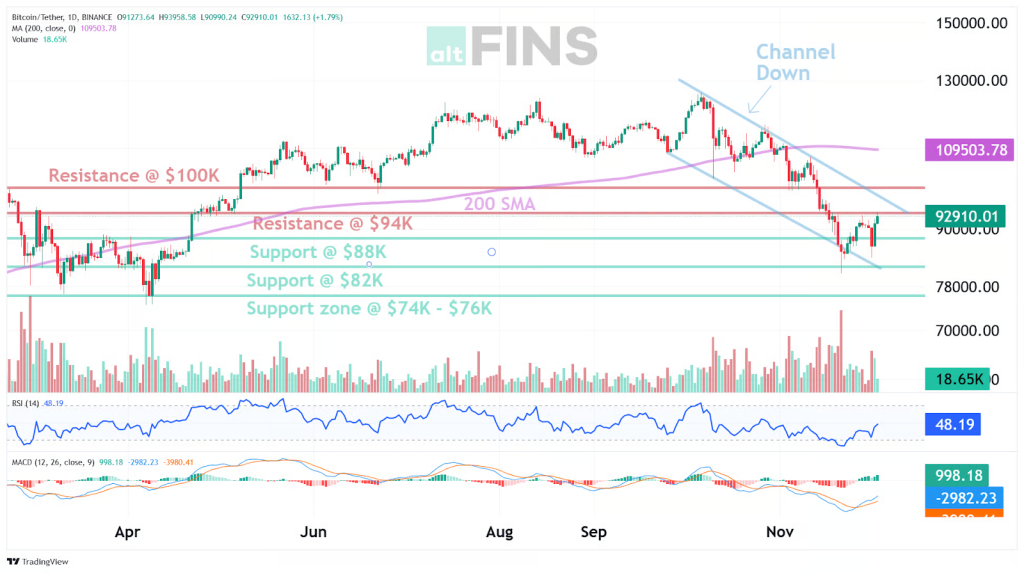
Over the last week, Bitcoin has traded between a low near $83,800 and a high close to $94,200, with recent daily closes clustering around $93,000 to $94,000. A recovery from the early week dip into the mid $80,000s has been recorded, while the price still sits about 25 percent below the October all time high near $126,000 and roughly 25 percent above the 52 week low around $74,500. In this configuration, spot has been positioned in the upper half of its medium term range, where volatility has previously been most intense, and market sensitivity to new information has remained elevated.
Source: https://altfins.com/technical-analysis
On the daily chart, trading has continued below the 200-day simple moving average, which currently lies well above spot near $109,000, and price action has remained contained within a downward sloping channel that began after the October peak. Short term averages such as the 5 day and 10 day simple moving averages and the 9 day exponential moving average have started to curl higher, while the 20 to 100 day moving averages still point lower, so only a short term rebound has been registered within a broader corrective structure. RSI on the 14-day lookback has stayed in the middle of the 30 to 70 band, indicating neutral momentum, while several stochastic measures and Williams %R have reached overbought territory, suggesting that immediate upside follow through is not assured. MACD and simple momentum gauges have turned positive, and average true range near $3,900 has remained below the roughly $10,000 weekly high to low span, meaning that volatility has increased beyond its recent average without yet reaching capitulation extremes.
Key reference levels have been mapped around this structure. Immediate support has been identified near $88,000, with secondary support around $82,000 and a broader demand zone between $74,000 and $76,000 that captured strong buying interest during earlier pullbacks. On the upside, resistance has repeatedly been met near $94,000, and a major barrier has been noted around the psychological $100,000 area that also coincides with prior congestion. The prevailing channel down pattern has often been associated in historical studies with eventual upside breaks, but such outcomes cannot be guaranteed and must be treated as conditional. A sustained daily close above $94,000, followed by acceptance above $100,000, would be interpreted as early confirmation that the corrective phase is being resolved upward, whereas a decisive loss of $82,000, or especially a break of the $74,000 to $76,000 zone, would be treated as an invalidation of the current constructive bias.
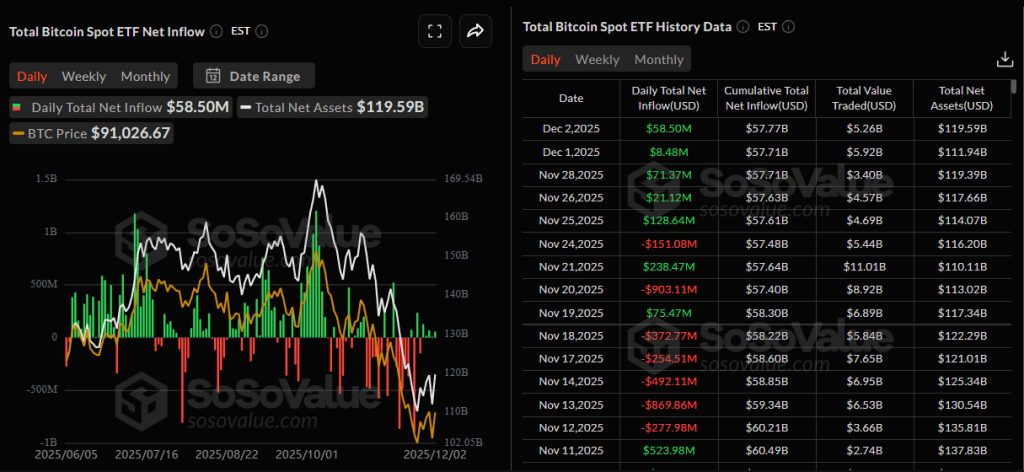
Within listed products, behaviour in spot Bitcoin exchange traded funds has shown an important inflection. Over the most recent seven trading sessions, a net inflow in the region of a few hundred million dollars has been recorded for these vehicles, following roughly four consecutive weeks in November during which several billions left the complex. The latest period has marked the first net positive week for both spot Bitcoin and Ethereum funds since October, with individual days printing moderate inflows rather than the very large single day outflows seen during the mid November stress episode. This reversal in fund demand has coincided with the recovery from the low $80,000s and the defence of channel support, although the November outflows have only been partially offset, so a full restoration of appetite has not yet been established and the improvement is best described as tentative.
Source: https://sosovalue.com/assets/etf/us-btc-spot
Inside the ETF complex, a clear concentration of assets and revenue has been observed. BlackRock executives have indicated that the firm’s Bitcoin products, led by the flagship United States spot ETF, now represent the largest single revenue source for the organisation, with assets still around $70,000,000,000 after the November drawdown and fee income estimated in the hundreds of millions of dollars on an annualised basis. This concentration of flows and fees among a small number of dominant issuers has reinforced competitive pressure on rivals through pricing and product design and has strengthened the alignment between those large sponsors and the long term health of the Bitcoin market. The durability of this concentration remains dependent on future fee decisions and market share shifts, but for the time being, dominance by a handful of vehicles has persisted.
The distribution landscape in traditional wealth channels has shifted at the same time, as Vanguard has moved from an exclusionary stance to permitting trading of spot Bitcoin, Ethereum, XRP, and Solana exchange traded funds on its brokerage platform, which serves a very large base of retail and retirement accounts, even as the firm continues to avoid launching proprietary crypto products. In parallel, Bank of America has authorised more than 15,000 wealth advisers to recommend digital asset allocations of up to 4 percent and to provide formal coverage on a defined set of spot Bitcoin ETFs, as outlined in its new crypto allocation guidance. As a result, a broader range of clients can now receive regulated advice on Bitcoin exposure through large United States brokerages and private banks, although the timing and magnitude of resulting flows remain uncertain and will need to be monitored over coming months.
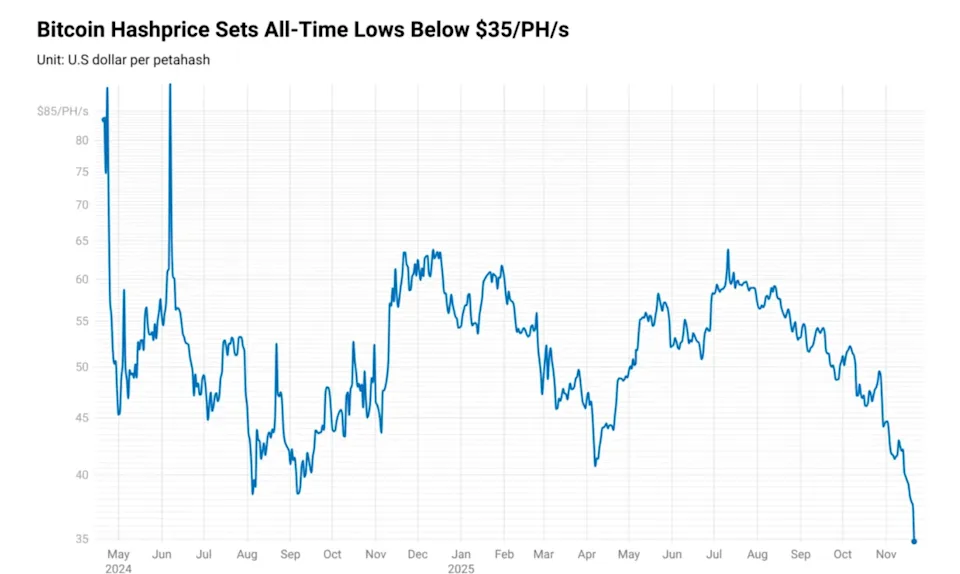
On the fundamental side, significant stress has been reported in the mining sector, where profitability metrics indicate that revenue per unit of hash power has fallen toward or below estimated production costs for many operators, as highlighted in recent analyses of the miner profitability squeeze. This squeeze has been driven by the post halving reduction in block rewards, a persistent rise in network hashrate, higher energy costs, and muted transaction fee income, leaving margins compressed across a large portion of the industry. Balance sheet pressure has been felt most acutely by higher cost and more leveraged miners, raising the risk that some treasuries may be liquidated into strength, particularly as prices approach the $94,000 and $100,000 resistance bands, while historical cycles have often placed miner capitulation near medium term price lows, so the current strain may also be part of a broader cleansing phase, although the exact timing of such turning points cannot be predicted with confidence.
Source: https://theminermag.com/news/2025-11-22/bitcoin-hashprice-all-time-low
Macro conditions have provided an important backdrop to these moves, as market expectations for the December Federal Reserve meeting have shifted toward a higher probability of a rate cut following softer inflation readings and a series of dovish signals from policymakers, as discussed in recent Fed outlook coverage. Over the same period, the United States dollar index has eased from recent highs, and spot Bitcoin and Ethereum ETFs have posted their first net positive inflow week since October, with Bitcoin products recording roughly $70,000,000 in net inflows and Ethereum products adding more than $300,000,000, according to ETF flow summaries. In this context, Bitcoin’s recent recovery can be attributed to a combination of technical mean reversion from oversold levels, stabilising ETF demand, expanding access through major wealth and brokerage platforms, and a still stressed but functioning mining base, with the $88,000 and $82,000 supports and the $94,000 and $100,000 resistances likely to remain the key reference points for the next decisive move.
Ethereum Market Analysis
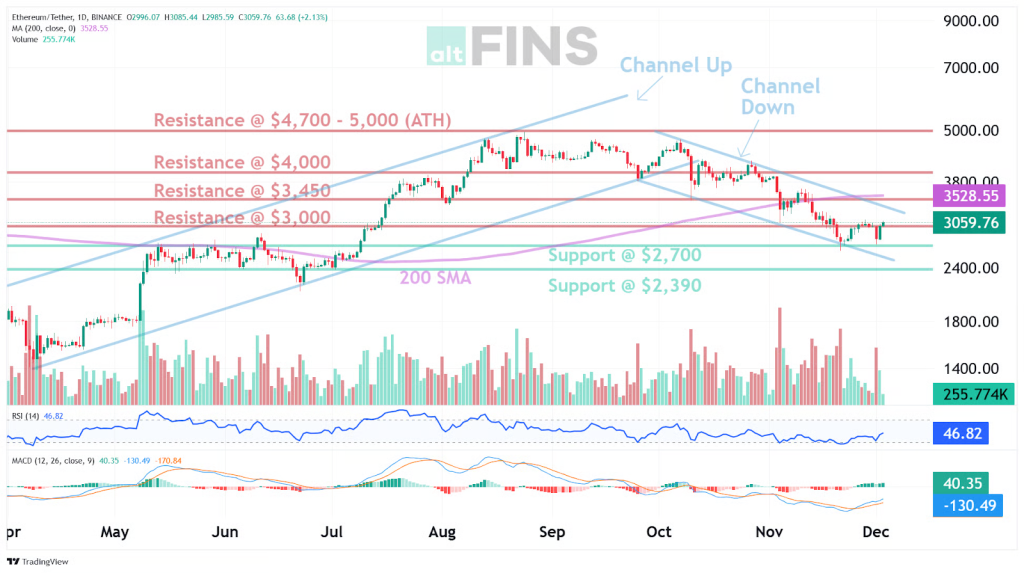
Over the past week, ether has traded between an intraday low near $2,720 and a high around $3,240, with the daily close rising from roughly $3,030 at the start of the window to about $3,210, a gain of a little over 6 percent after an early week decline. [Inference] The sharp move down toward $2,720 on December 1 was followed by swift buying, and the $3,000 level has since been reclaimed on a closing basis, so the initial breakdown has been contained rather than extended. [Inference] In the wider context, price remains about one third below the all time high near $4,956 and more than 100 percent above the 52 week low around $1,385, so the current region still sits in the middle of a larger multi month range rather than at an extreme.
Source: https://altfins.com/technical-analysis
The prevailing structure has been described as a Channel Down pattern, within which a resistance break above $3,000 has been recorded and is now being retested. [Inference] Trend tags classify the short term profile as Neutral at 5 out of 10, with the medium term and long term profiles still marked as Strong Down at 1 out of 10 and 2 out of 10, which indicates that the recent advance has developed inside an unfinished corrective phase. [Inference] Momentum tags show RSI 9, RSI 14, and RSI 25 all Neutral, Stochastic in an oversold state, Stochastic RSI fast overbought, the Ultimate Oscillator Bullish, and CCI 20 Overbought, so upward impulse has been firm but not yet extreme. [Inference] Average true range sits near $193 and the latest daily range has been only slightly above that, while the lower and upper Bollinger Bands lie near $2,736 and $3,242, which confirms that price is pressing against the upper half of its short term volatility envelope without a clean band break.
Key levels have therefore been defined with reasonable clarity, with the nearest support zone around $2,700 and a deeper support band near $2,390, while resistance levels sit near $3,450 and then $4,000. [Inference] The move through $3,000 has been treated as a resistance breakout in which supply at that level has been absorbed, so the $3,450 band has become the next logical upside objective as long as the breakout is respected on daily closes. [Inference] Invalidation for that constructive view has been placed at a decisive daily close below $2,700, which would shift focus back to defence of $2,390 and would confirm that the Channel Down pattern remains dominant. [Inference] Moving average tags support the idea of a transition phase, with the 5 and 10 day simple moving averages and the 9 day exponential moving average trending up, the 20 to 50 day measures still trending down, and the 100 and 200 day averages trending up, while the volume weighted moving average around $2,965 marks a nearby reference for recent traded value.
Flow data for ether spot exchange traded products has stayed constructive on a multi week basis while turning more mixed in the very short term. [Inference] Late November saw a run of sizeable daily inflows, with several sessions posting green prints in the region of $55,000,000 to almost $100,000,000 and cumulative net inflows climbing into the area of roughly $12,900,000,000, while total net assets for the complex have hovered around $18,600,000,000 and daily traded value has often sat between about $1,500,000,000 and $2,300,000,000. [Inference] In the first days of December, that pattern shifted to outflows, with a large negative day near $79,000,000 on December 1 followed by a smaller outflow of around $9,900,000, which trimmed but did not erase the prior recovery in cumulative flows. [Inference] This mix implies that the recent move back above $3,000 has been supported by earlier inflows and a reduction in selling rather than by a fresh surge of ETF demand, so any claim that the rally is being driven by new creations would be premature and must be treated as uncertain.
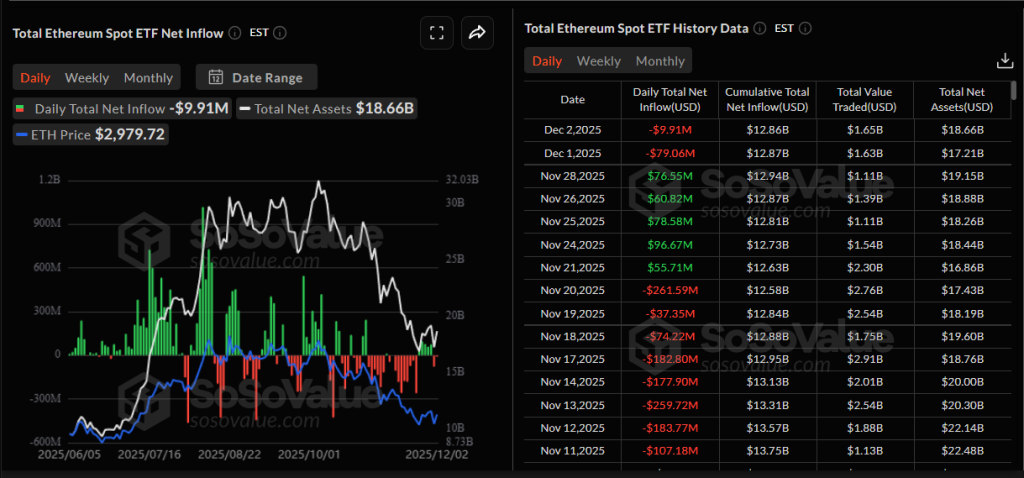
Source: https://sosovalue.com/assets/etf/us-eth-spot
On the fundamental side, the activation of the Fusaka upgrade has provided the main structural development for Ethereum during the period, with peer data availability sampling introduced in order to lower data availability costs, reduce computational load on validators, and raise effective throughput for rollups, so the medium term economics for layer 2 settlement, DeFi, and other high volume applications are expected to improve if the upgrade performs as designed, although the realised impact on fees and validator rewards will only become clear over time. At the same time, tokenization progress has continued, with a large European asset manager debuting a tokenized share class of a euro cash fund on Ethereum through a hybrid structure that uses established custody infrastructure and offers on chain settlement and extended order windows, as described in the Amundi and CACEIS announcement, which reinforces the network’s position in regulated real world asset issuance. Against this backdrop, broader markets have remained sensitive to tariff policy and uneven manufacturing data, while a softer dollar index, reflected in reports of the DXY easing toward the high 90s in recent sessions has provided a modest tailwind to risk assets; within that environment, ether now sits at a technically pivotal zone in which sustained holds above $3,000 and constructive ETF flows would favour continuation toward $3,450, whereas a failure back below $2,700 would keep the Channel Down pattern in force and would postpone any durable trend reversal.
Mark Your Calendars
Economic Data Releases:
- December 5, 2025 (Thursday): PCE and core PCE index (delayed september report)
- December 10, 2025 (Thursday): FOMC interest-rate decision
- December 10, 2025 (Thursday): Fed Chair Powell press conference
Token Unlock
- December 5, 2025 (Friday): ENA (ENA) unlocks $50.25 M (2.45 % of market cap)
- December 10, 2025 (Wednesday): LINEA (LINEA) unlocks $12.61 M (6.76 % of market cap)
- December 12, 2025 (Friday): APT (APT) unlocks $2.18 M (0.10 % of market cap)