Fed Cuts, Powell Sounds Hawkish, BTC Ranges
30th October 2025 • 8mins read
This Week’s Recap
- Fed delivers a 25 bps cut; markets focus on Powell’s guidance: The policy move was widely expected, but guidance dampened hopes for rapid follow-up easing. Crypto traded heavy as financial conditions tightened intraday. Next catalysts are labor data, USD path, and real-yield swings.
- Bitcoin slides toward $110k after Powell’s hawkish presser: Chair Powell warned that another cut is “not a foregone conclusion,” flipping risk sentiment. BTC underperformed into the close as leverage washed out. Desks now watch ETF creations and liquidity breadth.
- Bitcoin, Ethereum reverse post-cut pop on cautious Fed tone: The initial relief faded as Powell emphasized data dependence. Price action highlighted sensitivity to guidance over the move itself. Traders track funding, basis, and vol term-structure for signals.
- Prediction markets turn defensive as crypto dips: Odds shifted toward a weaker near-term path for BTC after the presser. Sentiment gauges echoed tighter financial conditions. A dovish data surprise could quickly reprice risk.
- Nvidia tops $5T market cap as BTC trails U.S. equities YTD: AI-led equity strength has outpaced Bitcoin on a year-to-date basis. Relative performance can siphon marginal flows from crypto. A policy pivot or earnings wobble could alter the balance.
- Digital-asset funds attract ~$921M amid easing hopes: CoinShares data showed broad inflows led by BTC products. The rebound followed weeks of macro uncertainty and choppy risk. Continuation depends on guidance and cross-asset liquidity.
- Securitize launches tokenized AAA CLO fund on Ethereum with BNY: The fund adds institutional-grade credit exposure to ETH rails with a planned anchor. It strengthens the case for RWAs as a durable ETH use-case. Watch allocations, secondary liquidity, and reporting cadence.
- Securitize targets public listing via SPAC at ~$1.25B valuation: A listing would place a core RWA player in public markets. Visibility could accelerate enterprise tokenization pipelines. Deal progress and ticker debut timing are the next markers.
- Consensys lines up JPMorgan and Goldman to lead planned IPO: The MetaMask parent’s move would be a marquee equity event for the ETH stack. Proceeds could scale Linea, wallets, and institutional tooling. Filings and bank syndicate details will set expectations.
- MegaETH raises ~$450M in oversubscribed sale backed by ETH founders: Capital targets sub-second UX and high-throughput execution on Ethereum. The raise validates L2 performance bets from institutional allocators. Mainnet readiness and sequencer decentralization are near-term checkpoints.
- Germany’s AfD files motion to treat Bitcoin as a strategic asset: The proposal argues MiCA over-reach and urges a sovereign BTC approach. Debate could shape EU interpretations and national reserve discourse. Committee reception and coalition math are the swing factors.
- Binance Wallet integrates Bubblemaps to surface insider-trading clusters: Users gain native heuristics to visualize token distribution and suspicious groupings. The move aligns with AML and market-integrity objectives. Adoption and false-positive handling will determine impact
- Mastercard in talks to acquire Zero Hash for nearly $2B, report says: The network aims to deepen stablecoin and on-chain settlement rails. A deal would accelerate enterprise integrations and regulatory coverage. Regulatory review and integration scope are key variables.
- Core Scientific upgraded to Buy on AI data-center momentum: Analysts cited HPC demand and a large hosting pipeline as tailwinds. The call underscores miner optionality beyond BTC revenues. Shareholder votes and capex execution remain watchpoints.
- TeraWulf surges after unveiling a $9.5B AI compute JV: The miner announced a long-dated JV to build AI infrastructure capacity. The stock reacted as investors priced new non-BTC revenue streams. Financing terms and buildout milestones are next.
Bitcoin Market Analysis
Bitcoin traded this week between roughly 107,600 and 114,500, with spot hovering near 110,000 into the close; seven day change stayed modestly positive after an early dip was retraced. Price action remained choppy, with intraday rallies failing near prior supply and pullbacks finding bids above the 200 day average. The sequence suggested fragile trend continuity rather than fresh impulse, since range expansion attempts were faded quickly. It can be concluded that conditions improved versus mid October, yet conviction remained restrained.
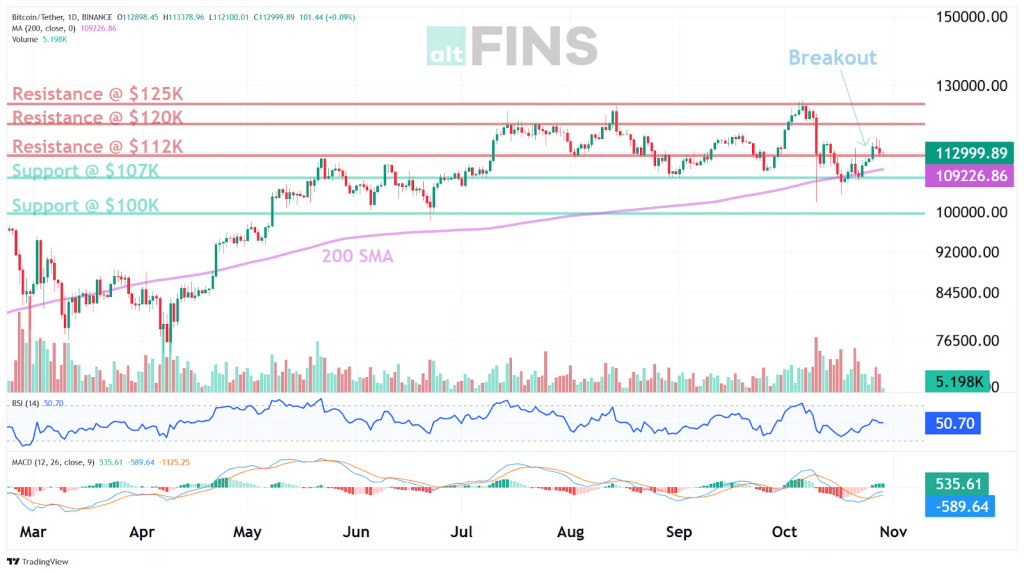
Source: https://altfins.com/technical-analysis
Daily technicals showed RSI near mid band, not overbought and not oversold, MACD remained crossed up while the histogram eased, ATR held near 3,700 to 3,800, and Bollinger bands sat near 105,494 and 116,088; the 200 day SMA tracked close to 109,226. The mix implied bullish but inflecting momentum and volatility consistent with range trading. Taken together, trend repair continued above the 200 day average, while a clean thrust failed to develop. It follows that patience around confirmation signals remained warranted.
Key levels centered on support at 107,000 and 100,000, resistance at 112,000 and 120,000, with an extension level near 125,000, while the short term holder cost basis around 113,000 acted as a pivotal battleground. Acceptance above 113,000 would favor a run toward 120,000, rejection there would keep price pinned in the lower half of the band. The structure therefore argued for trading the range until a daily close breaks a boundary with volume. A practical stance would keep risk tight near edges and let confirmation decide direction.
Spot Bitcoin ETF flows improved, with a seven day net of about plus 798.14 million, a largest daily inflow of about 477.19 million on Oct 21, and a three day positive momentum of about 442.38 million into Oct 28. The profile shifted from mid month outflow stress toward steady creations, which typically supports dips when derivatives do not overheat. As a synthesis, flows argued for a bullish tilt within the range while acknowledging that the ten day net remained close to flat after earlier red prints. It is prudent to reassess if two consecutive negative days appear.
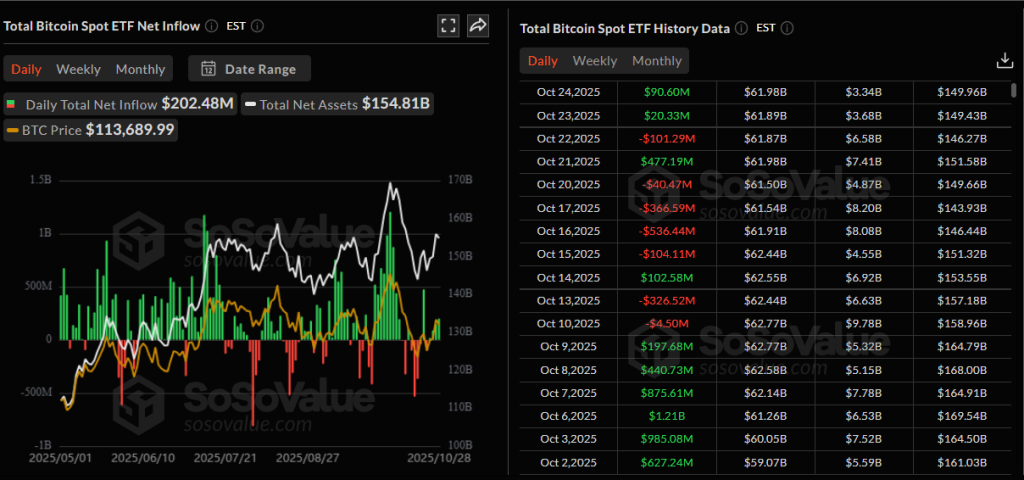
Source: https://sosovalue.com/assets/etf/us-eth-spot
On chain signals pointed to difficulty holding above the short term holder cost basis near 113,000, persistent long term holder distribution near six figure monthly pace, and elevated transfers from older coins to exchanges around a few hundred million dollars per day; realized and implied volatilities eased toward the low to mid 40s, and option skew normalized toward neutral. The mixture indicated demand rebuilding slowly while supply from experienced cohorts continued to cap follow through. When combined with price stalling near the battleground, the message remained one of consolidation rather than capitulation. Uncertainty around exact magnitudes was acknowledged, yet the directional read stayed consistent.
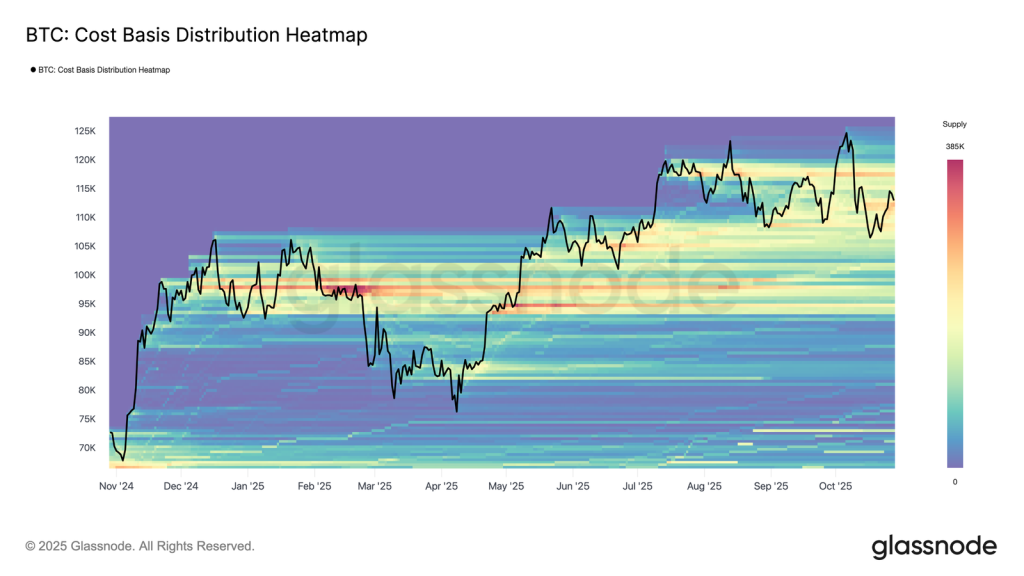
Source: https://insights.glassnode.com/the-week-onchain-week-43-2025/
Macro and news flow featured a 25 basis point Federal Reserve cut, followed by guidance that another cut was not assured, a firmer dollar at times, and attention shifting to labor data, real yields, and liquidity breadth across venues; initial post decision strength in Bitcoin and Ethereum was faded as guidance dominated. Market tone therefore rotated from relief to data dependence, with volatility controlled but sensitive to surprises. When aligned with ETF creations turning positive and options markets normalizing, the result favored range stability unless tighter financial conditions reassert. A concise takeaway would note that confirmation above 113,000 with supportive flows unlocks 120,000, while failure keeps 107,000 at risk.
Ethereum Market Analysis
Price traded back above 4,000 and ended the week near 4,123.81, with action contained by the lower and upper bands around 3,705.15 and 4,228.35, respectively. The recovery was achieved after an early fade, then a steady bid returned into the last prints. Taken together, the pattern suggested demand absorption at the round number and a controlled advance toward the upper band. A measured tone was warranted given intraday swings near the 218.59 average true range.
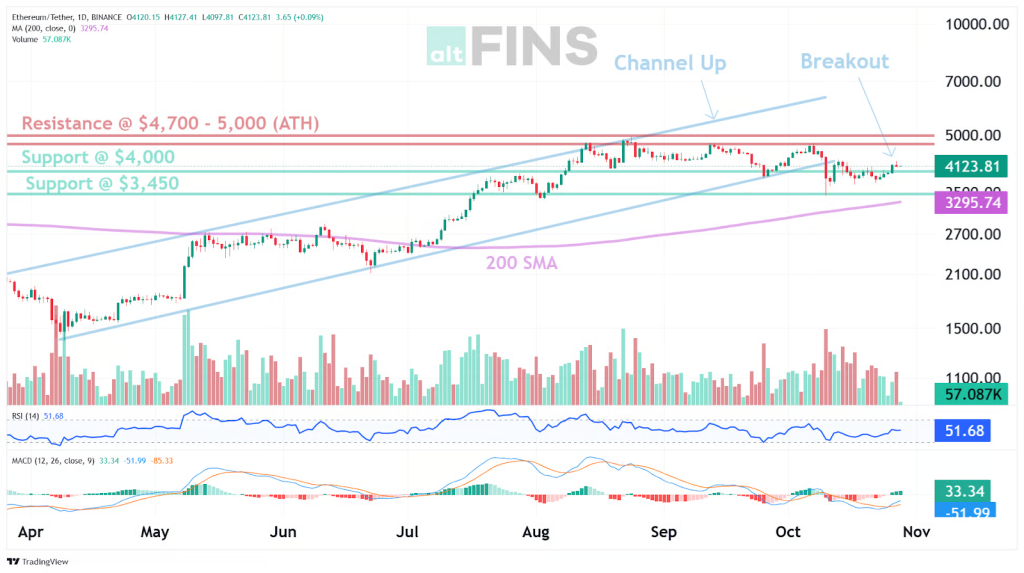
Source: https://altfins.com/technical-analysis
Momentum was indicated as constructive, with RSI at 51.68 in neutral territory and a bullish MACD crossover in place, while the histogram eased sequentially. The 200 day simple moving average sat near 3,295.74, keeping the longer trend pointed higher even as shorter windows stayed mixed. This configuration implied positive bias with risk of chop as momentum inflected. A close north of the upper band would validate follow through, while a slip back inside the mid band would argue for consolidation.
Key levels were defined as support at 4,000 and 3,450, with secondary support near 3,000, and resistance at 4,700 to 5,000, then 5,500, with the prior all time high at 4,956.67. The 4,700 to 5,000 zone was identified as a major supply shelf, where failed attempts have occurred. A break and close above 4,700 would open 4,950 to 5,000 as a primary target, while a daily close below 3,950 would risk a drive toward 3,450. A neutral to mildly bullish stance was appropriate while 4,000 held on daily closes.
Spot ETF flows registered a seven day net of approximately +109.12 million, with four positive sessions and three negative sessions, the largest single day inflow at +246.02 million on October 28, and the largest outflow at −232.88 million on October 20. Three day momentum into the week’s end totaled about +473.53 million, reflecting a decisive flip from early week outflows. This cadence favored dips being supported into resistance retests, conditional on the positive streak persisting. A deterioration to materially negative three day totals would weaken that read and would warrant faster de risking near resistance.
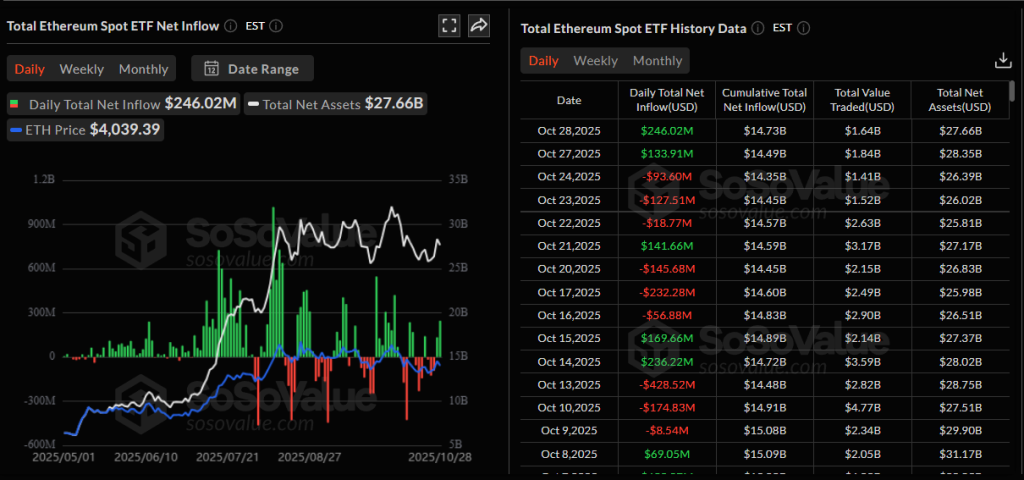
Source: https://sosovalue.com/assets/etf/us-eth-spot
News flow was led by reports that Consensys lined up JPMorgan and Goldman Sachs to lead a planned initial public offering, and by MegaETH raising about 450,000,000 to pursue sub second user experience and high throughput execution on Ethereum. These items added public market visibility and performance focused investment to the Ethereum stack during the week. The combination pointed to ongoing institutionalization and continued emphasis on L2 scale, with timelines and filings still to be confirmed. Caution remained appropriate until formal documents and development milestones were posted.
Overall conditions were characterized by price holding above 4,000, momentum that stayed positive but inflected, supportive ETF flow momentum, and constructive news on infrastructure and listings. These elements together framed a market that could press the 4,700 to 5,000 zone if flows remained positive and daily closes stayed above 4,000. Failure to sustain those conditions would shift expectations toward range trading inside 4,000 to 4,700 with downside risk to 3,450. Positioning was best expressed with clear invalidation at 3,950 on a daily close and a target ladder at 4,700, 4,950, and 5,000.
Mark Your Calendars
Economic Data Releases:
- October 31, 2025 (Friday): PCE index
- October 31, 2025 (Friday): Core PCE
- November 7, 2025 (Friday): U.S. Unemployment Rate
Token Unlock
- October 30, 2025 (Thursday): KMNO (KMNO) unlocks $15.09 M (5.99 % of market cap)
- October 30, 2025 (Thursday): IMX (IMX) unlocks $12.88 M (1.24 % of market cap)
- October 30, 2025 (Thursday): OP (OP) unlocks $13.79 M (1.71 % of market cap)
- October 31, 2025 (Friday): SUI (SUI) unlocks $110.34 M (1.21 % of market cap)
- November 1, 2025 (Saturday): EIGEN (EIGEN) unlocks $40.13 M (12.10 % of market cap)
- November 2, 2025 (Sunday): ENA (ENA) unlocks $17.96 M (0.60 % of market cap)
- November 2, 2025 (Sunday): OMNI (OMNI) unlocks $17.58 M (30.30 % of market cap)