ETF Market Volatility as Japan Rate Volatility Ripples Through Crypto
22nd January 2026 • 9mins read
This Week’s Recap
- Bitcoin falls briefly below $90,000 amid market meltdown: Bitcoin dipped under $90,000 as traders sold risk assets during turmoil linked to Japan’s government bond market. The report describes a broader risk off move that hit multiple markets at the same time. The key follow-up is whether BTC can hold the $90,000 area as macro liquidity conditions evolve.
- Bitcoin just erased all 2026 gains as a $1.5 billion liquidation trap catches every trader off guard: Over $1.5 billion in long liquidations over 48 hours as price broke below the $90,000 level. The article frames the move as a liquidation cascade that amplified downside volatility. The next signal is whether liquidations cool and price stabilises, or if leverage rebuilds quickly and repeats the cycle.
- Bitcoin, ether ETFs report combined $713 million in outflows amid market turmoil: U.S. spot Bitcoin and Ether ETFs saw about $713 million in combined net outflows during the selloff. The piece attributes flows to institutional de risking amid heightened volatility rather than a structural rejection of the products. The follow-up is whether ETF flows turn neutral or positive once volatility in rates and risk assets eases.
- Large bitcoin holders buy the most coins since the FTX collapse of 2022: Fish to Shark cohort added 110,000 BTC over the past 30 days, citing Glassnode. The data point suggests larger holders were accumulating even as macro risk rose. The next thing to watch is whether accumulation persists if price remains under pressure.
- Bitcoin hoarder Strategy buys $2.13 billion in bitcoin in eight days: Strategy bought about 22,305 BTC for roughly $2.13 billion between Jan 12 and 19, 2026. The report notes the purchases were funded through an at the market share offering program. The follow-up is whether Strategy continues buying through drawdowns, or slows if market volatility persists.
- Japan bond market panic spills into crypto, yields will keep rising until something breaks: Stress in Japan’s government bond market is spilling into global risk appetite, weighing on crypto alongside other risk assets. The move is framed as a liquidity shock rather than a crypto specific catalyst. The key follow-up is whether rates volatility persists, because that can keep pressure on leverage and positioning.
- NYSE parent Intercontinental Exchange develops platform for 24/7 tokenized securities trading: Intercontinental Exchange is developing a blockchain based platform for trading and settling tokenized securities, with 24/7 operations and stablecoin based funding, subject to regulatory approval. This reinforces the tokenization theme moving from pilots toward market infrastructure. The key follow-up is regulatory timing and which banks, brokers, or issuers commit to using the rail.
- Bitcoin bounces to $89,500, gold falls as Trump speaks in Davos: Bitcoin stabilised near $90,000 as markets reacted to Davos headlines and shifting geopolitical tone. The rebound looked like relief after forced selling rather than a clean trend reversal. The key follow-up is whether bitcoin resumes tracking rates and equity volatility, or can decouple if risk sentiment improves.
- Tom Lee’s BitMine Immersion pushes the Ethereum staking network into $8 billion backlog: Validator entry waits extended to more than 44 days as the staking queue swelled, tightening the near term liquidity picture for ETH. This matters for how quickly new capital can start earning yield and how much ETH is effectively sidelined. The key follow-up is whether the backlog clears as deposits slow, or persists if large entities keep staking.
- 30% of ETH is now staked, but one whale might be skewing the signal: Staked ETH has reached roughly 30% of supply, but concentration risk may be rising if a single entity is driving a large share of new deposits. This can complicate how investors interpret staking as a clean signal of long term conviction. The key follow-up is whether staking concentration increases further, because that can change perceived network resilience and liquidity conditions.
- Ethereum’s record activity clouded by address poisoning scams: Ethereum’s transaction spike is being attributed in large part to address poisoning patterns that exploit low fees. The growth signal is treated as noisy because a large share of new interactions appear automated rather than organic usage. The key follow-up is whether fee conditions and wallet protections reduce the scam-driven traffic.
- CME Group to offer cardano, chainlink, stellar futures as institutions seek regulated risk-management tools: Regulated futures for ADA, LINK, and XLM are positioned as new tools for institutions to hedge or gain exposure beyond BTC and ETH. The contracts are framed as part of a broader expansion in regulated crypto market infrastructure. The key follow-up is final regulatory approval and whether volumes build quickly after launch.
- Chainlink expands data streams to cover multitrillion-dollar U.S. stock market: Chainlink is extending its data streams to cover U.S. equities and ETFs, aiming to support more responsive on-chain pricing. The change is framed around sub-second updates and reduced on-chain overhead via a pull model. The key follow-up is whether trading venues and tokenization platforms integrate the feeds at scale.
- Grayscale files with SEC to convert NEAR Trust into spot ETF: A spot NEAR ETF filing expands the pipeline of single-asset crypto ETFs beyond Bitcoin and Ether. The step signals continued issuer demand to broaden the menu of regulated crypto wrappers. The key follow-up is SEC review timing and whether other altcoin filings follow the same structure.
- Coinbase cannot support crypto bill in current form, CEO Armstrong says: Coinbase’s opposition is tied to disputed provisions around tokenized equities, DeFi treatment, and stablecoin rewards. The policy friction is positioned as a near-term uncertainty over U.S. market structure direction. The key follow-up is whether negotiations converge on a revised draft, or delays extend into the election cycle.
- Hacker steals $282 million crypto from a victim in social-engineering attack: A single victim lost a very large sum after being manipulated into handing over access, highlighting persistent operational risk. The incident reinforced that custody and verification failures can be catastrophic even without protocol level exploits. The key follow-up is whether exchanges, wallet providers, and security firms publish clearer mitigations that reduce repeat patterns.
- Binance adds Ripple’s RLUSD stablecoin with XRPL support coming: A major venue listing improves distribution for RLUSD and can deepen market liquidity if adoption follows. The development also keeps institutional stablecoin competition in focus alongside ongoing policy debate on stablecoin rewards. The key follow-up is whether RLUSD volumes build sustainably beyond initial listing activity.
- White House may pull support for the CLARITY Act after Coinbase clash: The standoff underscored how stablecoin yield and market structure provisions can stall momentum even in a pro-crypto policy window. Policy uncertainty became a near-term risk input for U.S. listed crypto equities and onshore investment narratives. The key follow-up is whether negotiators converge on revised language that restores bipartisan support.
Bitcoin Market Analysis
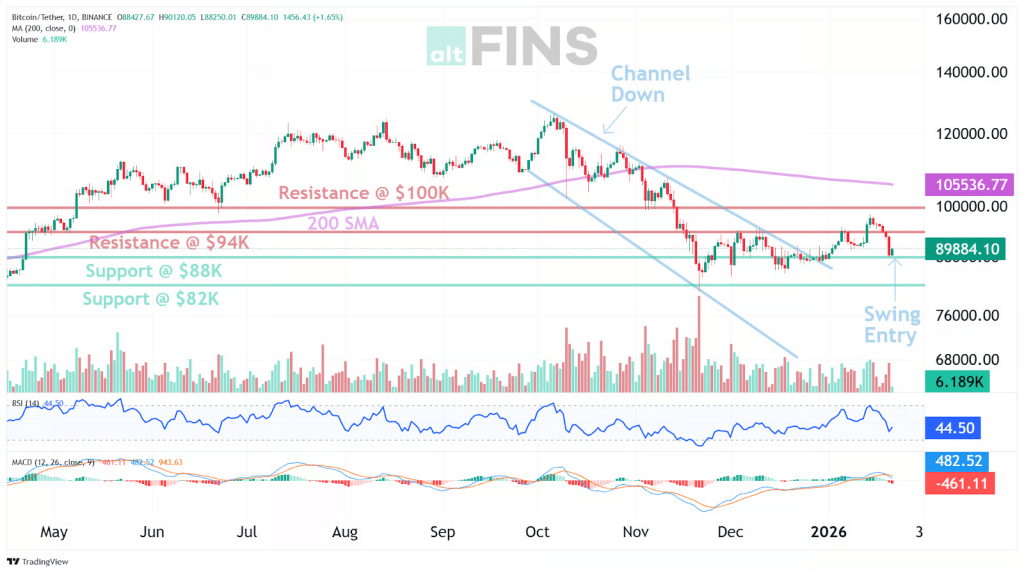
A decline was registered across the past seven sessions, with BTC/USD moving from an open of 96,942.4 on January 15 to a close of 89,433.8 on January 21, a net change of -7.75%. A weekly high of 97,181.4 and a weekly low of 87,285.1 were set within the same window, with the sharpest downside extension being printed on January 20 when a low of 87,911.4 and a close of 88,400.3 were recorded. Lower highs and lower lows were preserved into the weekly close, and downside volatility was concentrated around the 90,000 handle. A consolidation phase had been evident before the break lower, so the speed of the move was best explained by positioning rather than by gradual repricing.
Source: https://altfins.com/technical-analysis
Neutral momentum was reflected by RSI-14 at 44.50, while bearish pressure was indicated by MACD readings remaining below signal on the daily view. Elevated movement was confirmed by ATR at 2,528.61, and price action was contained within Bollinger Bands marked at 87,721.89 on the lower band and 97,100.35 on the upper band, with spot trading having been printed near 89,884. Moving average structure remained mixed across horizons, with the 200-day average having been indicated near 105,536.77 and remaining materially overhead. With price positioned below that longer-term reference, rebounds were more likely to be treated as corrective until a sustained recovery above key resistances is observed, and a higher-volatility regime was implied by the week’s range relative to ATR.
Primary levels were defined with support at 88,000 and then 82,000, and resistance at 94,000 and then 100,000, with the 200-day average near 105,537 remaining the higher-timeframe ceiling. A tactical bullish reversal setup had been associated with a channel-down break after weeks of sideways trade, but its validity was made conditional on support being defended on retests rather than being lost on closing bases. A sustained daily close below 88,000 would be consistent with a rotation toward 82,000, and that zone would be treated as the next invalidation boundary for the rebound thesis. Conversely, acceptance back above 94,000 would be required for upside traction toward 100,000 to be supported by structure, with approximately 12% implied from 88,000 to 100,000 if that resistance is revisited.
Source: https://sosovalue.com/assets/etf/us-btc-spot
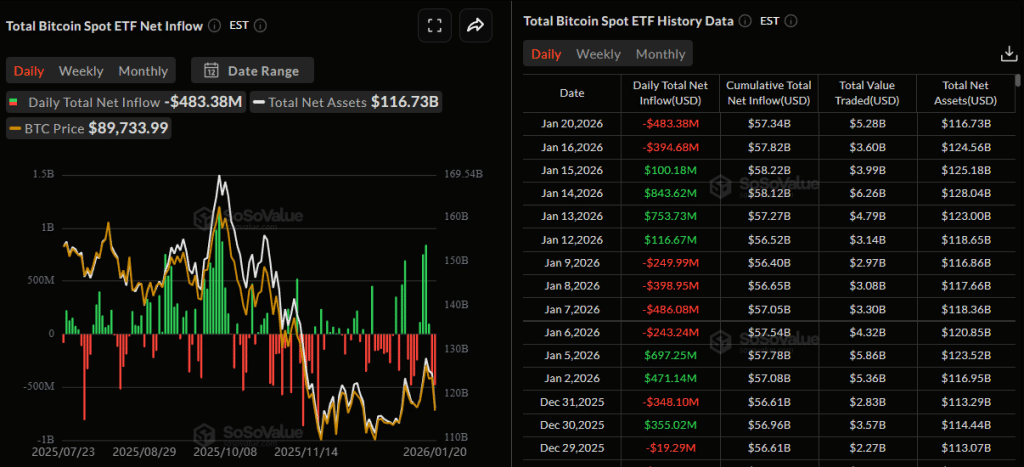
ETF flows were recorded as positive on a seven-session basis at +$686.15 million, but the near-term tone was weakened by late-week outflows. The largest inflow within the visible window was printed at +$843.62 million, while the largest outflow was printed at -$483.38 million, and the most recent three sessions summed to -$777.88 million as two outflow days followed a smaller inflow day. Total net assets were indicated near $116.73 billion at the latest reading, and daily traded value was shown in the low single-digit billions. Mixed cumulative flows alongside negative short-run momentum were consistent with de-risking behavior during volatility rather than with stable trend allocation, and confirmation was best sought through a turn from persistent outflows to neutral or positive prints alongside improving price acceptance above resistance.
A brief trade below 90,000 was reported during a broader risk-off episode occurring alongside turmoil in Japan’s government bond market, and pressure was amplified by a liquidation cascade. More than $1.5 billion in long liquidations over 48 hours was described in contemporaneous reporting citing CoinGlass data, while combined spot BTC and ETH ETF outflows of about $713 million were reported for the same window, based on SoSoValue flow data. Against that backdrop, accumulation by larger holders was cited at 110,000 BTC added over 30 days (Glassnode), and additional corporate demand was disclosed as 22,305 BTC purchased for about $2.13 billion between Jan 12 and Jan 19, funded via an at-the-market share offering program.
Ethereum Market Analysis
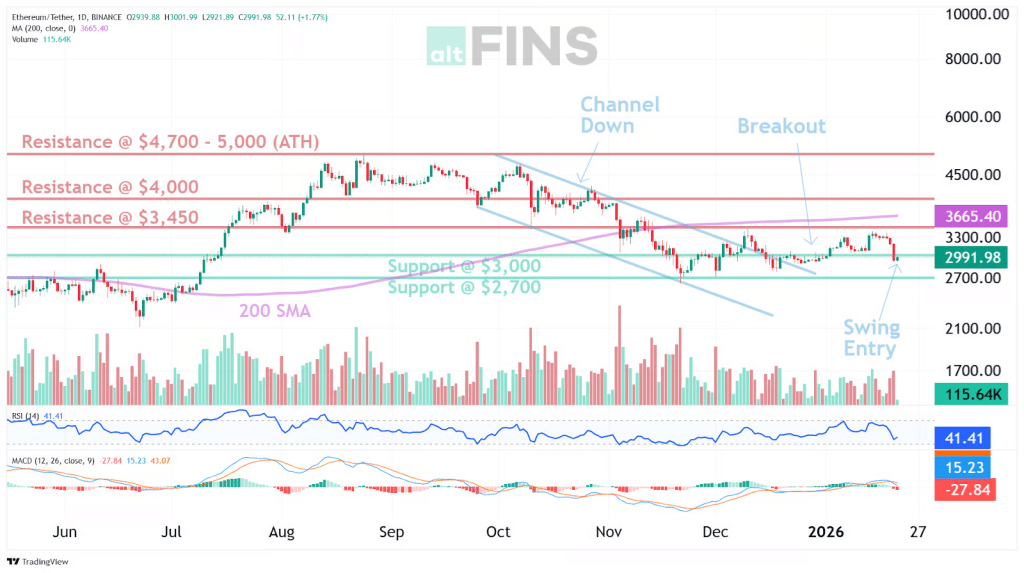
ETH was marked lower across the last seven completed sessions, with the week’s range having been set between a high of 3,384.18 and a low of 2,867.81, and with the close having moved from 3,318.70 on Jan 15 to 2,982.28 on Jan 21, a decline of 336.42, or 10.14 percent. A sharp selloff was recorded on Jan 20, when a 3,189.56 open was followed by a 2,939.74 close, and a partial stabilisation was then registered on Jan 21, when a 2,940.82 open was followed by a 2,982.28 close. The tape was therefore characterised by a sequence of heavy distribution into midweek, followed by tentative basing near the lower end of the week’s range, with certainty limited to the stated OHLC figures.
Source: https://altfins.com/technical-analysis
Momentum and trend conditions were framed by a neutral RSI regime that was positioned in the low 40s, while bearish MACD positioning was presented alongside an ATR near 128, implying a wide daily movement allowance relative to nearby levels. Bollinger bands were described with a lower band near 2,938 and an upper band near 3,409, and price was kept inside the envelope rather than being printed as a decisive band break. A rising long term reference was indicated by a 200 day simple moving average that was positioned materially above spot near 3,665, with the area around 3,450 to 3,665 having been defined as a stiff resistance zone due to prior target fulfilment and moving average proximity. From a purely technical standpoint, downside pressure was treated as dominant in the short horizon, while medium term conditions were left mixed, and long term conditions were described as weak, with those classifications taken as given rather than recalculated.
Key levels were defined around 3,000 as the primary pivot support, with 2,700 set as the next major support below, while 3,450 was held as first resistance and 4,000 as the higher resistance above. A polarity framework was applied, with prior resistance having been treated as support once broken, and with support validity having been contingent on daily closes being maintained above the relevant band. An invalidation zone was therefore implied to be activated by sustained acceptance below 3,000, with follow through risk then being opened toward 2,700, while any constructive recovery posture was left conditional on daily closes being reclaimed and held back above 3,450, and ultimately on the 200 day reference being approached with acceptance rather than rejection. Expectations were thus constrained to conditional statements around level integrity, with no directional outcome being asserted as certain.
Source: https://sosovalue.com/assets/etf/us-eth-spot
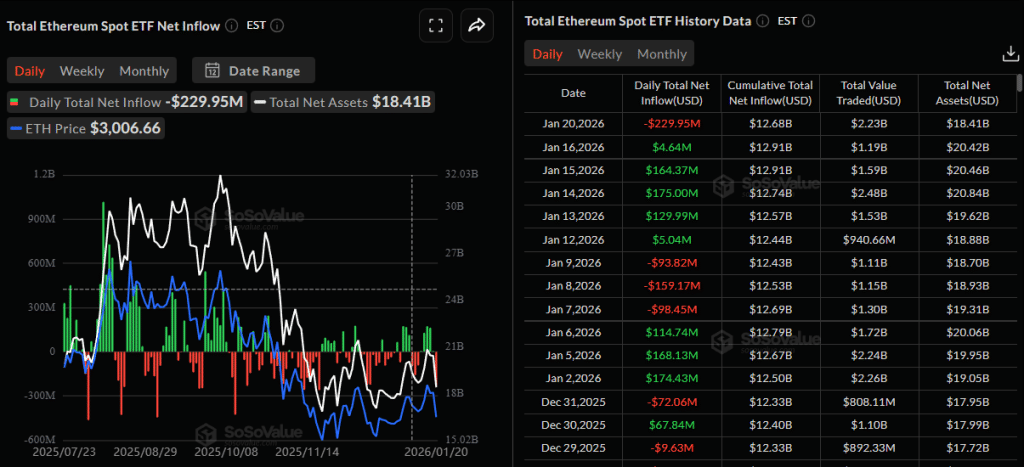
ETF flow conditions were characterised by a positive net flow of 155.27 million across the seven reported trading sessions, while the largest single day move was recorded as a 229.95 million outflow on Jan 20. A negative near term impulse was indicated over the most recent three reported sessions, where a 164.37 million inflow on Jan 15 and a 4.64 million inflow on Jan 16 were outweighed by the 229.95 million outflow on Jan 20, resulting in a net of minus 60.94 million. Total net assets were shown at 18.41 billion on Jan 20, and the interaction between flows and price was read as mixed, with earlier inflows having not prevented the week’s drawdown, and with the late outflow having aligned with the sharpest downside session in the window, while causality was not established by flow data alone.
The narrative backdrop was reported as being driven by staking dynamics and activity quality, with an estimated staking entry backlog of roughly $8 billion and validator activation waits of more than 44 days, which delays yield activation for new deposits. Staked supply was described at roughly 30% of supply, with the same reporting raising the question of whether recent deposits were concentrated. Elevated network activity was also described as potentially distorted by address poisoning activity under low-fee conditions, which makes headline transaction counts a noisier proxy for organic demand until attribution improves.
Japan’s JGB Shock
Japan’s January 2026 JGB volatility sits on top of a policy transition that restored more market pricing in rates. The Bank of Japan introduced yield curve control in September 2016, then ended negative rates and the YCC framework in March 2024. It then set a detailed plan on July 31, 2024 to reduce JGB purchases over time, including a path toward about 3 trillion yen of monthly buying by January to March 2026, which matters because it implies a larger share of duration needs to clear in private markets.
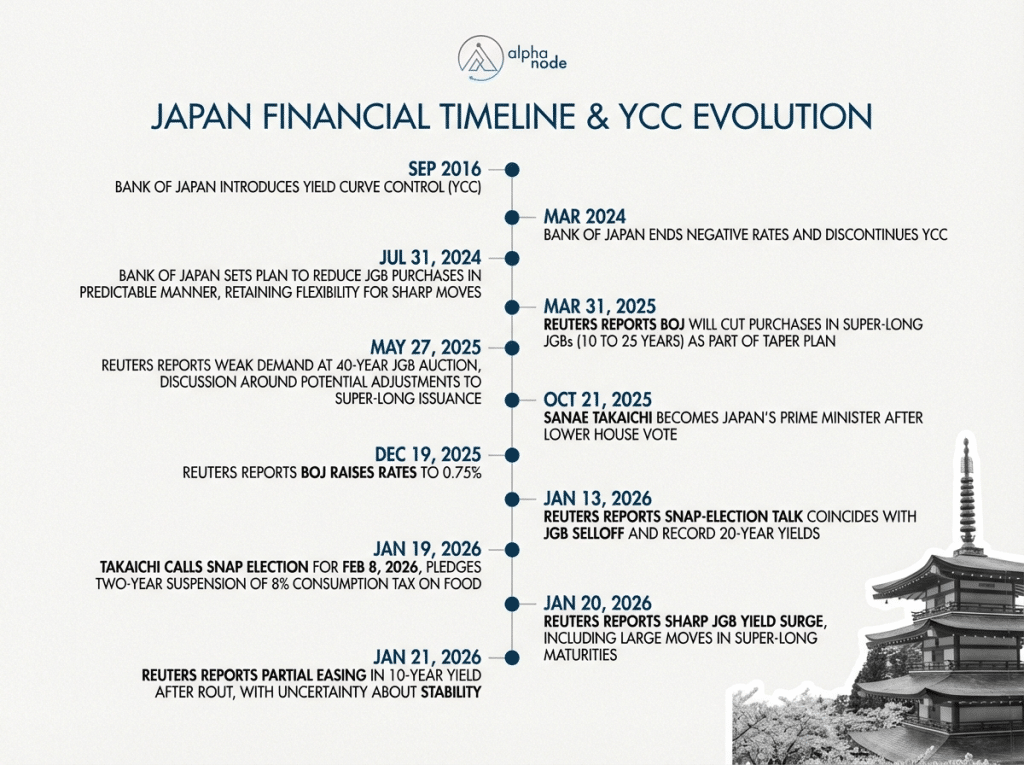
As that handoff progressed, signs of fragility showed up most clearly in the super-long sector, where liquidity and sponsorship can be thinner. Reuters reported weak demand at a 40-year auction in late May 2025, framing it as evidence of investor unease about fiscal capacity and the long end’s sensitivity as the BOJ’s footprint receded. That context matters for January 2026 because it establishes that the long end was already prone to sharp repricing when confidence, positioning, or auction outcomes deteriorate.
The January 2026 catalyst was political and fiscal, and it hit a market already primed for volatility. Reuters reported on January 19, 2026 that Prime Minister Sanae Takaichi called a snap election for February 8, 2026 and pledged a two-year suspension of the 8% consumption tax on food. Reuters then reported on January 20, 2026 that long-dated JGB yields shot to record highs as markets repriced fiscal risk, and Reuters reported on January 21, 2026 that the 10-year yield’s two-day surge took it to a 27-year high of 2.38%, alongside commentary that stabilisation is harder when the move is driven by fiscal credibility concerns rather than a purely technical dislocation.
Mark Your Calendars
Economic Data Releases:
- January 28, 2026 (Friday): FOMC interest-rate decision
- January 28, 2026 (Friday): Fed Chair Powell press conference
Token Unlock
- January 22, 2026 (Thursday): MBG (MBG) unlocks $12.34 M (12.13 % of market cap)
- January 25, 2026 (Sunday): H (H) unlocks $16.60 M (4.57 % of market cap)
- January 25, 2026 (Sunday): XPL (XPL) unlocks $11.26 M (4.33 % of market cap)
- January 26, 2026 (Monday): BGB (BGB) unlocks $508.20 M (10.50 % of market cap)
- January 28, 2026 (Wednesday): SIGN (SIGN) unlocks $11.42 M (17.68 % of market cap)
- January 28, 2026 (Wednesday): JUP (JUP) unlocks $10.33 M (1.70 % of market cap)