Forced Selling Crash Sends Bitcoin to a New 15-Month Low as Ethereum Breaks Down
5th February 2026 • 9mins read
- Bitcoin price sets new 15-month low under $73K as crypto liquidates $800M: Bitcoin dipped back under $73,000 after the Wall Street open, with Bitstamp briefly trading below $72,500 as sellers pushed price into late-2024 territory. CoinGlass liquidation data shows more than $800 million in 24-hour crypto liquidations during the move. (
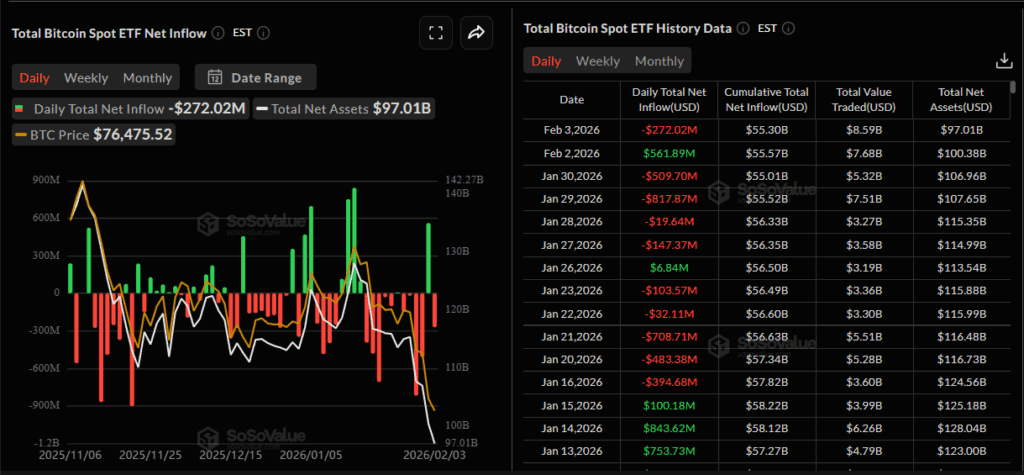
- Bitcoin ETF assets slip below $100B with fresh $272M outflows: Spot Bitcoin ETF assets fell below $100 billion after about $272 million of net outflows, and this was the first sub-$100 billion reading since April 2025 on SoSoValue data. The drawdown coincided with BTC sliding below $74,000 and total crypto market cap dropping from about $3.11 trillion to $2.64 trillion over the week, based on CoinGecko data.
- Bitcoin ETFs bounce $562M after $1.5B sell-off, as headwinds linger: Spot Bitcoin ETFs took in about $562 million on Monday, snapping a four-day outflow streak that totaled roughly $1.5 billion the prior week, based on SoSoValue data. BTC rebounded above $79,000 intraday, while a commonly referenced ETF create cost basis around $84,000 remained a near-term level traders watched for support.
- Weekend selloff wipes out $290 billion before bitcoin steadies: A thin-liquidity weekend rout erased nearly $290 billion of total crypto market capitalization, with Bitcoin and Ether bottoming near $74,674 and $2,164 before stabilising. The risk-off tone also hit broader markets, with U.S. equity futures and precious metals lower during the same window.
- Bitcoin falls below $80,000, continuing decline as liquidity worries mount: Bitcoin was down 6.53% at $78,719.63 (12:48 p.m. ET) after falling to as low as $81,104 the prior day, with traders focused on tighter-liquidity risk. Ether dropped 11.76% to $2,387.77 in the same session, extending the broader crypto risk-off move.
- Trump nominates Kevin Warsh for Fed chair as markets reprice “higher for longer” risk: President Donald Trump said he will nominate former Fed governor Kevin Warsh to succeed Jerome Powell, which added to the week’s risk-off tone across rates sensitive assets, including crypto. In the Senate, Republican Thom Tillis said he would block any Fed nominee until a Justice Department probe involving Powell is dropped, which could delay the confirmation process.
- Crypto market structure push hits a Senate milestone as the Agriculture Committee advances its bill: The Senate Agriculture Committee voted to advance a crypto market structure package after rejecting a series of amendments, putting the issue on a clearer legislative track. The House has its own framework bill, the Digital Asset Market Clarity Act of 2025 (H.R. 3633), which outlines how digital assets could be classified and regulated.
- SEC and CFTC present a unified crypto agenda in a joint “harmonization” event: SEC Chair Paul Atkins and CFTC Chair Mike Selig held a joint session focused on aligning oversight and setting a coordinated agenda for digital asset markets. The CFTC said the event was designed to discuss agency harmonization and U.S. crypto policy priorities under the current administration.
- BlackRock files for an iShares Bitcoin Premium Income ETF that targets covered call yield on IBIT: BlackRock filed to launch an income focused bitcoin ETF designed to generate monthly premium income by selling covered call options primarily on IBIT shares while holding IBIT shares as collateral. The structure is built to monetise bitcoin volatility, but the covered call profile can cap upside during sharp rallies.
- Fidelity launches Fidelity Digital Dollar (FIDD) stablecoin for retail and institutional clients: Fidelity announced FIDD is now available, issued by Fidelity Digital Assets, National Association, and redeemable 1:1 for U.S. dollars through Fidelity. Fidelity said it will publish end of day disclosures covering circulating supply and reserve net asset value, and the token runs on Ethereum.
- CME Group considers launching a “CME Coin” as it pilots tokenised collateral: CME signalled it is exploring a proprietary digital token for margin and settlement as tokenised cash collateral becomes a priority for market infrastructure. The initiative sits alongside its blockchain work with Google Cloud’s Universal Ledger, and it is framed as institutional grade collateral that could reduce counterparty friction in stressed markets.
- Hyperliquid beats Bitcoin and XRP with double digit gains as HYPE jumps about 71% in two weeks: HYPE decoupled from the broader drawdown, pushing to roughly $35 while majors stayed under pressure, as activity rotated into decentralised derivatives. The rally is tied to product expansion (including HIP upgrades) that broaden the set of markets Hyperliquid can list and monetise, pulling volume toward onchain perps during volatility.
- Bitcoin mining profit crisis deepens as difficulty is projected to drop about 14% on Feb. 8, 2026: The next retarget is tracking a roughly 14% difficulty cut after hashrate weakness stretched block production, pushing average block times above the 10 minute target. That adjustment is short term margin relief for miners, but it also highlights how quickly network economics tighten when hashrate falls during a price drawdown.
- Binance to convert the SAFU fund’s $1B stablecoin reserves into Bitcoin within 30 days: Binance said it will rotate $1 billion of SAFU reserves into BTC and rebalance if the fund’s value drops below $800 million due to price moves. In practice, this creates a scheduled source of spot demand, but it also increases SAFU’s sensitivity to BTC volatility compared with stablecoin reserves.
- Step Finance treasury wallets breached, about 261,854 SOL moved as STEP collapses: Step Finance disclosed a compromise of treasury wallets, with onchain movement of roughly 261,854 SOL (around $27 million to $29 million depending on timestamped pricing) and an immediate confidence shock across the token. The incident matters beyond STEP because it is a Solana-native security headline that can spill into broader Solana sentiment, especially in a weak tape.
- Analyst slashes Strategy (MSTR) price target by about 60% as leverage optics worsen: Strategy’s price target was cut to $185 from $474 while the rating stayed constructive, reflecting how quickly equity upside compresses when BTC volatility spikes. The move refocuses attention on the company’s market premium versus its bitcoin holdings and the sensitivity of that premium during drawdowns.
- Ripple lands a full EU electronic money institution licence in Luxembourg: Ripple secured authorisation from Luxembourg’s regulator to operate as an electronic money institution, which is a key regulatory step for payments and issuance activities in the EU. The licence strengthens Ripple’s ability to scale regulated payment flows across member states under a single supervisory framework.
- Hong Kong regulator targets March 2026 for its first stablecoin issuer licences: Hong Kong’s monetary authority said it plans to grant the first batch of stablecoin licences in March 2026, with only a limited number approved initially. The licensing review focuses on use cases, reserve backing, risk controls, and anti money laundering standards, which sets the bar for who can operate at scale.
- White House talks fail to resolve the stablecoin yield fight, sets an end of February deadline: A closed door White House meeting between banks and crypto groups did not produce agreement on whether stablecoins should be allowed to offer interest or rewards. The administration set an end of February deadline to find compromise language, with market structure legislation still stuck until that issue is settled.
- Bitcoin hashrate drops about 12% in the sharpest drawdown since the 2021 China mining ban: Network hashrate fell roughly 12% from mid November levels, marking the largest pullback since late 2021, as disruptions hit U.S. mining operations. A lower hashrate can slow block production and pressure miner margins, which can amplify stress during
Bitcoin Market Analysis
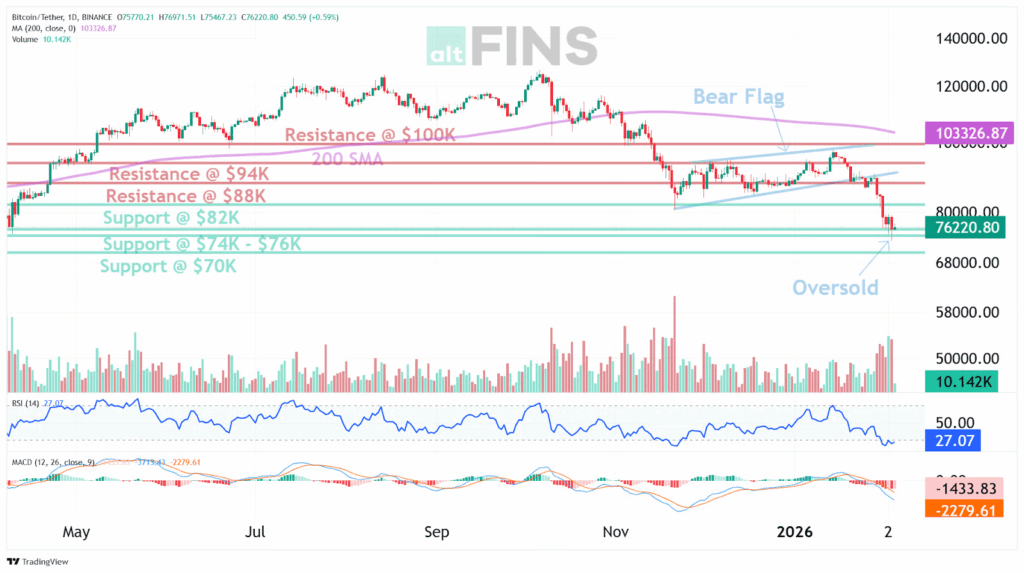
A sharp repricing was recorded across the week, with daily closes sliding from $84,235.5 on Jan 30 to $73,137.0 on Feb 4, and a close of $73,016.2 being listed on Feb 5. Over the same seven day window, a high of $84,705.1 and a low of $71,913.4 were posted, confirming that late week trading was conducted near the bottom of the range. A new 15 month low under $73,000 was also reported during the move, with Bitstamp briefly printed below $72,500. More than $800,000,000 in 24 hour crypto liquidations was reported around that downside extension, which aligned with the week’s heavy forced selling conditions.
Source: https://altfins.com/technical-analysis
Oversold signals were reinforced by multiple oscillators, with RSI-14 shown below 30 and an RSI reading of 27.07. Bearish momentum was also indicated by MACD, with negative readings being listed and the MACD line having been described as below its signal line for several weeks. Elevated volatility was reflected by ATR near $3,581.98, and wide daily ranges were evidenced by intraday prints spanning the low $71,000s to the mid $70,000s. Bollinger Bands were also shown as wide, with the lower band near $72,837.62 and the upper band near $97,769.35, which placed spot near the lower envelope during the selloff.
The breakdown below $82,000 was treated as the structural pivot, with the prior range of $82,000 to $94,000 having been described as resolved to the downside. The $74,000 to $76,000 zone was framed as the nearest support band now being tested, with $70,000 marked as the next lower support if acceptance below the current base is sustained. Overhead supply was defined at $82,000, with additional resistance bands at $88,000 and $94,000. A higher cap was also identified by the 200 day average region, with the 200 SMA shown near $103,326.87, leaving mean reversion levels well above spot.
Near term expectations have been best framed as conditional rather than directional, given the combination of a strong downtrend and oversold readings. A bounce setup has been supported by the oversold at support framework, where RSI below 30 near a mapped support zone has historically been associated with a higher probability of a near term rebound, although timing certainty has not been available. Any stabilization case has been strengthened only if closes are held above the $74,000 to $76,000 band, while a downside continuation case has been strengthened if sustained closes are recorded below $70,000. A recovery attempt would be treated as more credible only if $82,000 is reclaimed and held, because that level has been converted from support into supply during the breakdown.
Source: https://sosovalue.com/assets/etf/us-btc-spot
ETF flow dynamics were aligned with the risk off tape. Across the last seven ETF sessions listed, net outflows of about $1.20 billion were recorded, with the largest single day outflow listed at $817.87 million, while a one day rebound inflow of $561.89 million was also listed without a sustained reversal being confirmed. ETF assets were reported as having slipped below $100B after about $272.02 million of net outflows, and the prior session was reported as having delivered an ETF bounce of about $562 million following a multi day outflow streak.
The broader backdrop was characterized by fragile liquidity and forced selling, and it was reinforced by several concurrent stress indicators. A thin-liquidity weekend rout was reported as having erased roughly $290,000,000,000 of total crypto market capitalization before stabilization was seen. Network conditions were also placed on watch after a hashrate drop of about 12 percent since mid November was reported, and the tape was framed as being weighed by liquidity worries as the decline extended below $80,000. A near-term rebound has remained possible given oversold conditions near support, but durability has remained unproven until $82,000 is reclaimed and held, and uncertainty on timing has needed to be stated plainly while trend and flows remain adverse.
Ethereum Market Analysis
A sharp repricing was recorded across the week, with daily closes sliding from $84,235.5 on Jan 30 to $73,137.0 on Feb 4, and a close of $73,016.2 being listed on Feb 5. Over the same seven day window, a high of $84,705.1 and a low of $71,913.4 were posted, confirming that late week trading was conducted near the bottom of the range. A new 15 month low under $73,000 was also reported during the move, with Bitstamp briefly printed below $72,500. More than $800,000,000 in 24 hour crypto liquidations was reported around that downside extension, which aligned with the week’s heavy forced selling conditions.
Source: https://altfins.com/technical-analysis
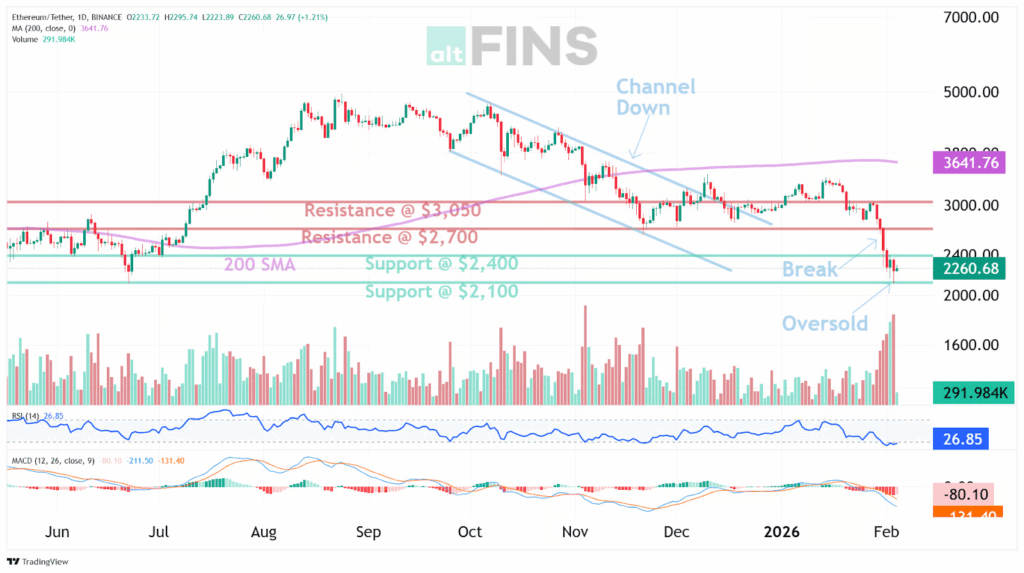
Oversold conditions were confirmed by RSI(14) readings shown below 30, while bearish momentum was reinforced by a bearish MACD configuration in the same indicator set. A Strong Sell technical posture was also presented on ETH technicals, with moving averages being described as uniformly bearish across the standard ladder. Volatility was indicated as elevated by ATR near 179.67, while the Bollinger envelope was presented with a lower band near 2,083.49 and an upper band near 3,464.62, which placed price near the lower region of the envelope and aligned with the oversold signal.
Key levels were defined by support near 2,100 followed by 2,000, while resistance was identified near 2,700 followed by 3,050, and the structure was kept consistent with a downtrend after the loss of 2,700. A tactical rebound profile was supported by oversold momentum near support, but durability could not be confirmed without higher daily closes being established and momentum readings being improved. A downside invalidation for the immediate support thesis was represented by sustained acceptance below 2,100, while a clean loss of 2,000 was expected to deepen downside risk by placing price beneath the nearest defined demand band.
Source: https://sosovalue.com/assets/etf/us-eth-spot
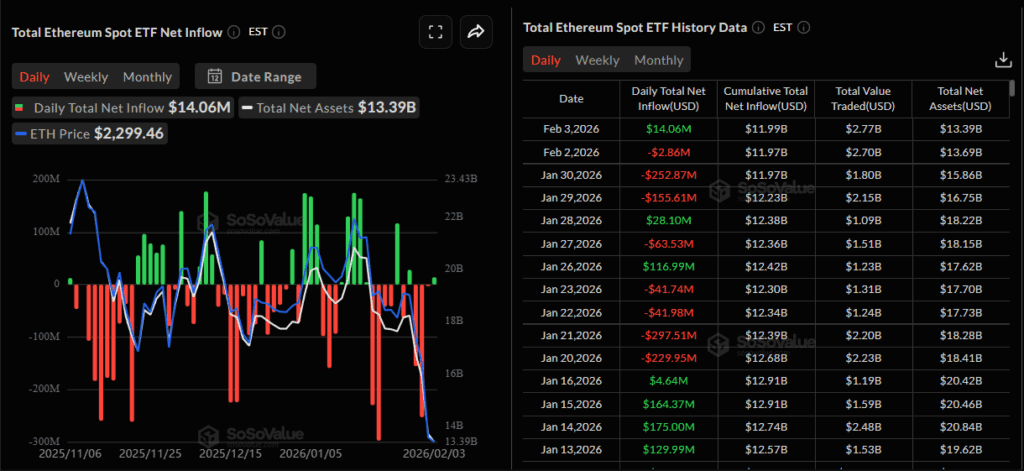
Spot ETH ETF positioning was dominated by outflows across the late January selloff days, while the most recent reported session was marked by a modest inflow that did not reverse the broader drawdown in net assets. A net inflow of about $14.06 million on Feb 3 was reported for spot ether ETFs in coverage referencing SoSoValue, as described in ETF inflows. Total net assets near $13.388 billion and cumulative net inflow near $11.986 billion were also reported as summarised in net asset data. The flow profile was therefore kept consistent with de risk positioning into a technical breakdown, with only limited evidence of near-term stabilisation having been presented by the latest daily print.
A constructive medium term adoption driver was introduced through the launch of Fidelity Digital Dollar (FIDD), which was described as a USD stablecoin issued by Fidelity Digital Assets, National Association, made available for purchase and redemption at 1 to 1, and deployed on Ethereum, with end of day disclosures described for circulating supply and reserve net asset value in Fidelity FIDD. A supportive narrative for Ethereum settlement usage was strengthened by that launch detail, but near term direction was still governed primarily by the broken 2,700 zone overhead, the 2,100 to 2,000 support band beneath, and the persistence of oversold yet bearish momentum. Any linkage to tariffs, China policy responses, or U.S. dollar dynamics could not be verified from the provided inputs and was therefore treated as uncertain.
Bitcoin Hashrate Drawdown
Recent coverage has highlighted a sharp drawdown in Bitcoin’s network hashrate, with the move often framed as unusually large versus typical week to week variation. The most consistent explanation for this kind of step down is a short-lived reduction in miner uptime, where weather, grid constraints, or curtailment programs can take meaningful capacity offline quickly and then bring it back once conditions normalise. That is a different signal from a slow, structural decline, which would usually be associated with a sustained exit of marginal operators over multiple difficulty cycles.
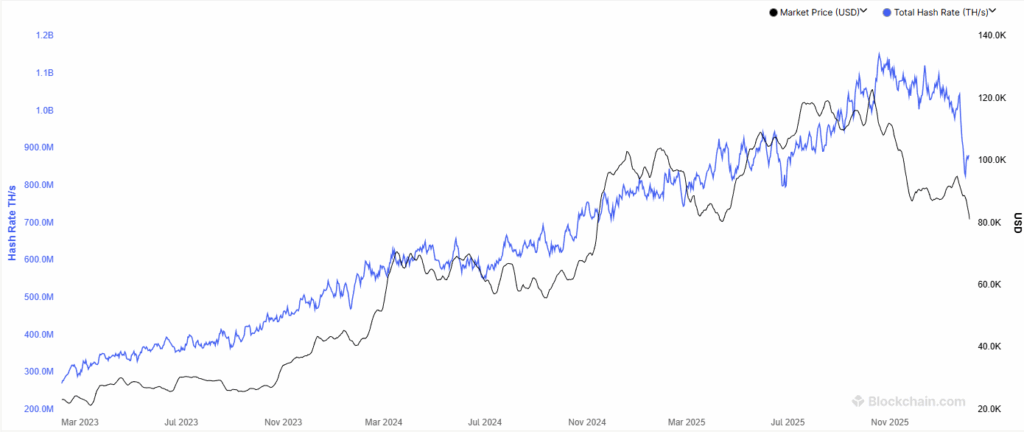
Source: https://www.blockchain.com/explorer/charts/hash-rate
The question of whether the drawdown should be treated as worrying is therefore a question of persistence and economics. A temporary hashrate dip tends to be self-correcting through the difficulty mechanism, because slower blocks are followed by lower difficulty at the next reset, which improves revenue per unit of hashrate for miners who remain online. Concern rises when the hashrate remains depressed after the reset window and when unit economics stay weak, because that combination points to margin stress rather than a pure uptime event.
Source: https://www.blockchain.com/explorer/charts/miners-revenue
At the same time, miner revenue has also pulled back, which is the more actionable linkage to market supply. Mining is a cash-cost business, so when revenue compresses, the share of newly mined BTC that must be sold to fund operations tends to rise, and the weakest balance sheets can be pressured to reduce reserves during sustained stress. The practical read-through is that the hashrate headline is best treated as a prompt to monitor miner economics closely, because persistent revenue weakness is the condition that most directly increases the probability of incremental spot supply from miners.
Mark Your Calendars
Economic Data Releases:
- February 11, 2026 (Wednesday): CPI and Core CPI
Token Unlock
- February 5, 2026 (Thursday): ENA (ENA) unlocks US$23.00 M
- February 6, 2026 (Friday): HYPE (HYPE) unlocks US$350.46 M
- February 6, 2026 (Friday): BERA (BERA) unlocks US$27.60 M
- February 10, 2026 (Tuesday): APT (APT) unlocks US$13.80 M
- February 11, 2026 (Wednesday): AVAX (AVAX) unlocks US$16.15 M