Risk-Off Regime Deepens as Liquidity Thins and Derivatives Stress
Key Numbers:
Bitcoin $64,827 (-17.55%) Ethereum $1,897 (-22.38%)
1-month return
Total Crypto Market Cap $2.38T (-16.20%)
2026 returns
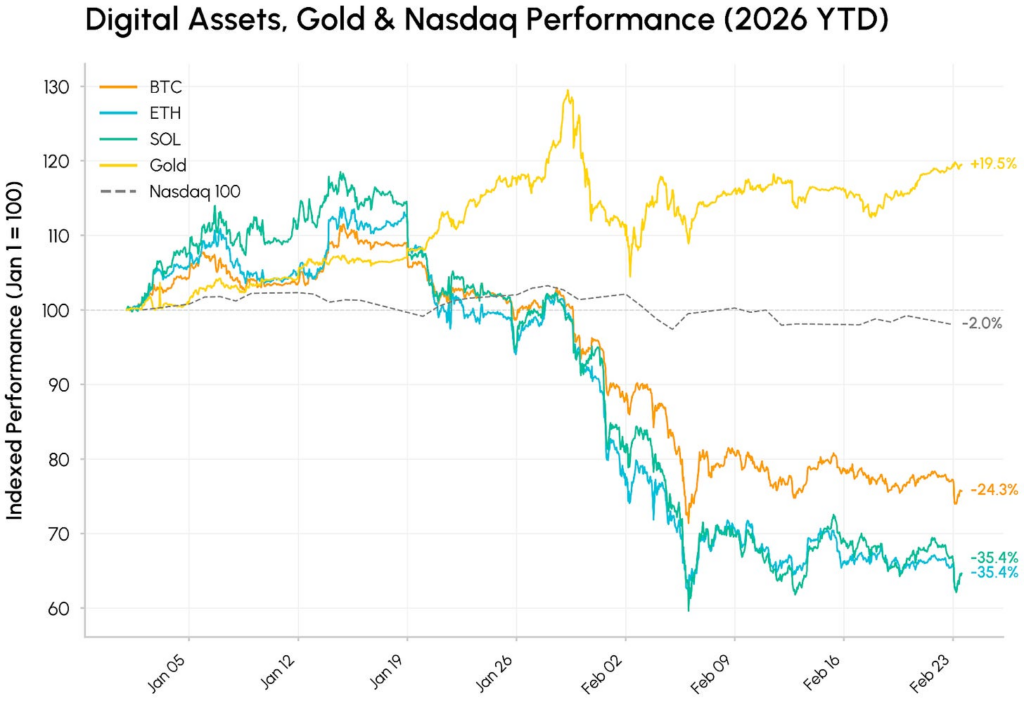
Bitcoin –26.27% Ethereum –36.39% Gold 20.92%
NASDAQ -2.47% S&P500 0.49%
Key Takeaways
- February 2026 was described as a risk off month that continued the post October 2025 correction in digital assets, including an early month dislocation and signs of thinner liquidity.
- Institutional demand indicators cited in the report were described as weak or negative, including a negative Coinbase premium and persistent spot Bitcoin ETF outflow.
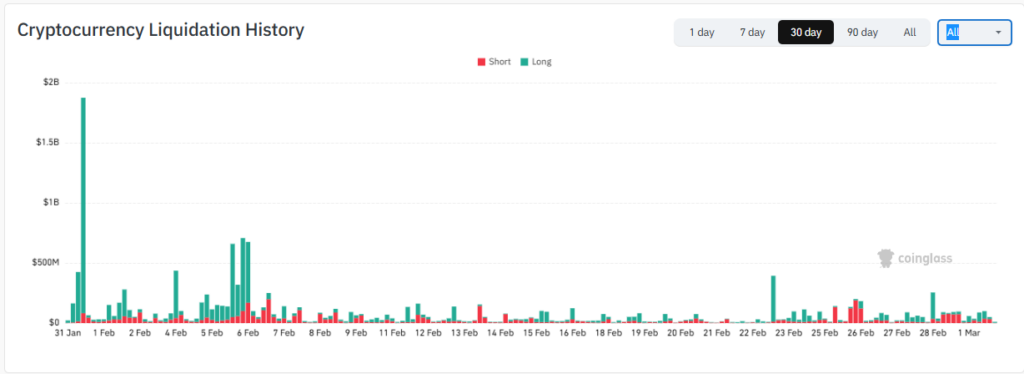
- Market structure stress was most visible in derivatives, with large liquidations reported, including a figure of $2.56 billion in Bitcoin liquidations over “recent days,” and thin weekend liquidity described as amplifying moves.
- Macro drivers remained central: the report cites a 3.50% to 3.75% fed funds target range corridor as of February 28, 2026, and the January 2026 CPI release (published February 13, 2026) showing CPI +0.2% m/m and +2.4% y/y, core +0.3% m/m and +2.5% y/y, plus February 18, 2026 FOMC minutes keeping the range with two dissents favoring a 25 bp cut.
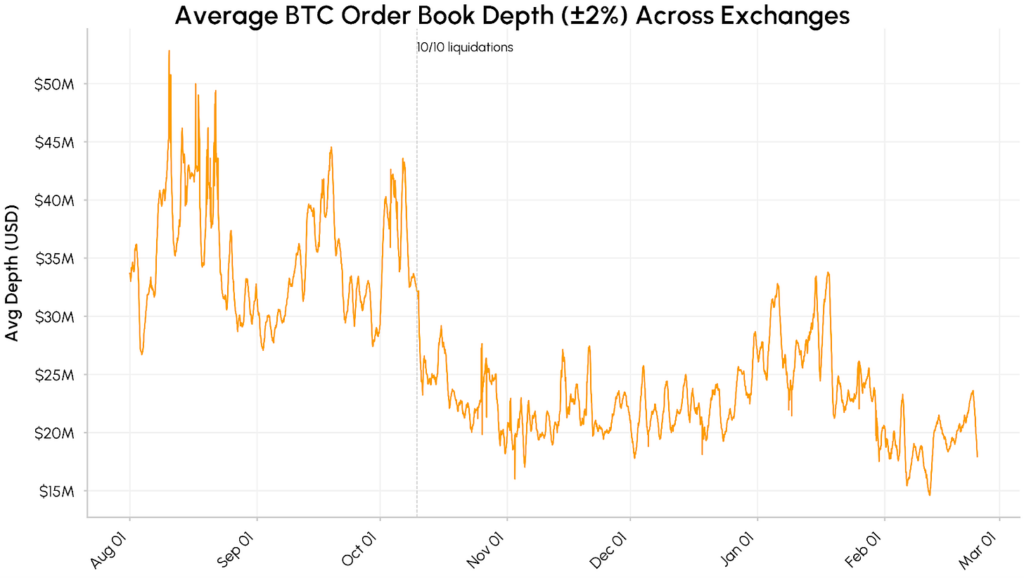
- Liquidity and flow metrics were framed as softer: reported spot BTC order book depth within plus or minus 2% fell from about $40 million to $50 million in Aug to Oct 2025 to about $15 million to $25 million, with further thinning noted in February, alongside slowing stablecoin growth since December.
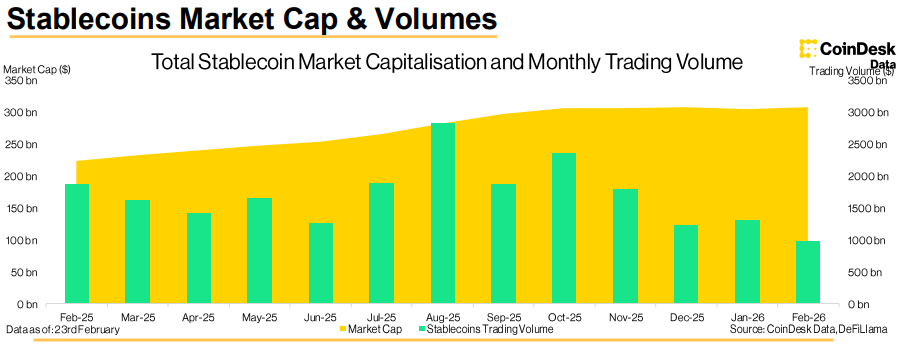
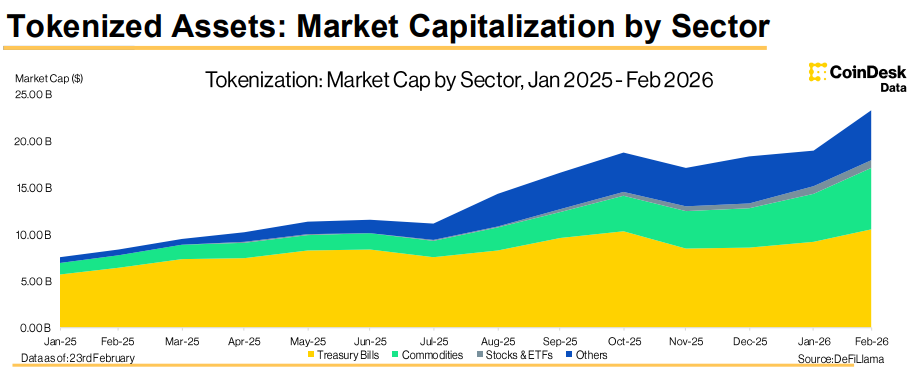
- Stablecoins and tokenized assets expanded despite the drawdown: the report cites stablecoins trending to $309 billion (up 0.98%), dominance rising to 13.3% from 11.2% in January, and centralized exchange stablecoin pair volume at $982 billion as of February 23, plus tokenized assets reaching $23.35 billion (up 22.9% month over month).
- Regulation and institutional market infrastructure stayed active: the report notes U.S. actions and engagement around event contracts and crypto market structure (CFTC, SEC), an OCC preliminary conditional approval tied to a national trust bank charter application, and CME first trades in new regulated altcoin futures (ADA, LINK, XLM) beginning February 9.
Interest Rates and Inflation Data
FRED data for the Federal Funds Target Range indicate a 3.50% to 3.75% policy corridor on February 28, 2026 (lower limit 3.50%, upper limit 3.75%). The U.S. Bureau of Labor Statistics published the CPI release for January 2026 on February 13, 2026. CPI U increased 0.2% in January on a seasonally adjusted basis and was up 2.4% over the prior 12 months (not seasonally adjusted), while CPI all items less food and energy rose 0.3% in January and 2.5% over the prior 12 months, as stated in the CPI summary. The release also noted that October and November 2025 data values were not available due to the 2025 lapse in appropriations as noted in the same CPI summary.
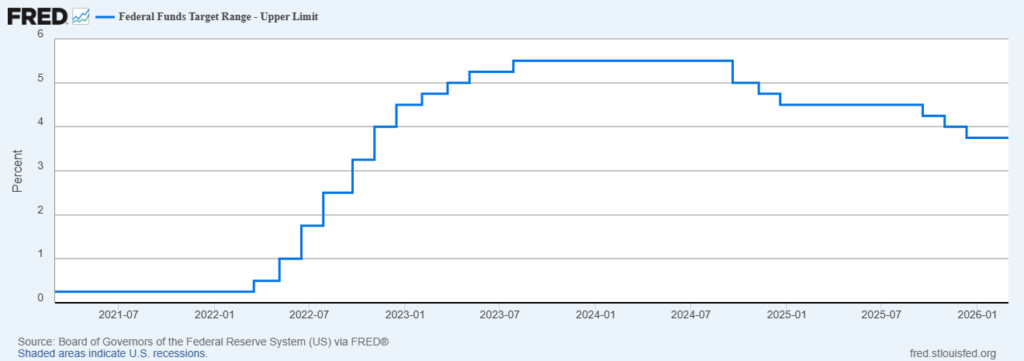
Source: https://fred.stlouisfed.org/series/DFEDTARU
The Federal Reserve released minutes from the January 27 to 28, 2026 FOMC meeting on February 18, 2026. The minutes report that the Committee maintained the federal funds target range at 3.50% to 3.75%, with two dissenting votes (Stephen I. Miran and Christopher J. Waller) favoring a 25 bp cut. The minutes also state that policy was not on a preset course and that future adjustments would depend on incoming data, the evolving outlook, and the balance of risks, and they note uncertainty related to delays in statistical releases and data quality.
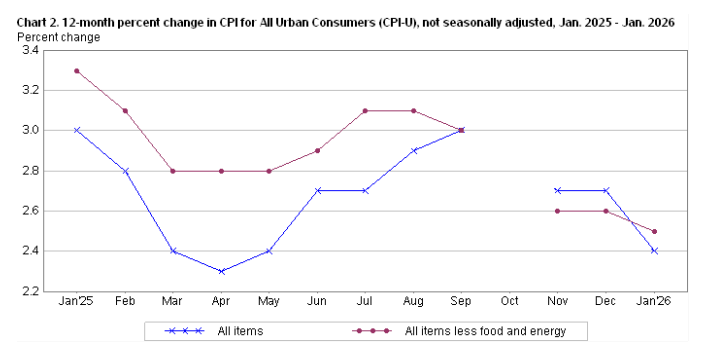
Source: https://www.bls.gov/news.release/pdf/cpi.pdf
USD Strength and Policy Uncertainty
A February 23, 2026 commentary argued that the U.S. dollar had lost some safe-haven appeal relative to 2024 and attributed the shift to trade-policy volatility, tariff threats, and concerns about political pressure on the Federal Reserve. The same commentary framed the setup as cyclical rather than structural and warned that a larger confidence shock could occur if markets perceived Federal Reserve independence to be materially undermined.
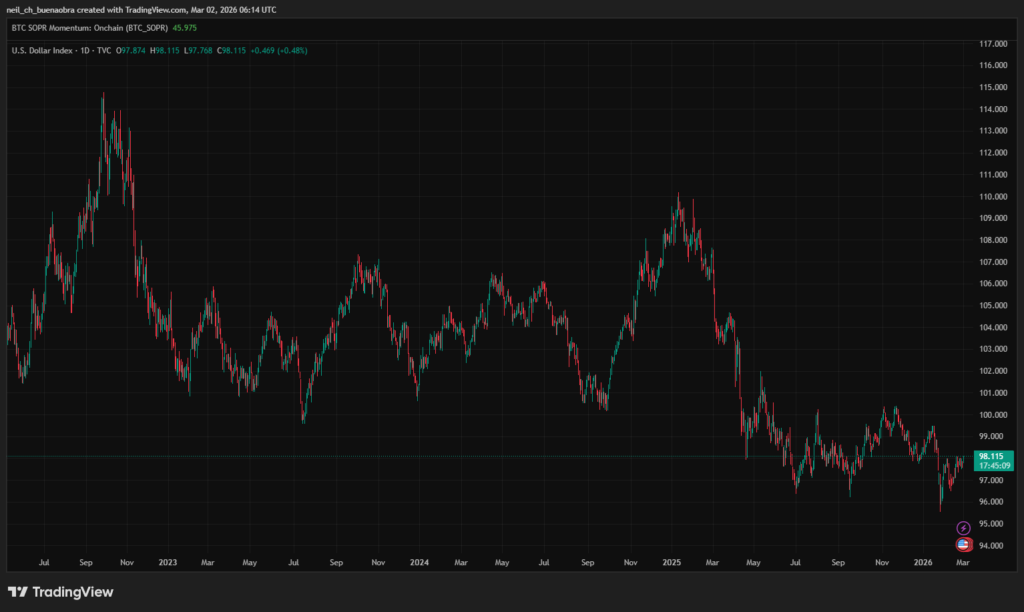
Source: https://www.tradingview.com/chart/2siDZm6r/?symbol=TVC%3ADXY
It was also reported that the U.S. dollar index fell nearly 10% in 2025, which was framed as a key macro backdrop entering February 2026. The decline was treated as supportive of a broader narrative shift, where dollar weakness had become a central theme in macro positioning and risk sentiment discussions.
At the same time, it was noted that the move was characterized as cyclical not structural, with no clear evidence cited for accelerated de dollarization in global financial metrics. It was further indicated that a more severe confidence shock could emerge if markets perceived Fed independence to be materially undermined.
Crypto Price Action and Risk Transmission
Multiple February narratives described crypto trading as high beta, strongly conditioned by broader risk appetite and liquidity. A widely reported early month episode described Bitcoin trading below $80,000 after a weekend drop, after massive Bitcoin liquidations, and the drawdown was linked to broader risk asset weakness and macro headlines.
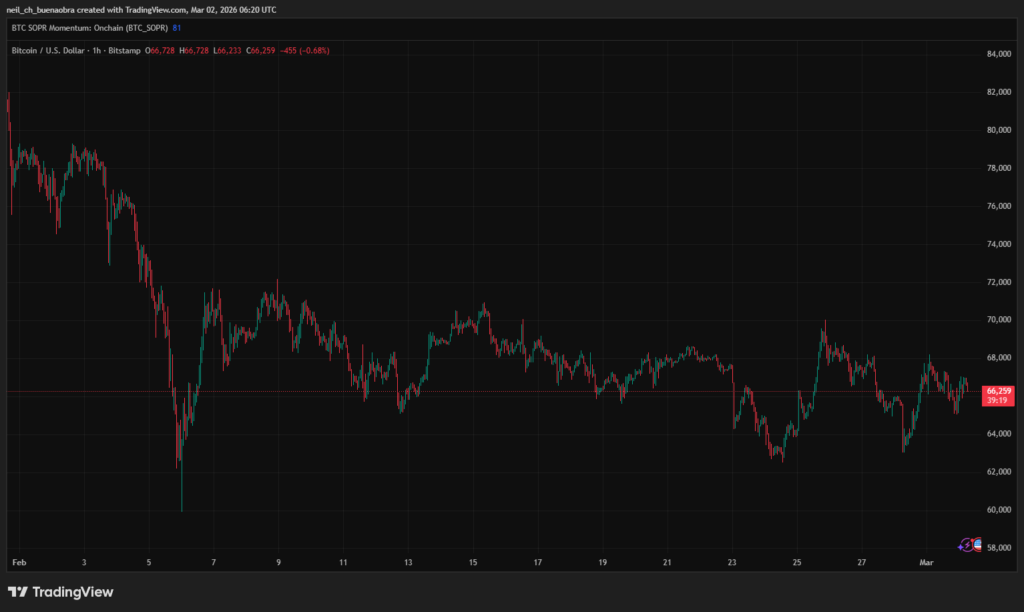
Source: https://www.tradingview.com/chart/2siDZm6r/?symbol=BITSTAMP%3ABTCUSD
The same risk transmission framing was extended to Ethereum, where selloff pressure was described as spilling into large cap alt exposure during the same risk off window. In the February 24 market update, the broader correction was described as having pushed ETH down materially from prior cycle highs, with ETH cited as down about 34% from its peak, alongside similar magnitude drawdowns in other majors, which was presented as evidence that stress was not isolated to BTC. This risk transmission channel was described as part of a correction from October 2025 highs.
Source: https://coinmetrics.substack.com/p/state-of-the-network-issue-352
A February 24 market update described Bitcoin briefly breaking below $61,000 during a February 5 to 6 selloff and characterized the broader market as continuing a correction from October 2025 highs. The same source emphasized softer demand signals, including a negative Coinbase premium, ETF outflows, and slowing stablecoin growth, with the combined backdrop framed as a thinner liquidity regime that can amplify dislocations when volatility hits.
Key Events
February 2026 developments were consolidated across macro and derivatives volatility, protocol and market structure milestones, centralized exchange operations, and legal, regulatory, and compliance actions. The emphasis remained on reported facts, with market impact treated as not stated where the cited source did not quantify it.
Early month conditions were shaped by leverage stress and sharp de risk flows. A broad selloff and liquidations reported reinforced how forced deleveraging can amplify downside when liquidity is thin. Operational resilience also remained salient, with a short service disruption highlighting execution and access risk during volatile windows.
Source: https://www.coinglass.com/liquidations
Protocol and market plumbing items were treated as medium term structure rather than immediate catalysts. Mina outlined a Mesa upgrade as a planned roadmap milestone with execution and coordination risk as the primary lens, while CME confirmed altcoin futures as an expansion of regulated hedging tools tied to ADA, LINK, and XLM exposure.
Macro and policy inputs remained central to cross asset repricing even where crypto specific reactions were not attributed in the primary releases. The January CPI release provided the inflation prints feeding rates and FX expectations, and the Fed minutes released preserved policy signaling that can shift risk sentiment and correlations. Regulatory and compliance boundary setting also featured prominently, including a CFTC prediction advisory on event contracts, an OCC related conditional approval tied to a trust bank charter pathway, a Step Finance shutdown announced after a theft, and Binance facing sanctions allegations.
Demand and Liquidity Signals
A February 24 State of Network market update characterized February as a weaker demand, thinner liquidity environment, with “risk off” conditions leaving digital assets more vulnerable to shocks. A persistently negative Coinbase Premium Index (BTC/USD on Coinbase versus BTC/USDT on Binance) was highlighted as a proxy for muted U.S. spot demand, and it was discussed alongside spot Bitcoin ETF net outflows as corroborating signals of reduced institutional participation.
Source: https://coinmetrics.substack.com/p/state-of-the-network-issue-352
In the same time, liquidity conditions were quantified via average spot BTC order book depth across major exchanges, measured within plus or minus 2% of mid price, which was reported to have fallen from roughly $40 million to $50 million in August through October 2025 to a sustained $15 million to $25 million range, with additional thinning noted in February. Stablecoin supply growth was also described as slowing since December, with the combined market cap of USDT and USDC stated as hovering around $260 billion, and the broader risk lens emphasized that fragile liquidity can magnify dislocations when volatility events hit.
Stablecoin Market Size and Composition
The Stablecoins and Tokenized Assets report described February conditions as supportive of incremental stablecoin expansion versus January, with the total stablecoin market characterized as being on trend to rise by 0.98% to $309 billion, and the increase was framed as occurring alongside a drawdown in major digital asset prices amid geopolitical uncertainty. Stablecoin dominance was described as having increased to 13.3% from 11.2% in January, and centralized exchange stablecoin pair trading volume was reported at $982 billion as of February 23, while overall activity for the month was described as trending lower than January.
Source: https://data.coindesk.com/reports/stablecoin-cbdcs-report
USDC was presented as a key driver of composition changes within stablecoins. The report stated that USDC market capitalization increased 6.39% to $74.5 billion, described as the first increase in three months, and it also reported that USDC’s share of trading volume reached an all time high of 19.7% in February. That gain was attributed largely to a collapse in FDUSD activity, with FDUSD centralized exchange pair volumes reported as having fallen 86.7% in February following Binance’s decision to end zero fee trading for key FDUSD pairs.
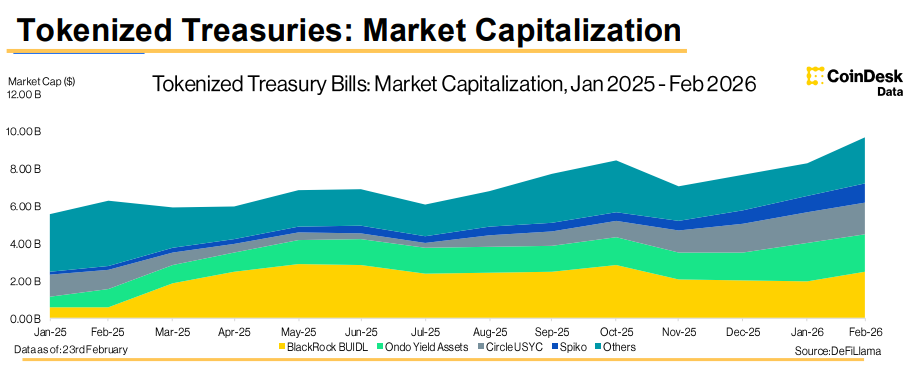
Tokenized assets were positioned as a continuing structural theme. The total tokenized market capitalization was reported to have reached a new all time high of $23.35 billion by late February, representing 22.9% month over month growth from $19 billion in January, with tokenized Treasuries and commodities described as the largest contributing sectors. Within tokenized equities, Ondo issued tokenized equities were reported as up 2.68% to $316 million and Backed issued tokenized equities were reported as up 3.04% to $218 million, and Ondo’s GOOGLon was described as having overtaken Backed’s TSLAX as the largest tokenized equity by market cap, with GOOGLon cited at $52.6 million.
Source: https://data.coindesk.com/reports/stablecoin-cbdcs-report
Sector Performance
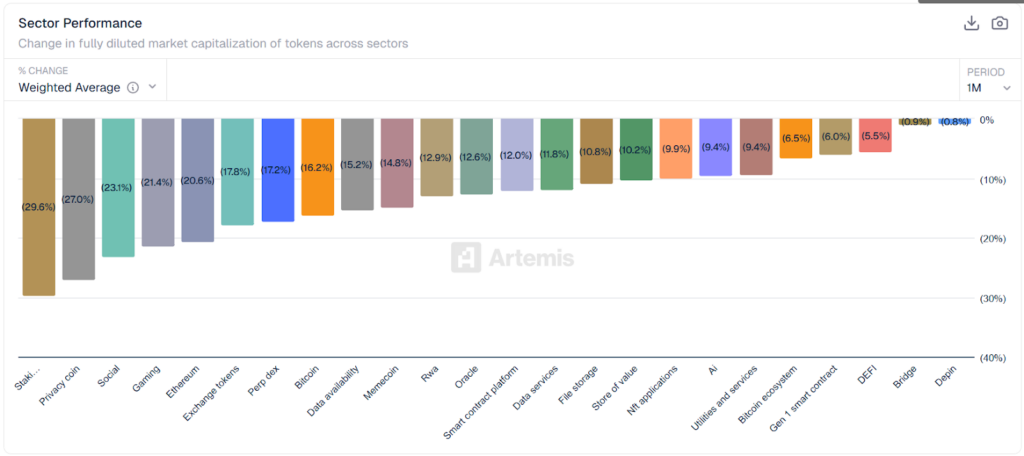
February sector performance was characterized by synchronized downside across crypto subsectors, with the month change in fully diluted market capitalization recorded as negative in every category tracked. The drawdown was framed in contemporaneous market coverage as being driven by a risk off backdrop and reduced marginal demand, where sustained spot Bitcoin ETF outflows, a negative Coinbase premium, and slowing stablecoin growth were cited as indicators of weaker institutional participation and thinner liquidity.
Source: https://app.artemisanalytics.com/macro
The steepest losses were recorded in higher beta segments, with Staking (-29.6%), Privacy coin (-27.0%), and Social (-23.1%) cited as the weakest sectors, followed by Gaming (-21.4%) and Ethereum (-20.6%). This concentration of weakness was consistent with narratives centered on leverage driven de risk events, where large liquidations were reported alongside descriptions of thin liquidity amplifying price moves during stress windows.
Additional sector specific pressures were also cited. Privacy coin weakness was repeatedly associated with elevated regulatory and compliance constraints, including exchange delistings and enforcement driven restrictions that were described as impairing liquidity access for privacy focused assets. Ethereum weakness was additionally linked in February reporting to derivatives forced selling and ETF related outflows, with coverage noting futures liquidation bursts and continued ETF redemptions during the month.
Market metrics and on-chain perps expansion
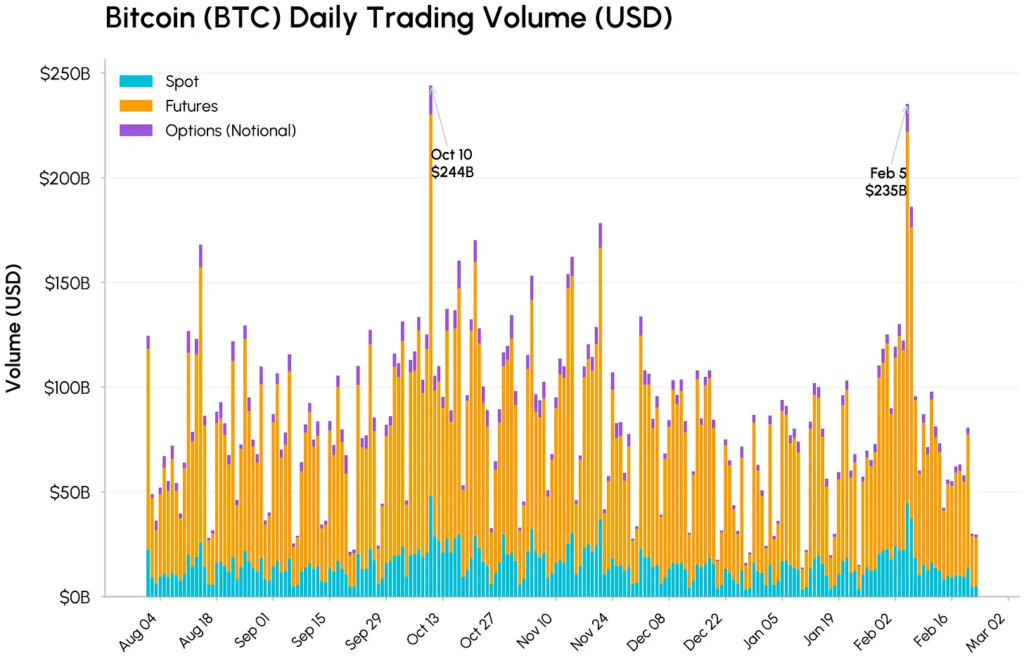
The February 24 market update cited volume spikes centered on February 5 as a stress day, when trading activity across spot, futures, and options was described as surging. Total BTC volume was reported at $235 billion that day, with futures volume at $177 billion, and spot volume was described as comparatively weaker than the prior high volume episode referenced in October, consistent with thinner liquidity conditions amplifying price dislocations.
Source: https://coinmetrics.substack.com/p/state-of-the-network-issue-352
The same update described on-chain perps as a clear growth pocket via Hyperliquid’s HIP 3 markets, with total HIP 3 perpetual volume reported as peaking at roughly $4.6 billion on February 5, driven primarily by commodities. Open interest was reported as rising from about $290 million at the start of January to a peak near $975 million by January 29, before consolidating around $830 million by late February, a pattern presented as continued demand for on-chain access to commodities, equities, and index exposures even as headline crypto prices corrected.
The same CoinDesk Data report stated that the market capitalization of tokenized equities issued by Ondo Finance rose 2.68% to $316 million and the market capitalization of tokenized equities issued by Backed Finance rose 3.04% to $218 million. These were treated as January to February month over month comparables because both February levels and percent changes versus January were explicitly stated. The figures were used as evidence of continued capitalization growth in tracked tokenized equity issuers even when broader spot markets were described as weaker. See: equities growth stated.
Source: https://data.coindesk.com/reports/stablecoins-tokenized-assets-report-february-2026
Derivatives, sentiment, and positioning
Early February conditions were framed around a sharp deleveraging episode. A major report liquidations cited at $2.56 billion in Bitcoin positions over recent days, and the move was linked to a broader risk asset selloff. Thin weekend liquidity was also referenced as a factor that can exacerbate price moves and accelerate liquidation cascades. Later month market structure commentary described leverage as having reset toward neutral conditions in perpetual markets. Neutral funding was interpreted as consistent with muted speculative appetite rather than renewed bullish conviction, aligning with the broader framing that positioning had cooled without a clear return of directional risk taking.
Sentiment and breadth were repeatedly presented as stabilization without recovery. The February 25 Week Onchain analysis framed BTC as range bound and emphasized weak market breadth, with spot CVD negative across major venues and ETF flows described as remaining in persistent outflow. Separately, the early month selloff was associated with a sharp fear regime, with the Crypto Fear and Greed Index plunged to very low readings during the episode.
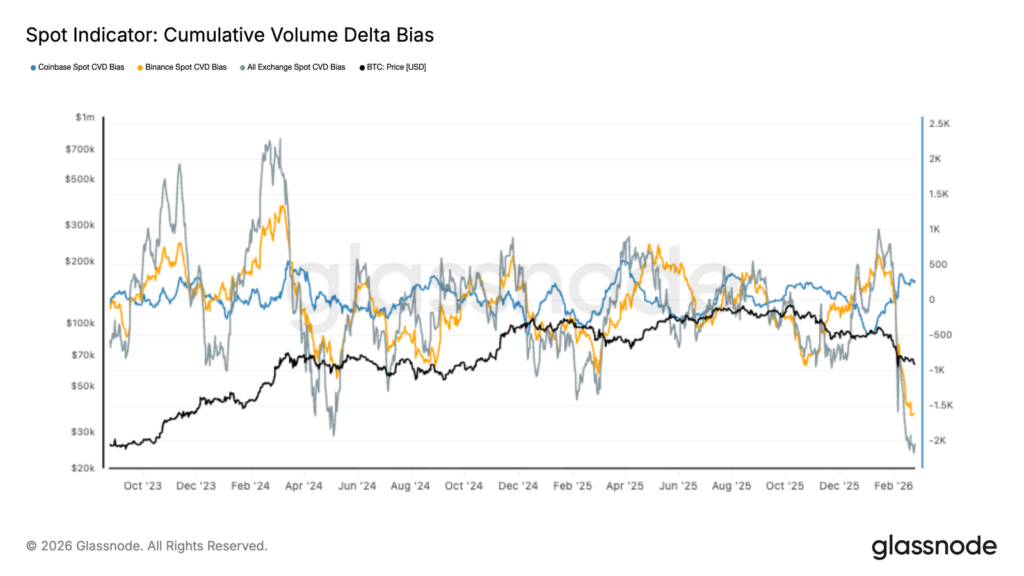
Source: https://insights.glassnode.com/the-week-onchain-week-08-2026/
Derivatives market expansion milestones were also highlighted as structural developments. CME announced first trades for new Cardano, Chainlink, and Stellar futures that began trading on February 9, expanding the regulated instrument set used for hedging and basis strategies beyond BTC and ETH, which becomes more relevant when funding, futures positioning, and liquidity conditions are central components of market stress.
Wrapping Up
February closed with a broad cooling in crypto risk appetite, consistent with the report’s framing of a continued correction from the October 2025 highs and a thinner liquidity regime. Weak or negative institutional demand indicators (negative Coinbase premium and persistent spot Bitcoin ETF outflows) combined with derivatives driven stress (large liquidations and volatility amplified by thin weekend liquidity) to keep market structure fragile. Even as stablecoins and tokenized assets expanded, the month’s price action and sector wide drawdown suggested investors were prioritizing capital preservation and liquidity over directional risk taking.
Looking ahead, the setups supports an expectation of continued cooling, especially if geopolitical uncertainty remains elevated and keeps cross asset correlations tight. In that environment, risk off positioning can persist, leaving crypto more sensitive to headline shocks and liquidity gaps, while macro inputs (rates path, inflation prints, and policy signaling) continue to dominate near term repricing. The net implication is a market that may stabilize at lower leverage and more neutral funding, but without clear evidence yet of a durable demand to rebound.