Fed Policy Cut, Quarter End Funding Tightness
31st December 2025 • 12 mins read
Key Numbers:
Bitcoin $87,918.96 (-3.86%) Ethereum $2,983 (-1.48%)
1-month return
Total Crypto Market Cap $3.19T (-4.08%)
2025 returns
Bitcoin –7.75% Ethereum -12.45% Gold 65.94%
NASDAQ 20.36% S&P500 16.39%
Key Takeaways
- December combined a 25 bps Fed cut to 3.50% to 3.75% with quarter-end funding tightness, $25.95 B at the standing repo facility on Dec 29, 2025.
- Flows stayed central, BTC spot ETFs flipped +$355.02 M (Dec 30) to -$348.10 M (Dec 31) and ETH spot ETFs netted about -$616.3 M for the month.
- Bitcoin finished lower after an early wide range, high $98,909.40 (Dec 3) and low $83,800.00 (Dec 1), then a slower grind into year end.
- Ethereum was a spike-and-retrace month, high $3,477.44 (Dec 10) and low $2,716.35 (Dec 1), ending near flat versus the open.
- ETF scale remained large despite choppy flows, BTC spot ETF net assets were $113.29 B on Dec 31, 2025 and ETH spot ETF net assets were $17.95 B.
- ETH redemptions were concentrated mid-month, with the largest daily outflows at -$224.78 M (Dec 15) and -$224.26 M (Dec 16).
- DeFi stress looked contained at the aggregate line, TVL moved from $117.74 B (Dec 1) to $116.71 B (Dec 31) despite incident headlines.
- Stablecoins held a large base around the cited anchors, roughly $303 B to $306 B, with USDC reported as more than $78 B in circulation by Dec 9.
- DeFi incidents were mostly idiosyncratic, including the Yearn yETH pool exploit (about $9 M, timestamped Nov 30) and smaller losses later in the month.
- Dispersion widened across sectors, with DePIN, staking services, data availability, gaming, RWA, AI and perp DEX among the weakest, while privacy and social led gains.
- Regulatory rails advanced via December actions from the CFTC, OCC, SEC staff documentation on DTCC Tokenization Services, and FDIC GENIUS Act procedural steps (including Dec 19 Federal Register publication).
Macro Setting
The Federal Reserve cut the target range for the federal funds rate by 25 bps to 3.50% to 3.75% at the December 9 to 10, 2025 FOMC meeting, and framed next steps as data dependent while assessing the “evolving outlook” and “balance of risks.” In the same month, inflation data arrived with unusual gaps because the government shutdown disrupted collection and publication: the BLS CPI release for November 2025 reported headline CPI +2.7% y/y and core CPI +2.6% y/y, and explicitly noted that month to month CPI changes were not published because October data could not be collected retroactively. Labor market data also reflected the disruption but still provided a clear directional read: the BLS reported nonfarm payrolls +64,000 in November, with unemployment at 4.6% (and October household survey data not collected). For rates and USD liquidity expectations into year end, the key macro takeaway in December was a combined signal of a lower policy ceiling after the Dec 10 cut, disinflation continuing on a y/y basis in the CPI release, and softer, noisier labour indicators due to data interruptions, which tends to widen the range of plausible outcomes markets must hedge.
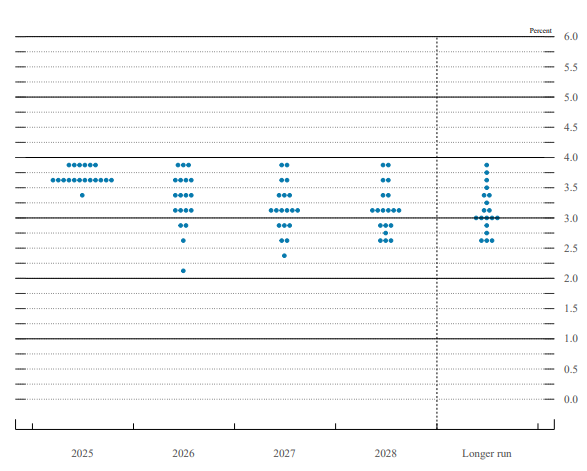
FOMC participants’ assessments of appropriate monetary policy
Source: https://www.federalreserve.gov/monetarypolicy/files/fomcprojtabl20251210.pdf
What changed versus November is that December’s market pricing had to digest policy and macro signals while short term funding conditions visibly tightened around quarter end. On December 29, 2025, banks borrowed $25.95 billion at the Fed’s standing repo facility (the Reuters report describes this as the third highest usage since 2021), a reminder that year end balance sheet constraints can matter even when the policy rate is moving down. The same Reuters report also said the Fed had ended balance sheet runoff and started buying short dated Treasuries, and had removed a daily cap on the repo facility, changes that speak directly to how cleanly reserves circulate through the system into year end. For digital assets, the practical implication is that December’s risk appetite was shaped by a two speed backdrop, easier headline policy at the margin (lower fed funds range) alongside episodic USD funding tightness around reporting dates, which typically increases the value of liquidity aware positioning, tighter risk limits, and cleaner hedging structures into January.
Bitcoin Breakdown
Bitcoin opened December at $90,373.90 on December 1, 2025 and closed at $87,501.88 on December 31, 2025, which corresponds to an about -3.18% month return using those daily open and close prints. The month’s intraday range was set early: the intramonth high was $98,909.40 on December 3, while the intramonth low was $83,800.00 on December 1. In practical terms, December read as a wide early range followed by a slower grind into year end, a pattern that often shows up when liquidity is thinner and participants prefer to manage risk through hedges and rebalancing rather than directional adds.
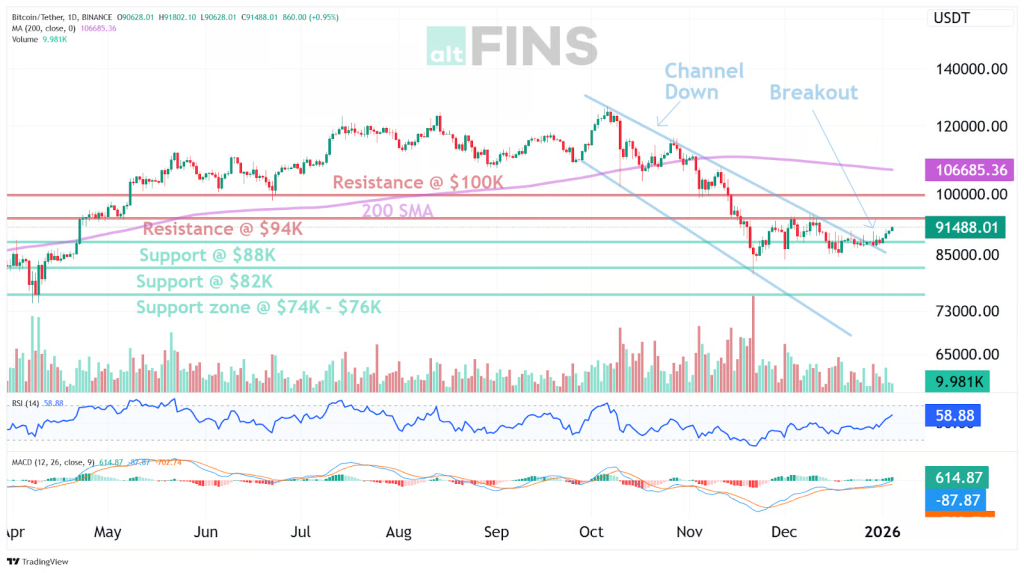
Source: https://altfins.com/crypto-screener/btc-bitcoin
In the US spot BTC ETF channel, late-December flows skewed negative even while AUM stayed large. The largest inflow in the window shown is +$457.29M on Dec 17, 2025, and the largest outflow is -$357.69M on Dec 15, 2025. The month ended with a sharp redemption print of -$348.10M on Dec 31, 2025, and on that same Dec 31 Total Net Assets (USD) of $113.29B, Cumulative Total Net Inflow (USD) of $56.61B, and Total Value Traded (USD) of $2.83B. The turn-of-month whipsaw is explicit: Dec 30 printed +$355.02M with Total Net Assets $114.44B and Total Value Traded $3.57B, then Dec 31 flipped to -$348.10M, while Dec 29 was only -$19.29M with Total Net Assets $113.07B and Total Value Traded $2.27B. This implies that December’s marginal flow turned into a headwind into year end, but the wrapper’s scale, shown by $113.29B of net assets at month end, meant daily creations and redemptions could still have an outsized impact on short-term pricing and hedging demand.
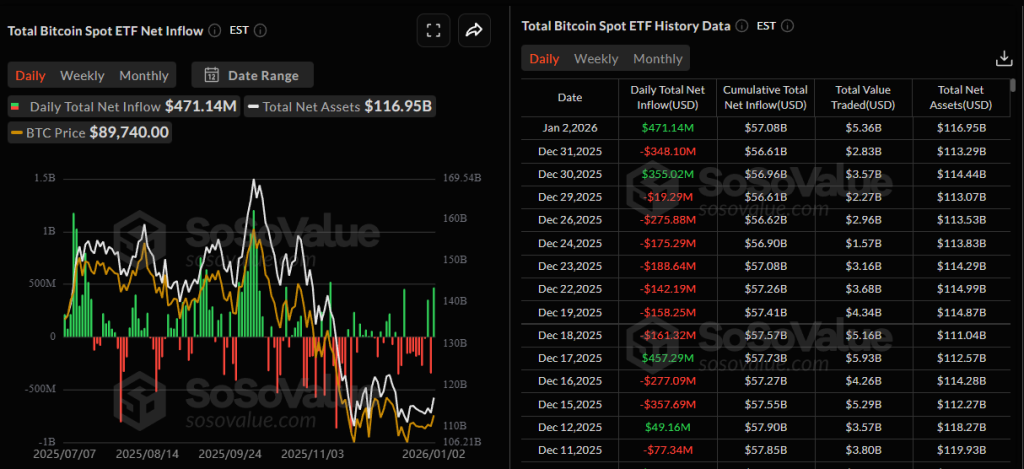
Source: https://sosovalue.com/assets/etf/us-btc-spot
The mechanism linking that flow pattern to price is best understood as a liquidity and hedging story rather than sentiment. When net redemptions dominate, the market has to intermediate the unwind through a mix of spot execution and derivatives hedges, and the burden is heavier when depth is thinner. The week-by-week sequence, especially the sustained net outflows in the second half of the month, fits a tape where the path of least resistance is choppy and slightly down unless discretionary buyers step in with size. The practical takeaway for January is that December left Bitcoin with a big, visible ETF holder base, but also showed that the marginal buyer can disappear quickly when liquidity tightens, which is exactly when hedging costs and execution discipline start to matter more than narratives.
Ethereum Breakdown
Ethereum opened December at $2,991.65 on December 1 and closed at $2,966.98 on December 31, for a monthly return of about -0.82%. The month’s intramonth high was $3,477.44 on December 10, while the intramonth low was $2,716.35 on December 1. Price action was therefore not a simple trend month, it was a down, spike, and retrace profile, where the close ended near the open despite large dispersion inside the month.
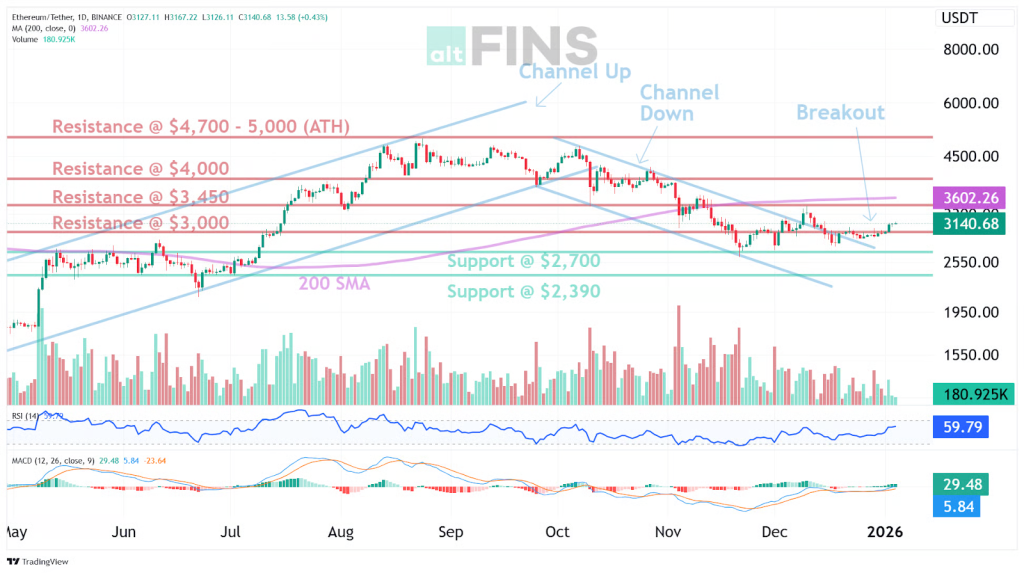
Source: https://altfins.com/crypto-screener/eth-bitcoin
US spot Ethereum ETF flow data was negative on net in December. Summing daily totals, gives a December net flow of about -$616.3M, and the week-by-week profile shows the pressure concentrated mid-month, with Dec 15–19 at about -$643.9M after a brief positive patch in Dec 8–12 at about +$209.1M. Spot ETH ETF history data shows the largest single-day redemption prints in the visible December window were -$224.78M on Dec 15 and -$224.26M on Dec 16, while the month ended with -$72.06M on Dec 31 after a rebound day on Dec 30 (+$67.84M) and a near-flat print on Dec 29 (-$9.63M). The largest inflow day shown in that window was Dec 22 (+$84.59M). At month end, Total Net Assets of $17.95B and Cumulative Total Net Inflow of $12.33B on Dec 31, 2025, with $808.11M of total value traded that day.
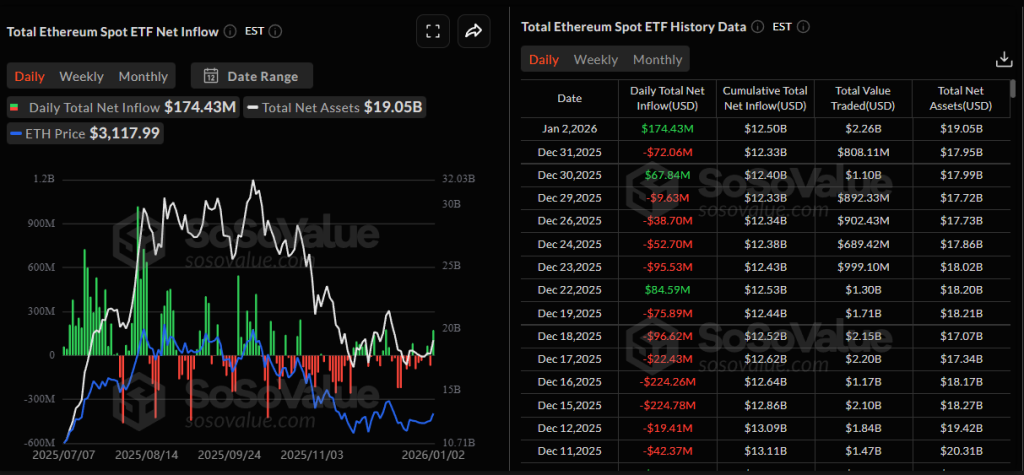
Source: https://sosovalue.com/assets/etf/us-eth-spot
How flow and hedging translated into price is mostly about plumbing, not narratives. Net ETF outflows are a headwind because redemptions tend to push inventory back into the market, either as spot selling or as hedges that remain in place until inventory is cleared, and both channels can tighten dealer balance sheets when liquidity is thin. December’s tape fits a regime where creations and redemptions can dominate marginal price discovery: the outflow block in the middle of the month was persistent, and the largest daily redemption prints sat inside that window, which is the kind of pattern that can cap rallies and deepen pullbacks even if broader positioning is not extreme.
On the network side, a confirmed December milestone was the Fusaka upgrade going live on Ethereum mainnet on December 3, 2025. The practical implication for market participants is that protocol execution continued schedule, which matters for allocator comfort even when price is range-bound, because it lowers the probability that “tech risk” becomes the gating factor for exposure sizing in the next quarter.
Altcoin Breakdown
Sector view shows broad weakness across most categories, with the deepest drawdowns concentrated in several high beta and infrastructure-adjacent themes rather than in memecoins or NFT-related buckets. DePIN led the declines at -18.3%, followed by Staking Services (-17.9%), Data Availability (-16.8%), Gaming (-16.3%), RWA (-16.2%), AI (-15.9%), Perp DEX (-15.5%), and Data Services (-15.0%). In the more sentiment-driven pockets, Memecoin finished -11.2%, while NFT Applications were down -9.5%, placing them in the middle of the drawdown pack for the period.
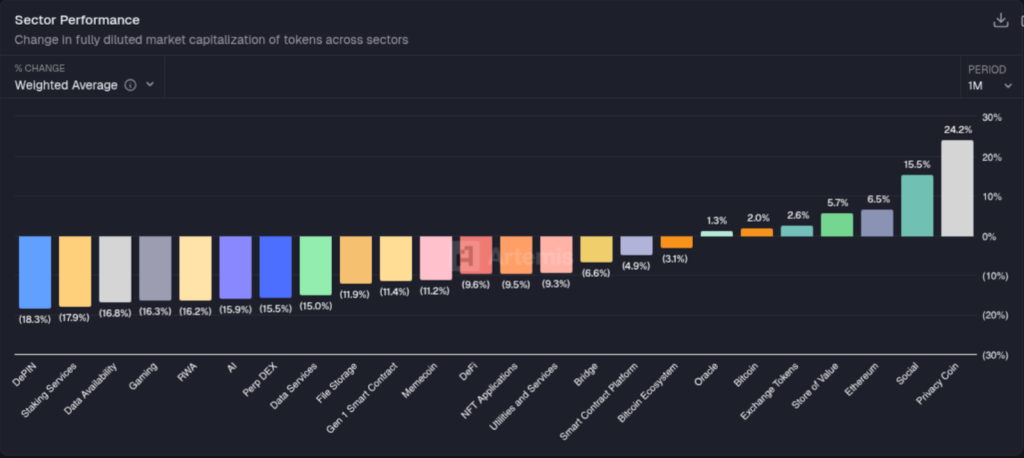
Source: https://app.artemisanalytics.com/home
The dispersion on the positive side was narrow but meaningful. Privacy Coin led gains at +24.2%, followed by Social (+15.5%), with majors and large liquid baskets also positive, including Ethereum (+6.5%), Store of Value (+5.7%), Exchange Tokens (+2.6%), Bitcoin (+2.0%), and Oracle (+1.3%). Meanwhile, several large “core” groupings still ended negative, including Bridge (-6.6%), Smart Contract Platform (-4.9%), and Bitcoin Ecosystem (-3.1%), which reinforces how uneven the tape was across narratives within the same 1-month window.
DeFi Stress
DeFiLlama’s chain-level series puts aggregate DeFi TVL at $117.74B on Dec 1, 2025 and $116.71B on Dec 31, 2025, a decline of about $1.02B for the month (about -0.87%). The headline implication is that December’s stress was mostly idiosyncratic rather than a market-wide bank run: incident headlines accumulated, but the aggregate TVL line did not show the kind of persistent drawdown that usually signals forced unwind behavior across many protocols at once.
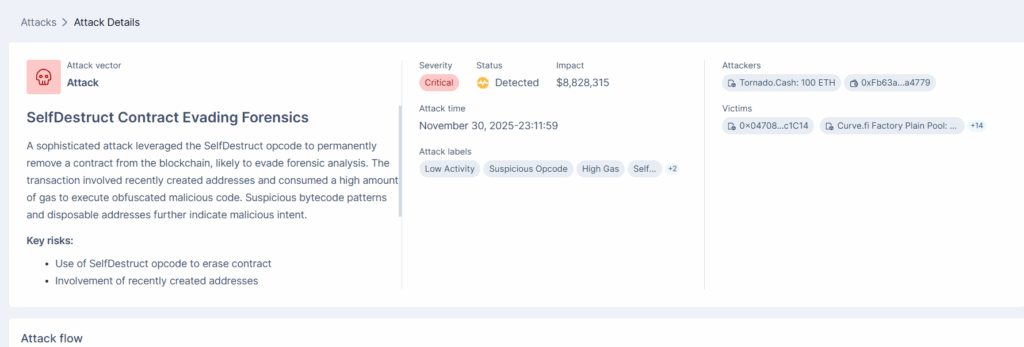
The cleanest incident anchor at the turn into December was the Yearn yETH pool exploit, which Yearn timestamped to 21:11 UTC on Nov 30, with DefiLlama recording roughly $9M in losses for the yETH product. Later in the month, the public hacks ledger shows additional, smaller losses that look like contained protocol-level failures rather than systemic contagion, including Mars Perps on Neutron on Dec 14 (about $0.96M) and a Yearn Finance entry dated Dec 16 (about $0.30M). A separate month-end security recap citing PeckShield framed December exploit losses as lower than November, reporting $76.2M stolen across 26 incidents and a roughly 60% decline versus the prior month.
Source: https://cryptorank.io/
Put together, what “broke” in December was still the familiar DeFi failure mode: bespoke contract logic, permissioning, and admin or oracle edge cases that can be exploited without needing broad market leverage to unwind. What did not obviously break, based on the stability of aggregate TVL into month end, was the sector’s capacity to keep collateral parked onchain despite negative headlines. The practical allocator takeaway is that December reinforced a governance-first lens, isolate legacy and custom code paths, map admin and oracle dependencies explicitly, and treat protocol selection as operational risk underwriting as much as it is a view on yields.
Stablecoin and Liquidity Layer
December’s stablecoin picture was defined less by a dramatic supply swing, and more by “staying power” at a large base. As a hard starting anchor, a December 2025 fintech research note citing DefiLlama put stablecoins on public blockchains at $306 billion by end of November 2025, with USDT at $185 billion and USDC at $76 billion. November 26, 2025 described a lower snapshot as of November 24, with total stablecoin market cap at $303 billion. By early December, Circle’s USDC supply was already reported as “more than $78 billion in circulation” (dated December 9, 2025).
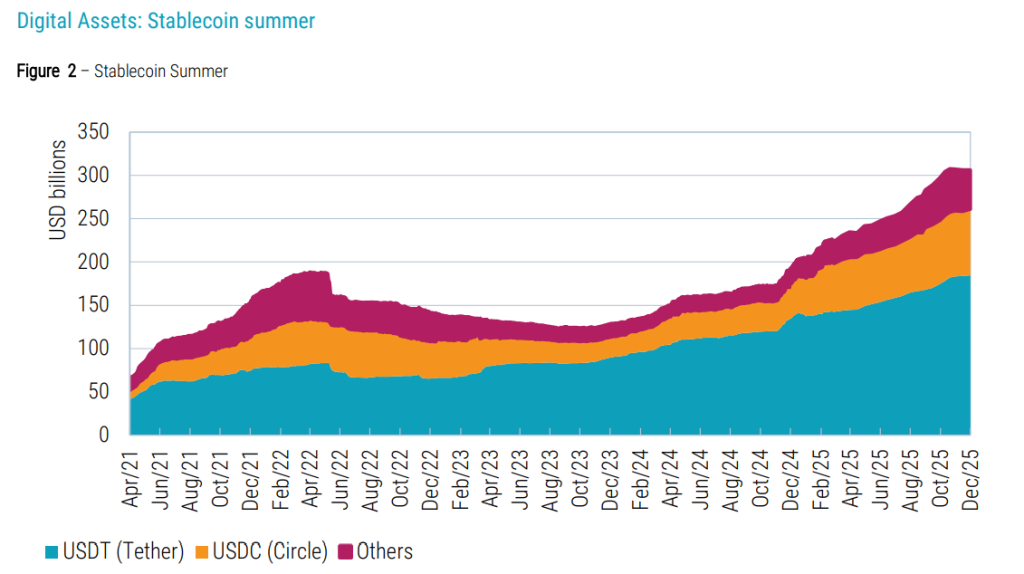
Source: https://www.robeco.com/files/docm/docu-20251212-fintechs-relentless-momentum-in-10-charts.pdf
Mechanically, the implication for market function is that the liquidity layer remained thick even while risk assets were volatile: stablecoin supply stayed in the low $300 billion range across late November and early December anchors, and USDC’s circulation grew from $76 billion at end-November to $78+ billion by December 9. (Robeco.com – The investment engineers) That matters because stablecoins are the working collateral for spot and derivatives venues, and because incremental growth in the “cleanest” regulated issuer supply (USDC) can loosen settlement frictions even when discretionary risk taking is cautious.
On adoption, December’s most concrete signal was product: Circle’s xReserve expansion and the announced USDCx rollout on Aleo’s testnet (December 9) framed stablecoins as compliance-compatible infrastructure for use cases like payroll and cross-border transfers, even if most flow still originates in trading and settlement. Despite volatile digital-asset prices and signs that the market was losing momentum after the 2025 rally, the liquidity layer continued to expand. Stablecoin supply remained large and, in key segments, still growing, which matters because stablecoins are the primary settlement and collateral unit across spot venues, derivatives, and onchain markets.
Regulation and Reputation
In December, US market access signals shifted toward clearer operating rails for intermediaries, especially around derivatives collateral and stablecoin issuance. On Dec 8, 2025, the CFTC’s Market Participants Division issued Letter No. 25-40, a staff no-action position that, subject to conditions, addresses when an FCM may accept certain non-securities digital assets, including payment stablecoins, as customer margin collateral and how those assets are treated for specified regulatory purposes. The same day, the CFTC issued Letter No. 25-41, withdrawing Staff Advisory 20-34 on accepting customer virtual currencies into segregation, and the Commission also withdrew its prior “actual delivery” interpretive guidance for certain retail crypto transactions, with the withdrawal described as effective Dec 10, 2025 and announced via a Dec 11 CFTC press release.
Banking perimeter signals also advanced. On Dec 12, 2025, the OCC announced conditional approvals for national trust bank charters and conversions involving several digital-asset firms, which is relevant because the conditions typically speak to capital, governance, risk management, and supervisory expectations. On the securities infrastructure side, SEC staff documentation dated Dec 11, 2025 addressed DTC’s development of DTCC Tokenization Services, and stablecoin policy moved into procedural detail when the FDIC approved a proposed rulemaking on Dec 16, followed by Federal Register publication on Dec 19, 2025 covering GENIUS Act application requirements for certain payment stablecoin issuance structures.
Gold and Silver Flows
Gold finished December higher, but the month was shaped by a sharp late-month reversal. Gold moved from $4,223.67 (Dec 1, 2025) to $4,339.65 (Dec 31, 2025), a +2.75% gain, after peaking around $4,550 on Dec 26 and then sliding to around $4,300 on Dec 29 amid margin-driven deleveraging.
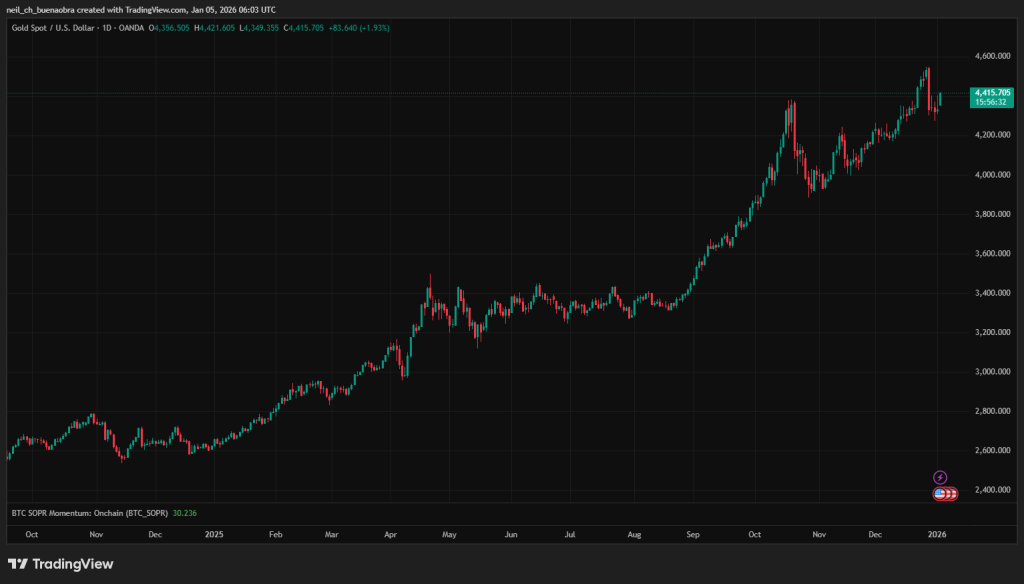
Source: https://www.tradingview.com/chart/2siDZm6r/?symbol=OANDA%3AXAUUSD
Silver was far more directional, and also more sensitive to funding and leverage constraints. On the same GoldPrice.org close series, silver rose from $57.07 (Dec 1) to $75.24 (Dec 31), a +31.84% move, but suffered a sharp pullback on Dec 29 that multiple outlets linked to a CME margin increase for March 2026 silver futures, reported as roughly $3,000 higher, from about $22,000 to about $25,000.
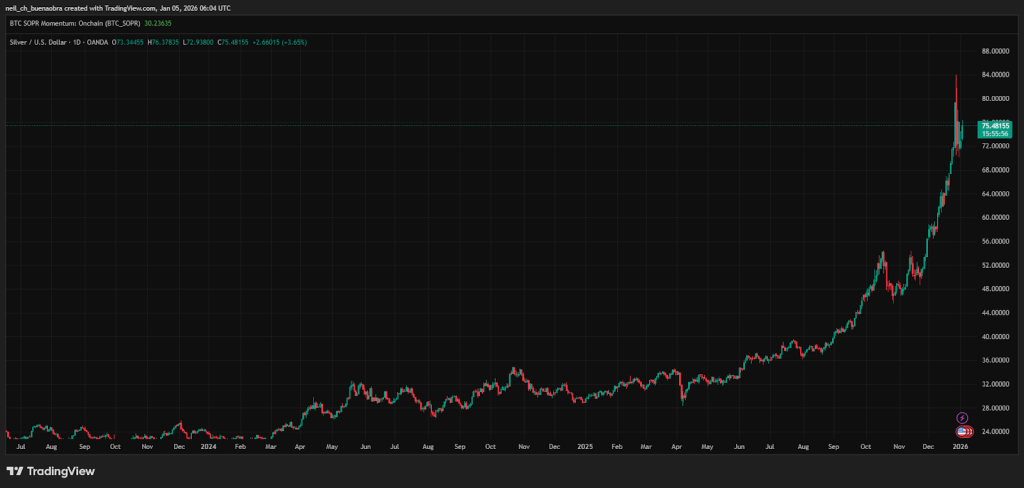
Source: https://www.tradingview.com/chart/2siDZm6r/?symbol=OANDA%3AXAGUSD
fund-flows reporting said gold and precious metals funds logged an eighth consecutive week of inflows, with $2.03B added in the final week of 2025. The World Gold Council’s Dec 17, 2025 update also reported India gold ETF AUM at INR 1,105B (about $12.4B) and noted two new gold ETFs launched in December, which is a useful adoption marker even if it is not a global flow total.
As a cross-asset “appetite gauge,” December’s metals tape is best read as strong hedge demand that periodically ran into leverage and margin constraints, a condition that can tighten risk budgets across portfolios without implying a direct causal link to crypto price moves.
Wrap-up
December 2025 was a month where policy eased on paper, but liquidity still pinched at key dates. The Fed cut the target range to 3.50% to 3.75% at the Dec 9 to 10 meeting, yet late-month funding stress still showed up in the plumbing, with $25.95B borrowed at the Fed’s standing repo facility on Dec 29. In that backdrop, Bitcoin finished down even with a very large installed ETF holder base: BTC moved from $90,373.90 (Dec 1 open) to $87,918.96 (Dec 31 close), with a Dec 3 high $98,909.40 and a Dec 1 low $83,800.00, while US spot BTC ETF flows summed to about -$1.09B for the month and month-end holdings were reported at 1,298,757 BTC. The signal is not that demand disappeared, it is that marginal demand became unreliable into year-end conditions, which is exactly when hedging quality and liquidity discipline tend to matter more than directional conviction.
Ethereum echoed the same structure, but with a different mix of outcomes: the month closed near flat versus the open, yet flows were a clear headwind. ETH moved from $2,991.65 (Dec 1 open) to $2,966.98 (Dec 31 close), with a Dec 10 high $3,477.44 and a Dec 1 low $2,716.35, while US spot ETH ETF flows summed to about -$616.3M across December trading days. DeFi, despite incident headlines, looked contained at the aggregate level: DeFi TVL was $117.74B on Dec 1 and $116.71B on Dec 31, and the largest named episode at the turn into December was the Yearn yETH pool exploit (with additional smaller entries later in the month). Stablecoins stayed large in late-November and early-December anchors, and USDC circulation was reported as more than $78B by Dec 9, which is consistent with a liquidity layer that did not contract sharply even as risk assets churned. The takeaway is that market infrastructure held together, but the price path still respected year-end balance sheet constraints and flow sensitivity.
The month’s “quiet signal” came from regulation and market plumbing, because it directly affects allocator constraints in 2026. The CFTC issued staff positions on Dec 8 related to the acceptance and treatment of certain digital assets, including payment stablecoins, as margin collateral under specified conditions, while also withdrawing prior staff advisory framing; the OCC announced conditional trust bank charter approvals on Dec 12; the SEC staff no-action posture around DTCC Tokenization Services was dated Dec 11; and the FDIC moved on GENIUS Act-related application procedures on Dec 16 with Federal Register publication on Dec 19. For January, the practical watchlist is straightforward: whether ETF flows stabilize after year-end rebalancing, whether USD funding conditions normalize after quarter-end distortions, and whether stablecoin issuance and institutional rail-building continue to progress without new compliance shocks. That assessment depends on data continuity resuming cleanly after the shutdown-disrupted releases, and on the pace at which policy guidance becomes enforceable for operating standards for venues and intermediaries.