Bitcoin Climbs to $107K on $4.5B ETF Inflows as Ethereum Slips
30th June 2025 • 13 mins read
Key Numbers:
Bitcoin US$ 107,521 (2.77%) Ethereum US$ 2,474.28 (-2.51%)
1-month return
Total Crypto Market Cap US$ 3.44T (1.47%)
2025 returns
Bitcoin 12.82% Ethereum –27.39% Gold +26.36%
NASDAQ 5.47% S&P500 5.49%
Key Takeaways
- The Fed held its policy rate at 4.25–4.50 percent on June 18, trimming balance-sheet runoff and penciling in two rate cuts later this year amid persistent inflation and tariff-driven price pressures.
- U.S.–China negotiators agreed on a framework to revive their 2023 trade truce on June 10, but export curbs on military-grade rare-earth magnets remain unresolved.
- Geopolitical shocks on June 22—U.S. strikes on Iran’s underground nuclear sites—drove Bitcoin briefly below $100,000 and triggered about $1.15 billion in leveraged liquidations before a swift rebound.
- U.S. spot Bitcoin ETFs saw a total of $4.5 billion in net inflows in June, with the largest single-day inflow nearly $1 billion, as institutions snapped up the mid-month sell-off.
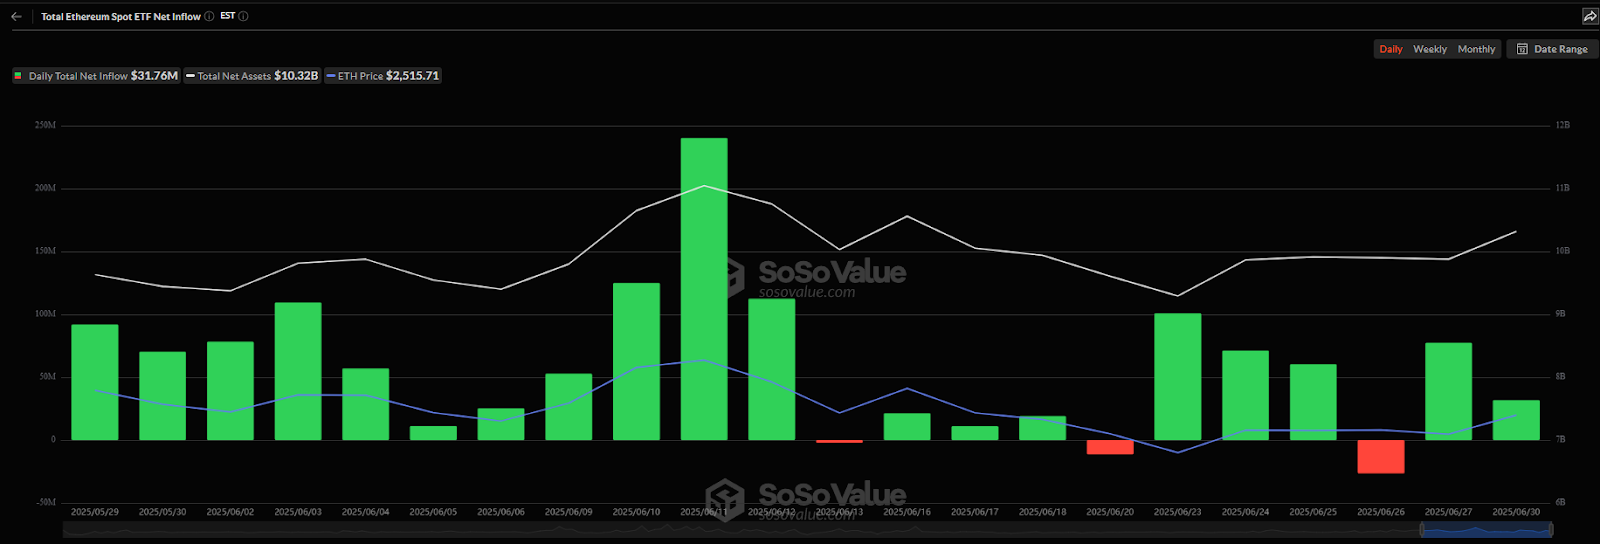
- Ethereum products attracted $1.16 billion in net inflows for the month, highlighted by BlackRock’s rotation of roughly 5,362 BTC (≈ $561 million) into ETH vehicles and Galaxy Digital withdrawing over $200 million of ETH from exchanges.
- Equities rallied: the S&P 500 climbed 4.96 percent and the Nasdaq Composite rose 6.57 percent, led by AI leaders, megacaps, and cyclicals like industrials.
- Stablecoin supply rose 2.5 percent to $250 billion, with USDT leading at over $165 billion (66 percent market share) and USDC at $61.6 billion, underscoring on-chain liquidity demand.
- Bitcoin dominance reached 64.8 percent by June 26, altcoins made up just 35% of the $3.43 trillion market cap, and the Altcoin Season Index languished at 21 delaying a broader alt season.
- NFT tokens surged 20.8 percent in June, while DeFi and exchange tokens gained 2.6 and 1.2 percent, highlighting concentrated narrative leadership amid tight liquidity.
Macro-Economic & Geopolitics
On June 18, 2025, the Federal Reserve held its benchmark rate at 4.25–4.50%, warning that persistent inflation and incoming tariff hikes would keep borrowing costs elevated longer than anticipated. Although policymakers still penciled in two rate cuts for later this year, they slowed the projected pace after tariff-driven price pressures and a softer growth outlook. That balanced stance helped steady risk assets into month-end.
Earlier in the month, U.S. and China negotiators agreed on a framework to revive their 2023 trade truce on June 10, yet key export curbs on military-grade rare-earth magnets remain unresolved and could reignite volatility. At the same time, President Trump delayed a threatened 50% tariff on EU imports, moving the original July 9 implementation to late May—boosting European markets and tempering dollar strength. Meanwhile, China’s official manufacturing PMI held at 49.7 in June for a third consecutive month below the 50-point growth threshold, though new domestic orders ticked up to 50.2, underscoring mixed economic signals that kept investors cautious.
Geopolitical risk surged on June 22 when U.S. airstrikes on Iran’s underground nuclear sites escalated broader Israel–Iran hostilities. That shock sent Bitcoin briefly below $100,000 and triggered roughly $595 million in long-position liquidations before markets snapped back, reminding everyone how episodic conflicts can prompt sharp but short-lived moves across both traditional and digital assets.
Bitcoin Market Analysis
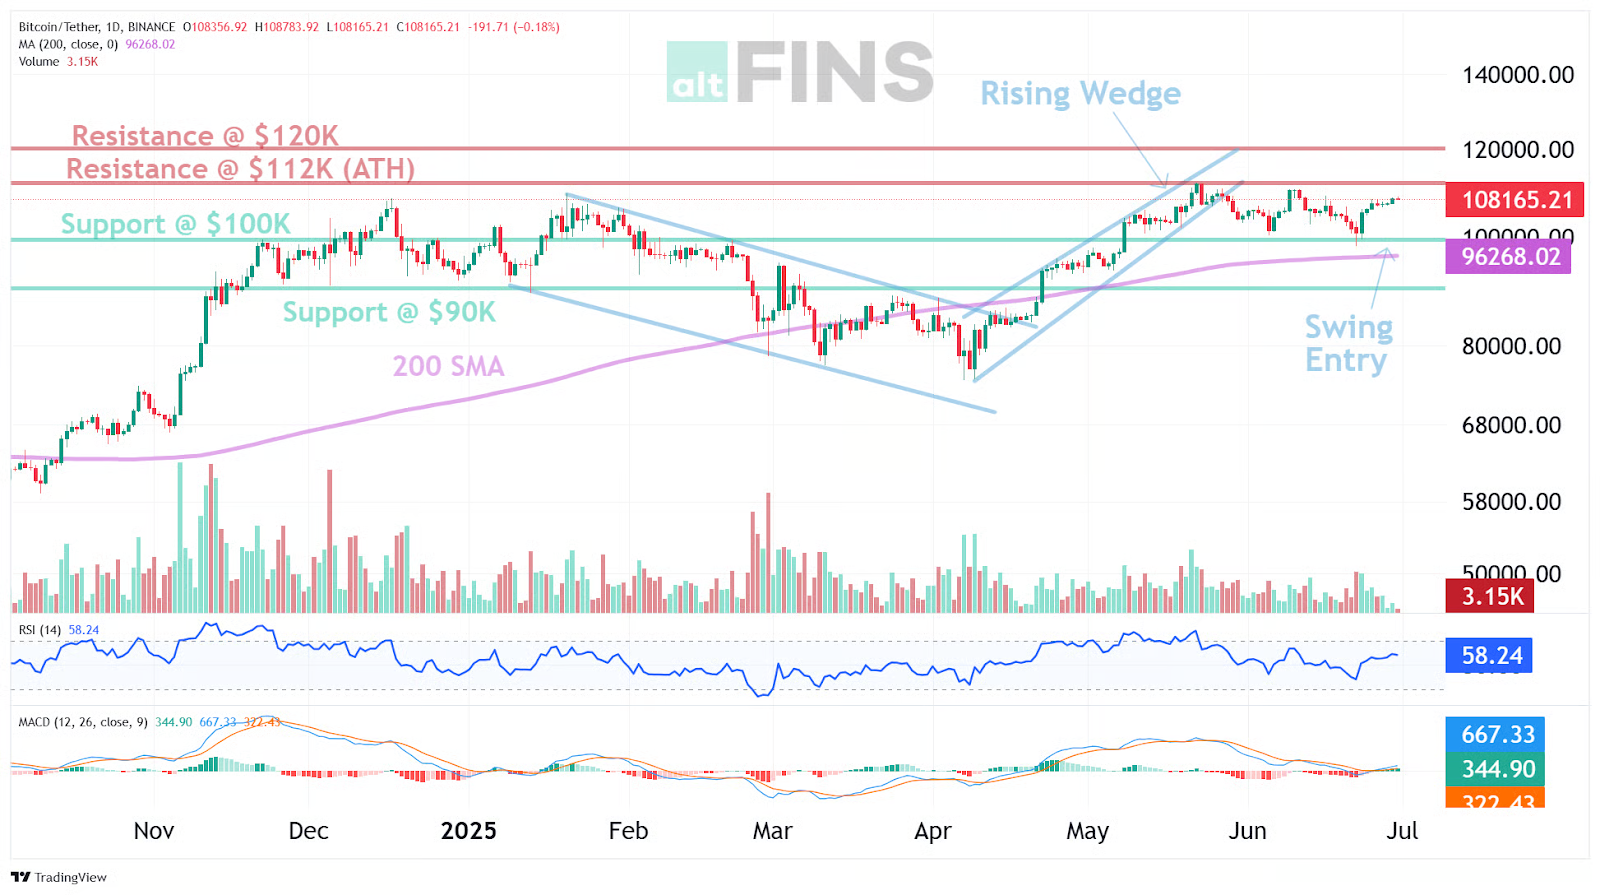
In early June, Bitcoin opened June at $104,621 trading in a narrow $104,900 to $106,800 range as markets awaited the Fed’s June 18 policy update. Mixed U.S. PMI readings and U.S. and China trade tensions kept buyers and sellers in check.
Source: https://altfins.com/technical-analysis
By mid-month, a series of geopolitical shocks added volatility. On June 13, Israeli airstrikes on Iran’s nuclear and missile sites wiped out over $1.16 billion in leveraged positions and drove Bitcoin to an intraday low of $102,822. Iran’s missile response on June 23 briefly pushed the price below $100,000 before buyers stepped in and lifted it back above $102,400.
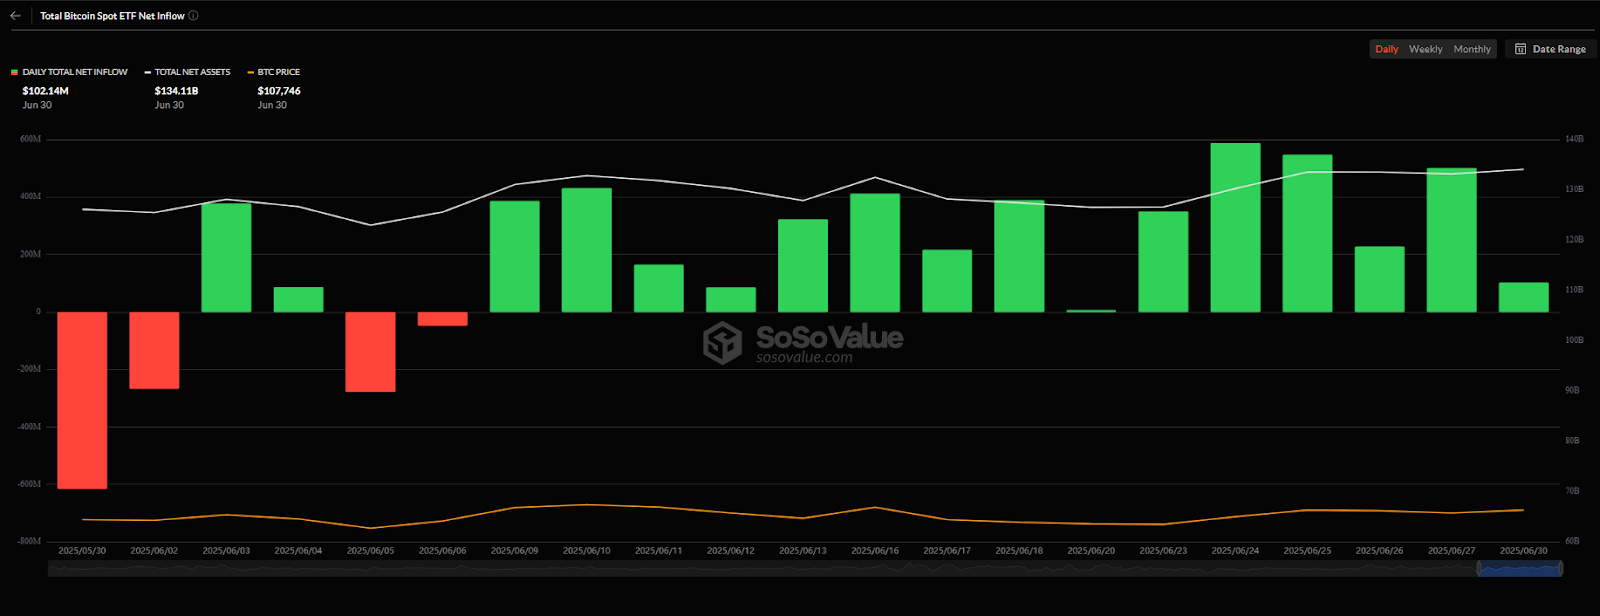
Institutional demand proved a crucial backstop for Bitcoin amid June’s volatility. U.S. spot Bitcoin ETFs drew in $4.5 billion in net inflows over the month as investors treated the mid-month sell-off as a prime entry point. The highest daily inflow was almost $1 billion, showing growing confidence in regulated on-ramps. Bitcoin’s mining hash rate dipped roughly 8 percent during the turbulence but recovered swiftly in the following days.
Source: https://sosovalue.com/dashboard/total-crypto-spot-etf-fund-flow
As June closed, Bitcoin settled at $107,521, it remained above its 50-day moving average near $106,000 and its 200-day average around $96,268. The 14-day RSI hovered around 54 and the MACD crossed into positive territory, suggesting the rebound could extend into July’s key events, including the delayed EU tariff deadline and the next FOMC meeting.
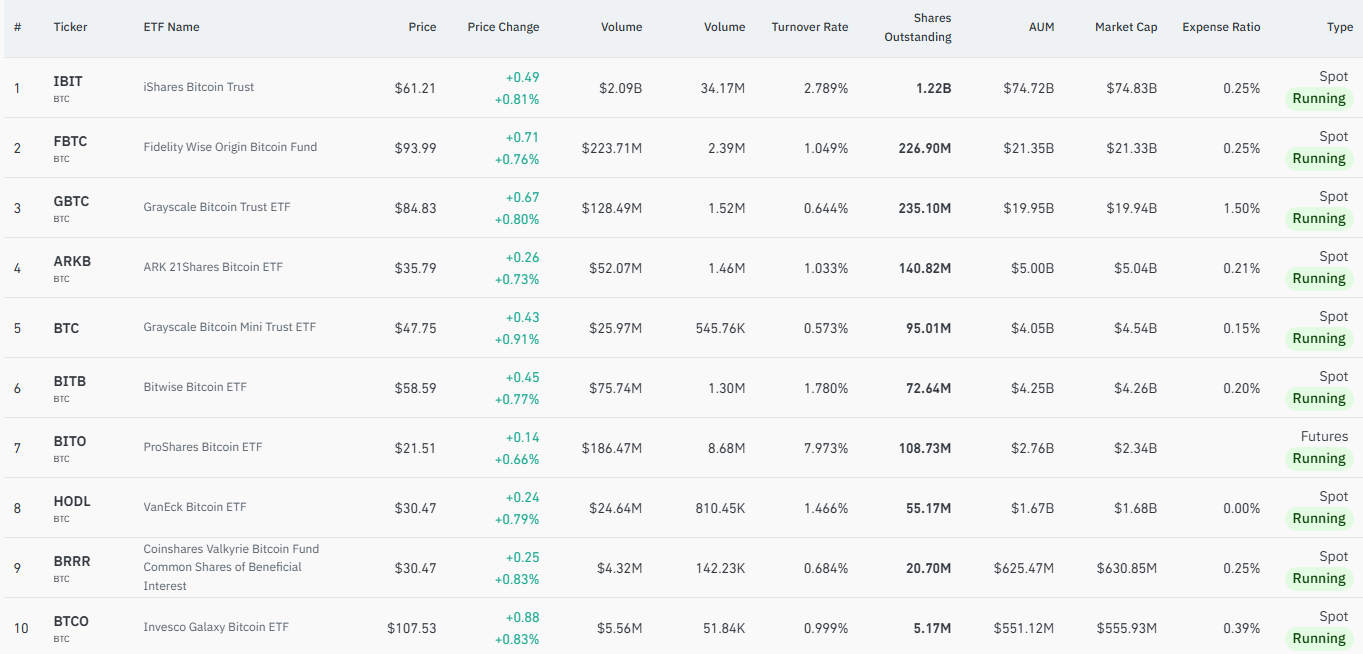
Source: https://www.coinglass.com/bitcoin-etf
Corporate treasuries have accelerated Bitcoin accumulation as part of broader balance-sheet diversification strategies, tapping innovative financing vehicles to deploy capital without diluting existing shareholders. On June 12, MicroStrategy unveiled a $1 billion equity raise dedicated entirely to BTC purchases, aiming to grow its treasury toward 200,000 coins. GameStop’s underwriters exercised a $450 million greenshoe option on June 9, optionally converting proceeds into Bitcoin. Meanwhile, Metaplanet Capital issued a $210 million zero-coupon bond that will deliver 10,000 BTC at maturity, and Strategy Group secured fresh funding to expand its holdings to roughly 592,100 BTC.
Ethereum Market Analysis
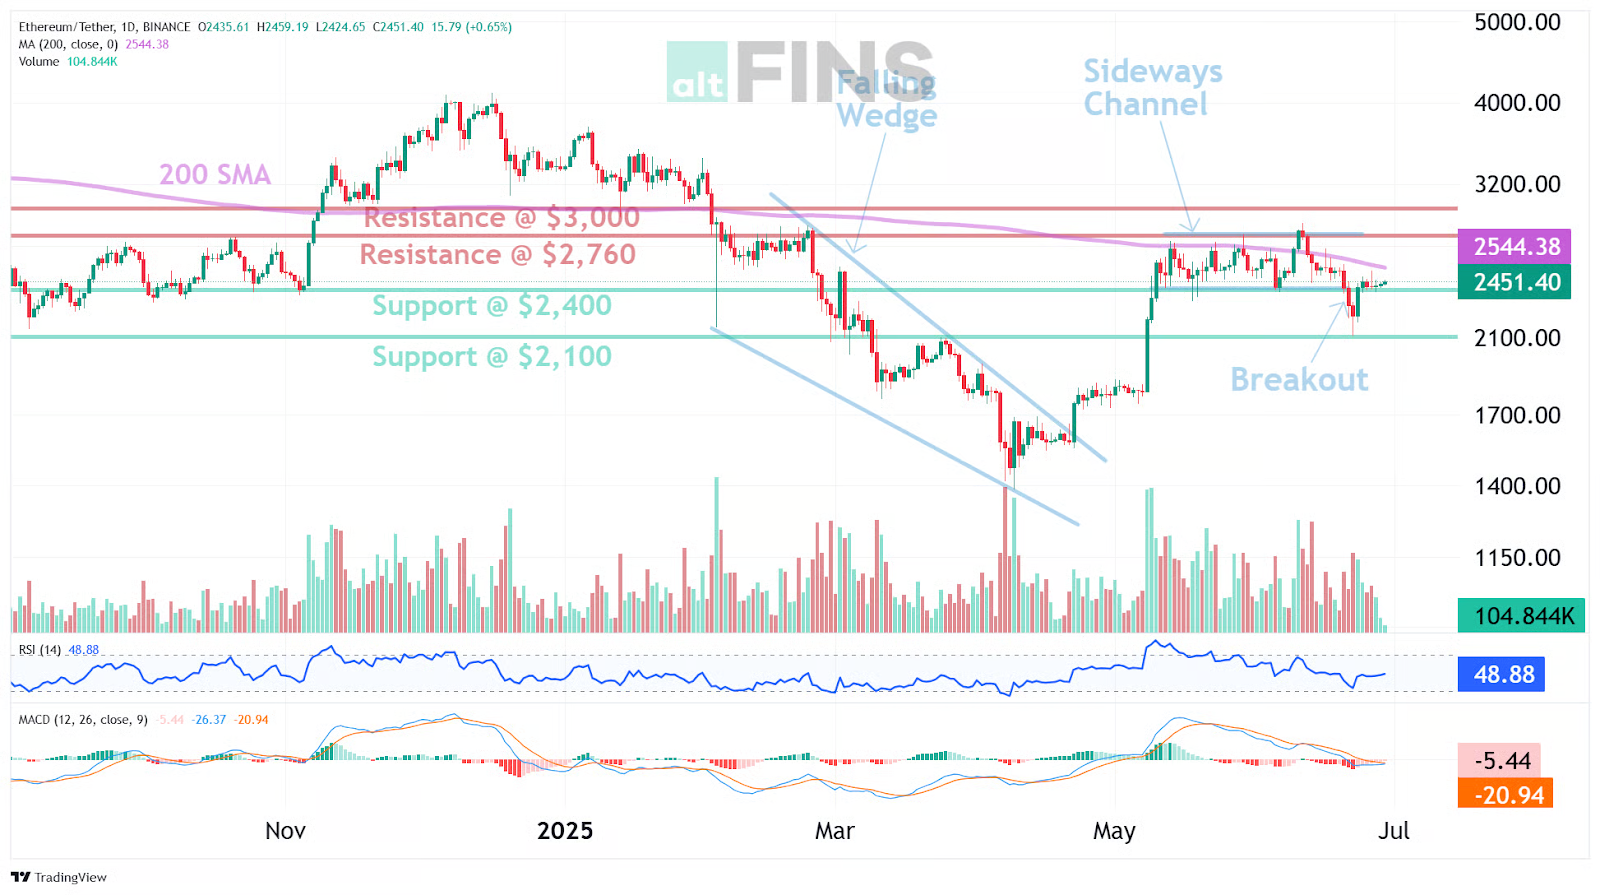
June opened on a steady note. Ethereum started at $2,607.20 and traded between $2,582.25 and $2,652.42 while markets awaited the Fed’s June 18 update. When the S&P Global Composite PMI dipped to 52.8 on June 23 it signaled a slowdown in growth that kept price moves in check even as on-chain activity stayed robust.
By June 11 ETH climbed to an intraday high of $2,877.92 before geopolitical news hit. On June 13 Israeli airstrikes on Iran’s nuclear sites forced about $595 million in long positions to liquidate. Ethereum then fell to $2,447.78, its weakest level since April, before buyers swooped in and stopped the slide.
Network use never wavered. In the final week of June daily active addresses averaged about 430,000 and more than 629,000 addresses were active on June 25. That same day the chain processed roughly 1.75 million transactions. During the week of June 9 nearly $1.93 billion in stablecoins flowed into DeFi, showing liquidity held up despite bouts of selling.
Big institutions also made decisive shifts toward Ethereum in June. ETH products drew in $1.16 billion in net inflows for the month and showed growing appetite as investors chased upside in a market where Bitcoin sits near its all-time high. On June 18 BlackRock rotated roughly 5,362 BTC, about $561 million, from its spot Bitcoin ETF into Ethereum vehicles, one of the year’s largest single-day moves. At the same time Galaxy Digital pulled more than $200 million of ETH off exchanges, reflecting confidence in staking and DeFi. These actions highlight Ethereum’s higher risk-reward profile after months of lagging performance. Institutions are tilting portfolios to capture potential gains in ETH’s rebound.
Gold, Equity & Crypto Performance
In April, when President Trump’s “Liberation Day” tariffs hit on April 2, the S&P 500 fell almost 5 percent and investors flocked to safe havens. Gold jumped to an all-time high of $3,430.18 per ounce on April 21 as the dollar weakened and trade fears peaked. Once those worries eased, gold’s rally lost steam and by June 1 it traded near $3,288.90 per ounce. As the Fed held rates at 4.25 to 4.50 percent, gold stayed in that range and closed the month at $3,294, a 0.16 percent uptick. Over the same period the S&P 500 rose from 5,911.69 to 6,204.95, up 4.96 percent, and Bitcoin climbed from $104,621 to $107,521, a 2.77 percent gain. This shows gold still serves as a hedge in times of stress but tends to lag when investors return to higher-beta assets.
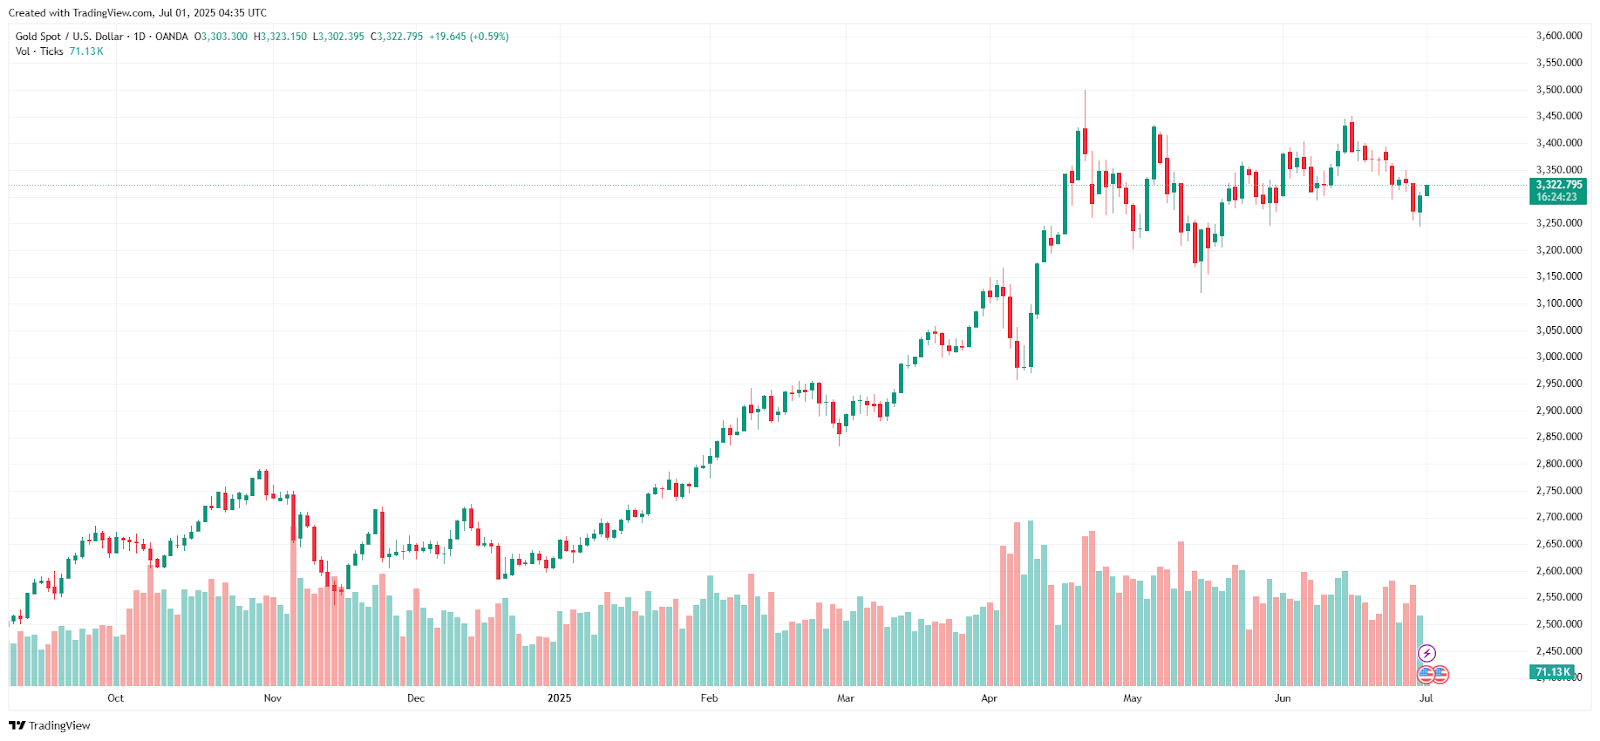
Source: https://www.tradingview.com/chart/?symbol=OANDA%3AXAUUSD
Equities followed through on that renewed risk-on mood. The S&P 500 climbed 4.96 percent from 5911 to 6204 as traders cheered the Fed pause and easing trade tensions. The Nasdaq Composite rose 6.57 percent, led by AI names and megacaps, while cyclicals like industrials rallied more than 5 percent on hopes of a manufacturing rebound.
Stablecoin Market in June 2025
June saw stablecoin supply rise from about $244 billion at the end of May to roughly $250 billion by month end. This 2.5% increase shows both institutions and retail users tapping on-chain liquidity during volatile markets instead of retreating to cash. Traders now view stablecoins not only as parking spots for capital but as flexible tools to seize DeFi and trading opportunities when prices swing.
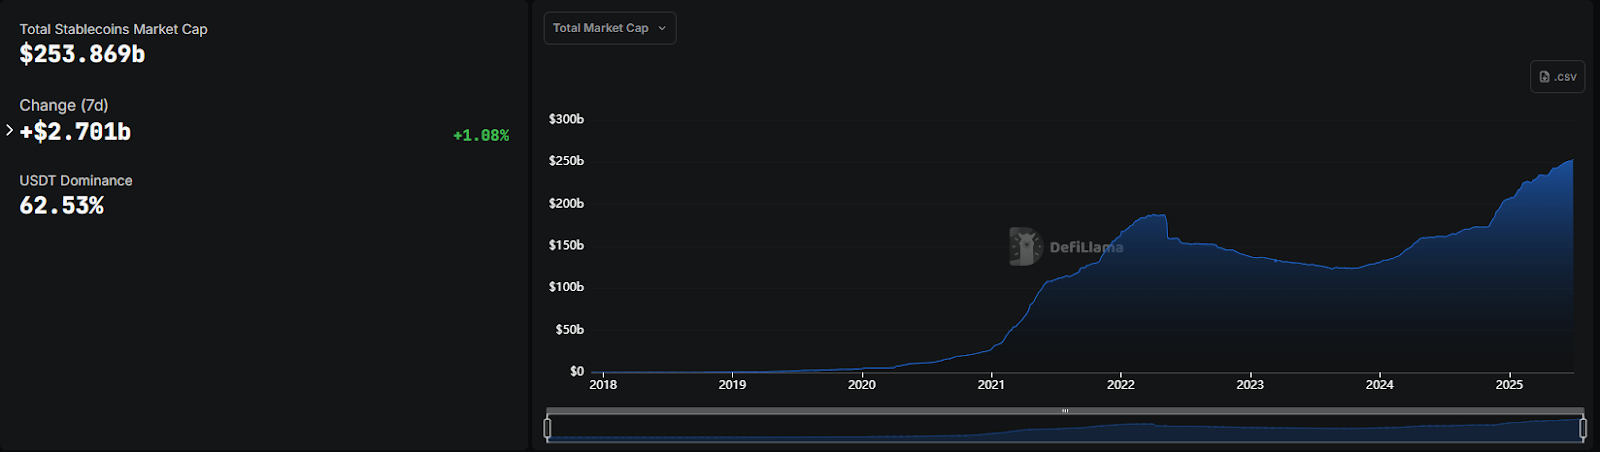
Source: https://defillama.com/stablecoins
Tether’s USDT still leads the pack with just over 66% market share and more than $165 billion in circulation. On Tron alone, over $80 billion of USDT now settles transactions, a sign of how much traders value fast, low-fee networks. USDC grew by about $400 million during the week ending June 26, taking its total to $61.6 billion. That gap in growth reveals different issuer playbooks: Tether pushing wider distribution and Circle sticking to measured, compliance-first expansion.
Issuers are also linking stablecoins to real-world business. In June, Tether bought a stake in Latin American agribusiness Adecoagro and Circle invested in Orionx in Chile. Those deals show stablecoins can bridge payroll payments, cross-border remittances and on-chain treasury management. They prove stablecoins can run everyday financial plumbing rather than just sit on an exchange.
Alt Coin Season and BTC Dominance
June’s altcoin market painted a tepid picture. Data from CoinDesk show that in the first half of 2025, Bitcoin gained 13% while Ethereum and Solana fell 25% and 17%. By June 26 altcoins made up just 35% of the $3.43 trillion crypto market cap, at $1.29 trillion. Daily trading volume averaged around $68.9 billion and the Altcoin Season Index hovered at 21, well below the 75 threshold that marks a true alt season. Meanwhile DeFi lending TVL hit a record $56 billion but gains stayed in a handful of big protocols, leaving smaller tokens starved for fresh capital
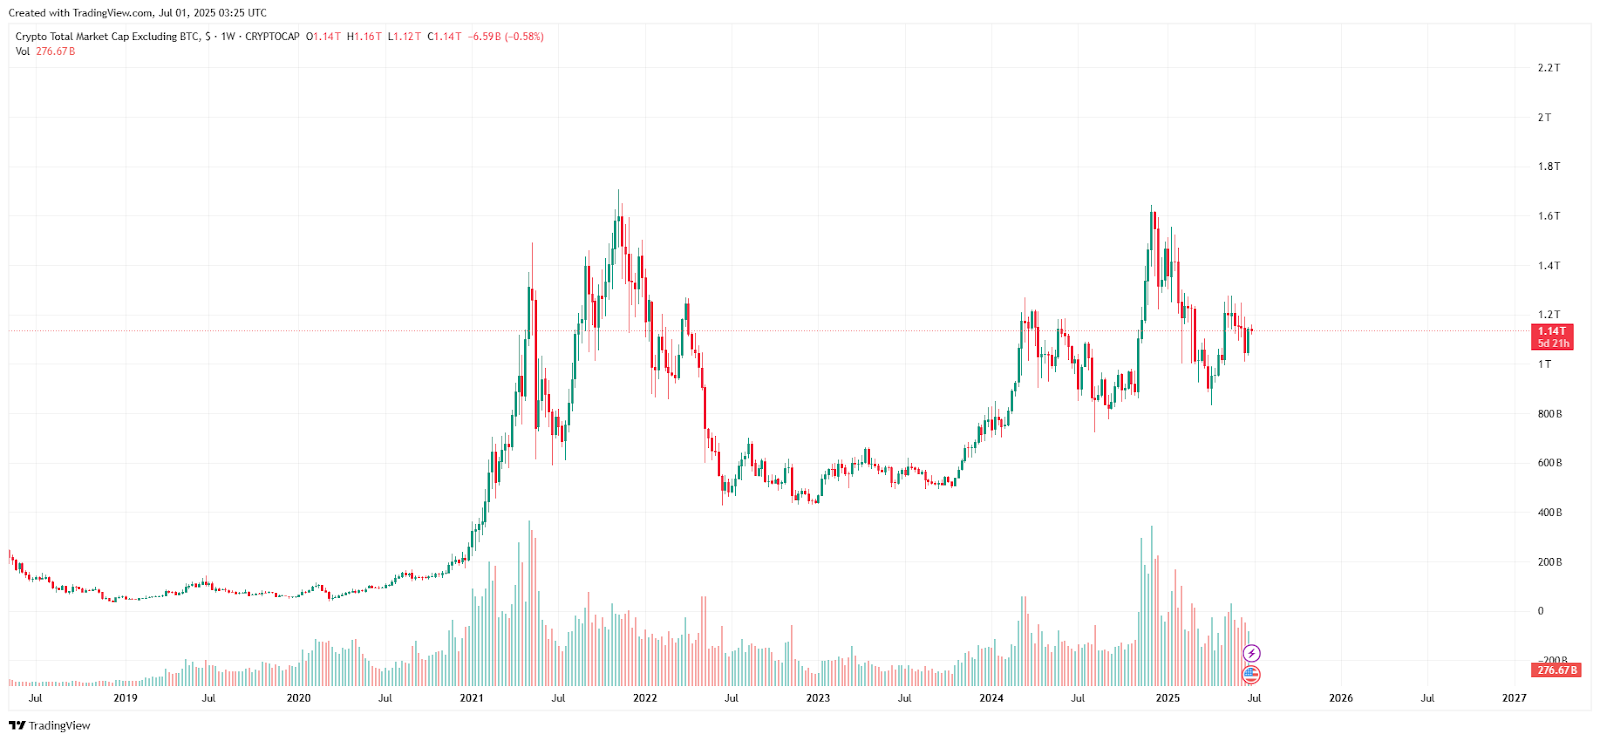
Source: https://www.tradingview.com/chart/?symbol=CRYPTOCAP%3ATOTAL2
High Bitcoin dominance and tight liquidity have kept altcoins sidelined. Bitcoin accounted for 64.8% of the market by June 26, a sign investors prefer its liquidity and safety amid uncertainty . The Altcoin Season Index at 21 shows almost no altcoins have outperformed Bitcoin recently . Since June 18 the Fed has held rates at 4.25–4.50% and, after slowing its balance sheet runoff in March, shows no sign of ending quantitative tightening. That has kept real yields high and risk capital locked in Bitcoin, starving smaller tokens of the flows they need to rally
A true alt season depends on capital rotating out of Bitcoin and into smaller tokens. History tells us dominance must drop below 55% and the Altcoin Season Index climb above 75 to spark broad altcoin outperformance . On the macro side markets would need to see a confirmed end to QT and several Fed rate cuts beyond the two currently penciled in to loosen liquidity enough for smaller tokens to flourish. Until those shifts arrive, Bitcoin season’s set to continue and a sustained alt season remains on hold
Sector performance
In June 2025, the crypto market saw a new wave of narrative leadership centered on NFT applications, which surged 20.8% as appetite for digital collectibles and metaverse projects accelerated. Store-of-value tokens climbed 10.0%, reflecting renewed demand for yield-insulated assets. DeFi gained 2.6% and exchange tokens rose 1.2%, underscoring the resilience of core finance and trading ecosystems amid broader uncertainty
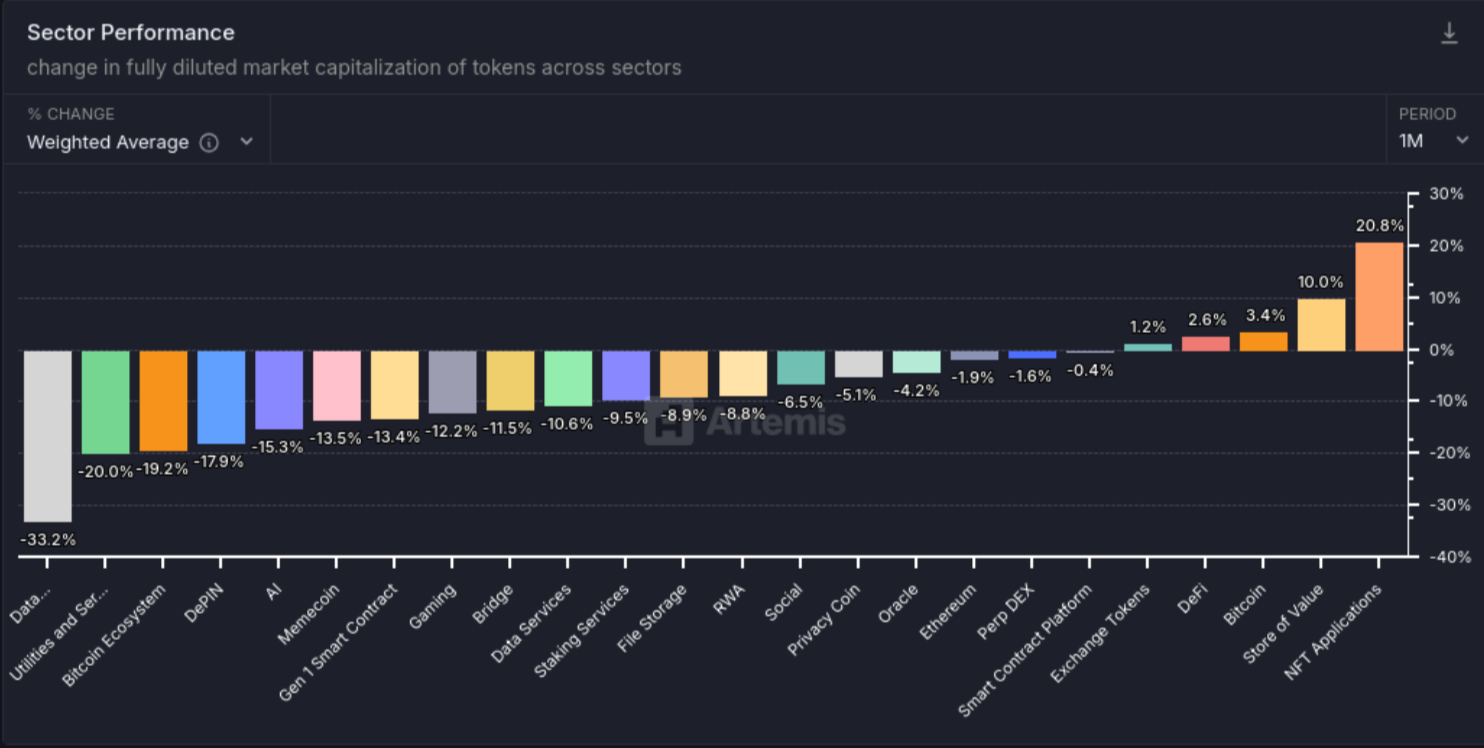
Bitcoin dominance at 64.8% by month-end, approaching multi-year highs near 70% when capital rotation into altcoins typically strengthens. Many infrastructure and emerging sectors lagged, with data availability declining 33.2%, utilities and security down 20.0% and the broader Bitcoin ecosystem off 19.2%. Other themes such as DePIN fell 17.9%, AI dropped 15.3% and memecoins slid 13.5%, indicating that fresh liquidity remains concentrated in the top narratives and that a true alt season still hinges on a meaningful shift away from Bitcoin.