Drawdown, ETF Outflows, Elevated Risk Premium
Key Numbers:
Bitcoin $78,621.12 (-10.58%) Ethereum $2,445.09 (-18.05%)
1-month return
Total Crypto Market Cap $2.84T (-7.19%)
2026 returns
Bitcoin –10.58% Ethereum –18.05% Gold 8.96%
NASDAQ 0.95% S&P500 1.37%
Key Takeaways
- Bitcoin set the index tone for January, ending -10.57% (Jan 2 to Jan 31) with a -22.3% peak-to-trough drawdown from the Jan 14 high (97,838.4) to the Jan 31 low (75,993.4), alongside 43.9% annualised realised volatility from your verified daily close series.
- Flows also mattered. Per your SoSoValue monthly snapshot, US spot Bitcoin ETFs posted -$1.61B net flow for January, with $86.99B in monthly traded value and $106.96B in total net assets at month end (data as provided). On the ETH side, your SoSoValue line item shows Jan 30, 2026 net flow of -$252.87M, with $1.80B traded value and $15.86B total net assets (data as provided).
- The month’s risk premium was reinforced by volatility catalysts that hit at sensitive times. Late-month geopolitics intersected with thin-liquidity conditions, with weekend risk-off pressure in BTC coinciding with Iran-related headlines and a sharp move lower. (CoinDesk)
- Cross-asset signals supported the same read. Gold extended a record run late in the month, with Reuters coverage referencing prices above $5,400 and moving toward $5,600 before a sharp reversal. Oil also responded to geopolitical risk and supply concerns, keeping the inflation-risk channel relevant as a background constraint. (Reuters)
- US equities were choppy rather than panic-driven, but leadership risk showed up through mega-cap tech, with Microsoft’s AI capex and cloud-growth dynamics spooking investors late in the month. (Reuters) That matters for crypto because it shapes the broader risk appetite backdrop and the market’s tolerance for duration and leverage.
- Net, January reads cleanly as a month where Bitcoin’s drawdown was expressed through liquidity and positioning first, then reinforced by ETF flow headwinds and late-month macro and geopolitical sensitivity, while metals and mega-cap tech helped explain why the risk premium stayed elevated into month-end.
Bitcoin Market Analysis
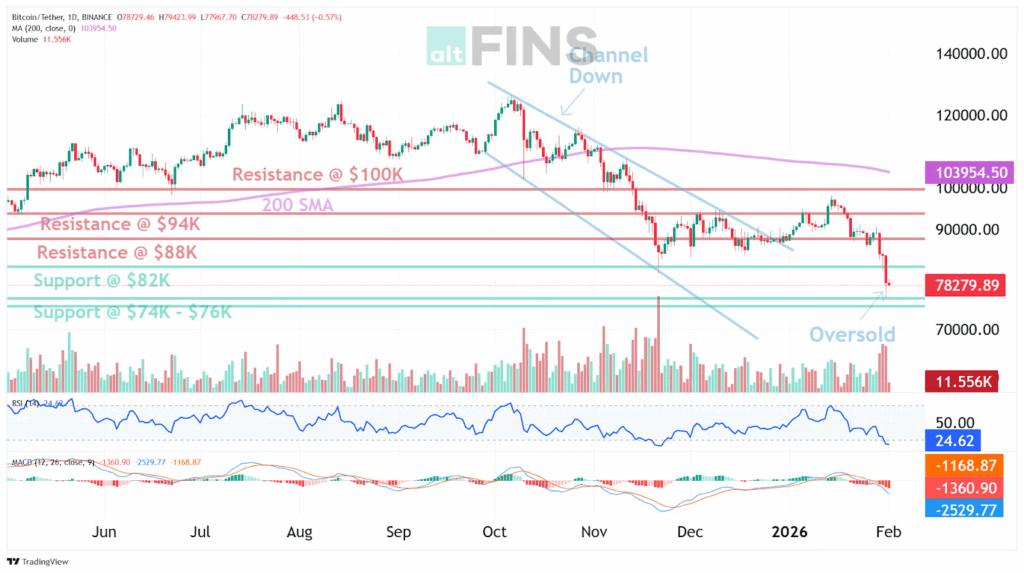
January’s BTC tape was defined by a mid-month peak followed by a steady deterioration that accelerated into month end. On your verified daily series, BTC printed a Jan 14 high of 97,838.4 and a Jan 31 low of 75,993.4, a -22.3% peak-to-trough drawdown inside the month. Over the same window you specified (Jan 2 to Jan 31), BTC finished -10.57% close-to-close, with 43.9% annualised realised volatility computed from daily close log returns on that same series. That combination, a deep intramonth drawdown and elevated realised volatility, is consistent with a market that repriced in bursts rather than through a smooth, two-way grind. When volatility rises to that degree, the distribution of returns tends to concentrate risk into a smaller number of large sessions, which makes attempted stabilisations less durable and increases sensitivity to liquidity and positioning dynamics.
Source: https://altfins.com/technical-analysis
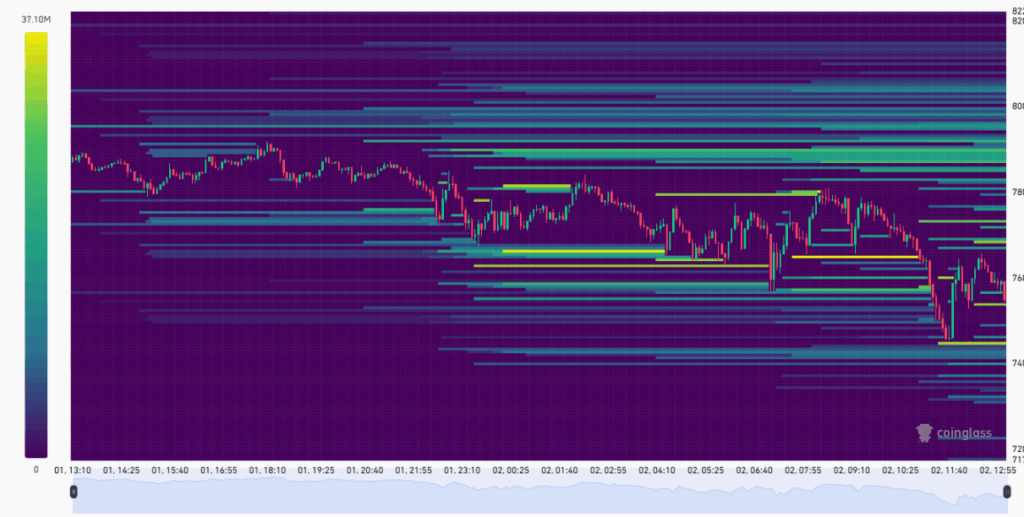
The final stretch of the month was dominated by a risk-off pulse that pushed BTC below $80,000 in late-January market coverage, with the move linked to liquidity concerns tied to expectations of a tighter Fed stance under a potential leadership change. That “fragile liquidity” framing had two specific legs in that same coverage set. The selloff was driven by concerns that a new Fed leadership path could imply tighter financial conditions, including via balance sheet policy, which is a direct channel for risk asset liquidity expectations. Reports also emphasized thin weekend conditions around the drop, which is a simple microstructure point: when market depth is lower, selling flows tend to move price farther, and forced selling can cascade through levels more easily.
Source: https://www.coinglass.com/pro/futures/LiquidationHeatMap
The clearest market-structure signal into month end was the scale of forced deleveraging that accompanied the drawdown. As BTC slid toward $81,000, estimated 24 hour liquidations exceeded $1.7B, with long positions representing most of the clears. The following session, total liquidations were again estimated at $2.5615B, also dominated by longs. In a month recap, that is enough to treat forced position reduction as a material transmission mechanism, it increased sell pressure at the same time liquidity thinned, which helped the downside move cut through levels more quickly than a purely discretionary selloff.
Ethereum Market Analysis
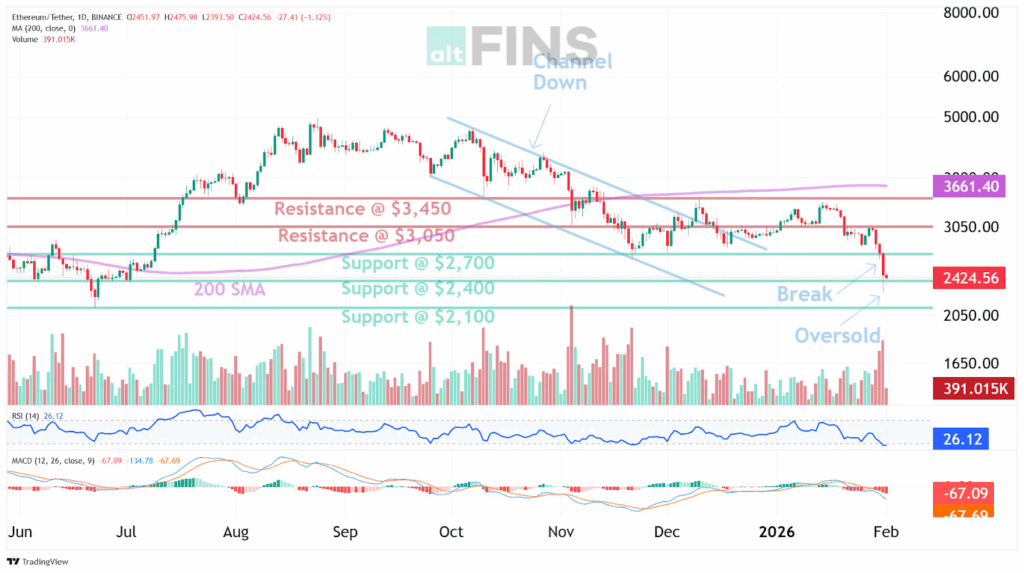
January’s ETH tape was defined by a decisive range breakdown and a sharp acceleration lower into month end. After spending roughly three months consolidating, price failed below the $2,700 area and resumed its broader downtrend. By late January, ETH was trading around the $2,400 handle, with daily momentum deeply oversold, reflected in RSI-14 readings in the mid-20s. The selloff was fast rather than orderly, consistent with a market repricing through clustered down days instead of a gradual grind.
Source: https://altfins.com/technical-analysis
Market structure and positioning amplified the move. ETH weakened alongside a broader risk-off shift across high-beta assets, while thin liquidity conditions increased price impact during periods of selling pressure. Forced deleveraging played a material role, with long liquidations adding mechanical supply as price moved through prior support zones. In that environment, attempted rebounds struggled to gain traction, and downside momentum persisted as bids thinned.
From a technical perspective, trend conditions remain firmly bearish across short, medium, and long horizons. Price is well below the 200-day moving average near $3,660, reinforcing the longer-term downtrend. Nearest support is defined around $2,100, while resistance sits at $3,050 and then $3,450. Although oversold conditions near support increase the probability of a near-term bounce, the broader setup still argues for caution until ETH can reclaim key resistance levels and stabilise above broken range support.
Crypto Market Drivers
January’s drawdown had a clear leverage signature into month end. Estimated 24-hour liquidations exceeded $1.7B around Jan 30 and were later estimated near $2.5615B on Jan 31. The significance is not the exact monthly total, it is that forced deleveraging was large enough to affect price formation by adding market sell pressure at the same time available bids were already being tested.
Policy and market structure remained a live risk premium input, even without being the primary day-to-day catalyst. Late January included active negotiations over crypto legislation and stablecoin treatment, including debate over interest-like returns and a committee step advancing a framework for expanded CFTC oversight of spot crypto markets. In market terms, stablecoin rules matter because they shape how on-chain cash competes with deposits, and they influence assumptions about distribution, yield, and the durability of demand.
Operational risk also stayed visible. January included a reported investigation into a possible compromise of U.S. government crypto accounts tied to seized and forfeited assets, keeping attention on custody controls. Even when not a primary driver, this type of event increases the salience of counterparty risk and operational plumbing during periods when leverage is already being reduced.
Source: https://app.artemisanalytics.com/macro
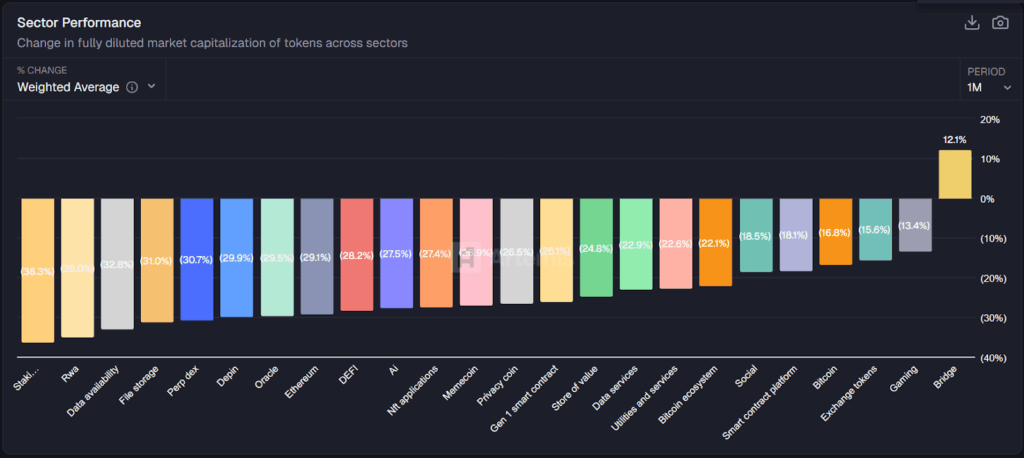
Sector performance over the month shows broad, correlated drawdowns across most crypto subsectors, with only one category finishing positive. The largest declines were concentrated in Staking services (36.3%), RWA (35.0%), Data availability (32.8%), File storage (31.0%), and Perp DEX (30.7%), while core beta buckets also retraced sharply, including Ethereum (29.1%) and DeFi (28.2%). Higher narrative and risk-on groupings also contracted meaningfully, including AI (27.5%), NFT applications (27.4%), Memecoin (26.9%), Privacy coin (26.5%), and Gen 1 smart contract (26.1%).
On the less severe end of the distribution, declines were smaller in Social (18.5%), Smart contract platform (18.1%), Bitcoin (16.8%), Exchange tokens (15.6%), and Gaming (13.4%), while Bridge was the only category that gained, up 12.1%. In aggregate, the dispersion is notable because the month did not simply reprice every segment equally, it compressed most sectors while leaving a narrow set of comparatively resilient buckets and a single positive outlier.
The one month Bridge bucket was the outlier because large interoperability names showed idiosyncratic upside while most crypto sectors repriced lower. In late January, LayerZero’s ZRO caught a bid on upgrade expectations, and Axelar’s AXL posted a sharp one day move, up 19.8% on Jan 25 alongside a volume spike. In a weighted, fully diluted market cap lens like the one used in your sector chart, a small number of large constituents can be enough to pull the whole bucket positive even if the broader market is risk off.
Macro Drivers
December inflation and labor data, released through January, kept markets anchored to a single question, whether disinflation was continuing fast enough to justify additional rate cuts, or slow enough to keep policy restrictive longer. The prints did not signal a sudden inflation reacceleration, but they were firm enough to keep rate expectations sensitive to each incremental release, which matters for crypto because tighter policy expectations usually translate into a higher risk premium.
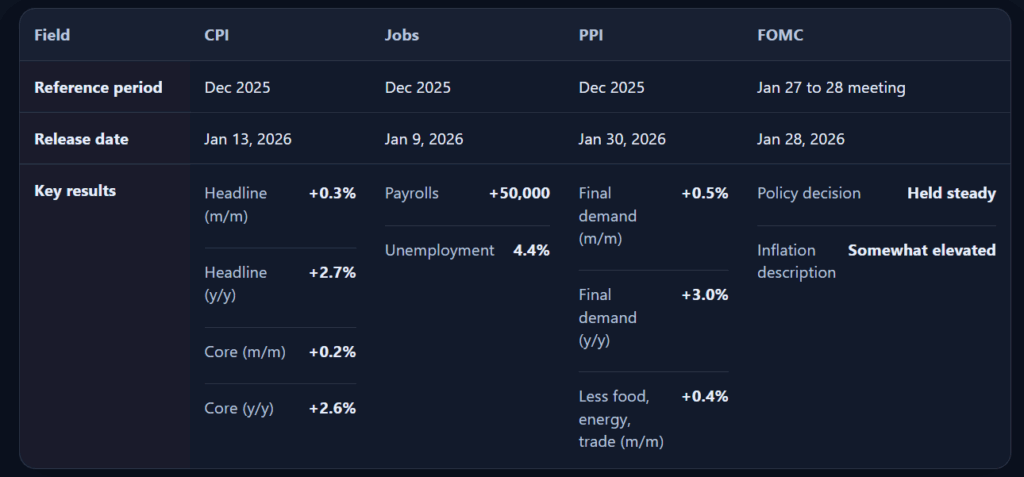
The December CPI-U print released on January 13, 2026 showed headline CPI up 0.3% m/m seasonally adjusted and 2.7% y/y not seasonally adjusted, while core CPI rose 0.2% m/m and 2.6% y/y. These readings reinforced the idea that inflation was still above target, but not accelerating in a way that would force an immediate policy reset.
The December jobs report released on January 9, 2026 showed +50,000 nonfarm payrolls and a 4.4% unemployment rate. The combination supported a cooling labor market narrative, but not a definitive break, which kept the debate open on how quickly inflation could ease without a material growth slowdown.
Wholesale inflation ran firmer than many investors expected. The December PPI release published on January 30, 2026 showed final demand up 0.5% m/m and up 3.0% over 2025 on an unadjusted basis, with final demand less foods, energy, and trade services up 0.4% in December. In a month where the market was already focused on inflation persistence, a hotter wholesale print helped keep the rates path as a live constraint on risk appetite.
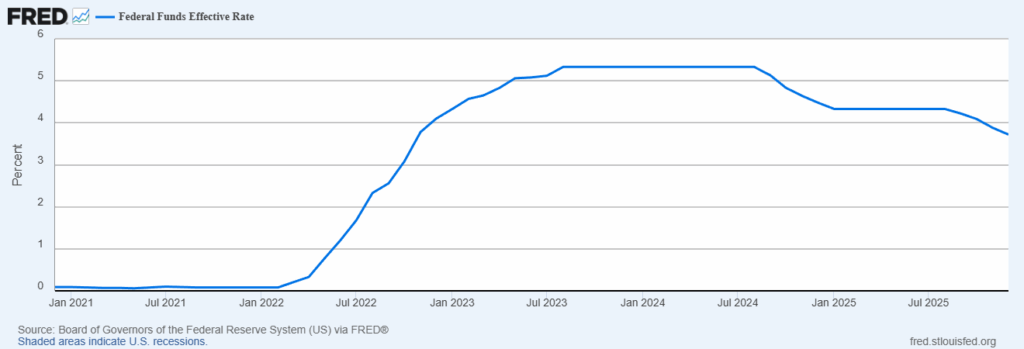
Source: https://fred.stlouisfed.org/series/FEDFUNDS
The month’s policy focal point was January 28, 2026 FOMC decision. The Fed left rates unchanged and described inflation as “somewhat elevated,” while noting job gains remained low and the unemployment rate showed signs of stabilising, and markets were described as having a calm reaction with rate futures still pricing potential cuts later in 2026.
Metals, Equities, AI, and Geopolitics
The 1 year benchmark frames January as a cross asset environment where performance split cleanly by exposure type. GLD trends higher and holds gains into the right edge of the chart, while SPY and QQQ sit in a narrower, steadier positive band. Against that, BTC and ETH sit below those equity benchmarks at the end of the window, and the crypto equity proxies, COIN and HOOD, show larger swings and a sharper giveback into the latest segment of the period.
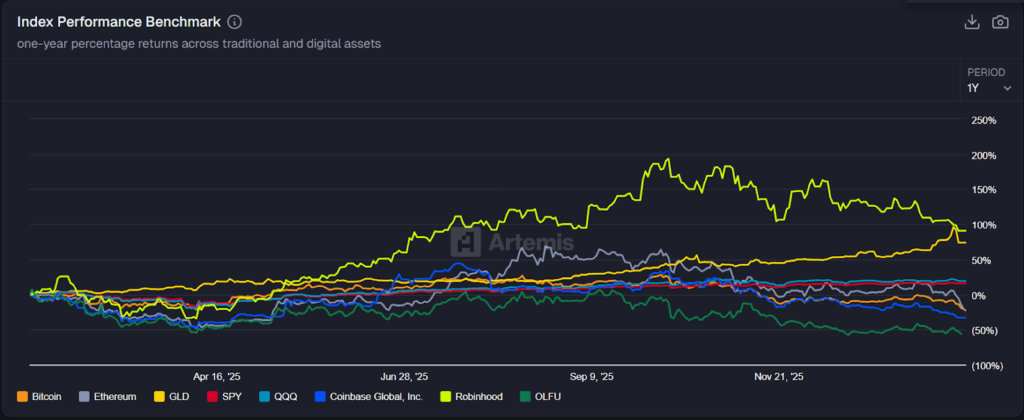
That dispersion matters because it explains why January felt heavy even without a broad equity breakdown. Defensive exposure kept winning, led by GLD strength, while broad equities, SPY and QQQ, held a comparatively tighter range. Against that, crypto risk sat in the penalty box, with BTC and ETH fading into the latest window, and the crypto activity proxies, COIN and HOOD, showing the larger boom bust profile.
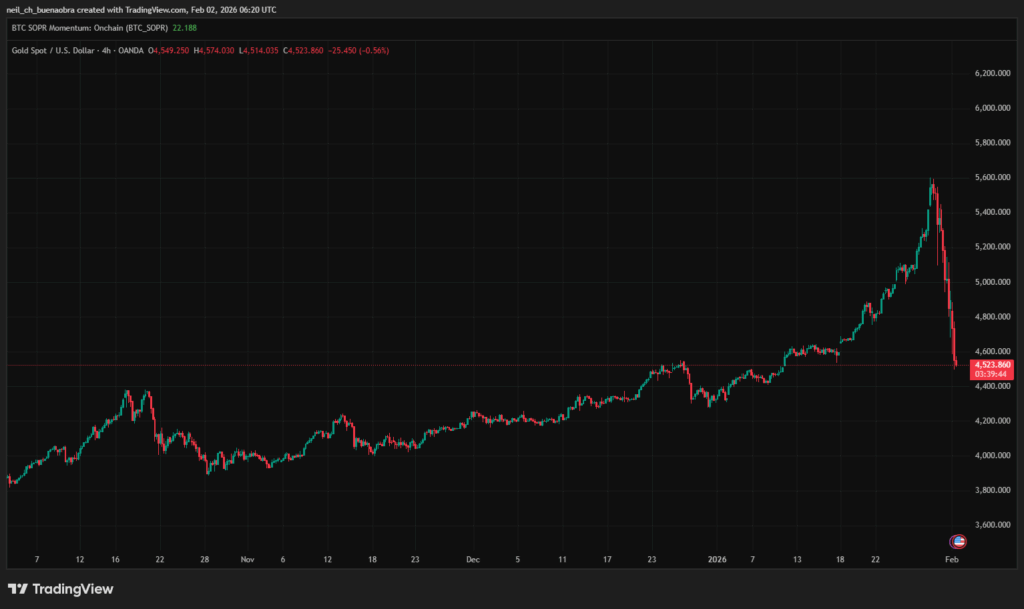
Source: https://www.tradingview.com/chart/2siDZm6r/?symbol=OANDA%3AXAUUSD
Metals reinforced the same risk premium message. Gold did not just grind higher, it accelerated toward the $5,600 area into late January, then reversed sharply into early February back toward the mid $4,000s, a move later framed as profit taking and a broader metals unwind. On the energy side, oil stayed sensitive to supply and geopolitics, including moves tied to Iran, Venezuela and later Iran swings. When metals and oil both move quickly on policy and geopolitics, leverage gets repriced first, and high beta tends to underperform.
Equities still had a bid, but leadership risk mattered at the margin. Fund flow framing stayed constructive into mega cap earnings, with equity inflows, while the AI complex became more sensitive to the capex versus growth tradeoff, including Microsoft’s capex jump and the market’s reaction to heavy spend. In that regime, crypto downside tends to feel more consequential because the adjacent high beta proxies are not stabilising, they are usually moving in the same direction, only faster.
February is anchored to three scheduled US macro events, the January jobs report on Feb 6 at 8:30 a.m., January CPI on Feb 11., and the Jan 28 FOMC minutes on Feb 18. These releases can reset rate expectations quickly, so they are the primary calendar volatility points. Policy and market structure headlines remain a secondary catalyst, especially around stablecoin treatment and spot market oversight, where official statements, draft language, and committee actions can move risk premia before any final outcome.
Wrap Up
January 2026 was a reset month for Bitcoin, with price action led by a -10.57% close-to-close decline from Jan 2 to Jan 31 and a -22.3% peak-to-trough drawdown from the Jan 14 high of 97,838.4 to the Jan 31 low of 75,993.4. Realised volatility also rose sharply, with 43.9% annualised realised volatility calculated from your verified daily close series. Flows reinforced the pressure, with your SoSoValue snapshot showing -$1.61B net flow for US spot Bitcoin ETFs in January, and an ETH ETF net flow line item of -$252.87M dated Jan 30, 2026, both listed as data as provided. Late-month weakness also aligned with thin-liquidity conditions and geopolitics, while cross-asset signals kept the risk premium elevated through strength and reversals in gold, oil sensitivity to headlines, and choppy US equities with leadership risk in mega-cap tech.
Market structure evidence supports a liquidity and positioning driven move into month end, with forced deleveraging acting as a direct transmission mechanism. The report notes estimated 24-hour liquidations exceeding $1.7B around Jan 30, followed by an estimated $2.5615B on Jan 31, both dominated by long liquidations, which added mechanical sell pressure as bids thinned. Policy and market-structure negotiations remained a live risk premium input, alongside operational risk signals tied to custody and account security. Sector performance was broadly negative and correlated, with the largest drawdowns concentrated in higher beta and narrative-heavy buckets, while Bridge was the sole positive outlier, up 12.1%, driven by idiosyncratic strength in large interoperability names including ZRO and AXL as described in your recap.
Macro conditions stayed the background constraint, with December CPI, the December jobs report, and the December PPI print keeping rate expectations sensitive, and the Jan 28, 2026 FOMC decision maintaining the “somewhat elevated” inflation framing while leaving rates unchanged. For February, the report prioritises the next macro checkpoints, the Feb 6 jobs print, Feb 11 CPI, and Feb 18 FOMC minutes, alongside policy headlines that can reprice market structure and stablecoin assumptions. The monitoring framework remains clear and practical: track spot ETF flow persistence, realised volatility and the frequency of large down days, key levels and whether reclaimed levels hold, and cross-asset signals from gold, the dollar, and oil. Liquidity conditions also matter around the Feb 16 US holiday, and token supply events on Feb 28 including JUP and GRASS, where positioning, absorption, and follow-through will help determine whether the late-January flush is being worked off or reinforced.