Volatility Bites Bitcoin
26th February 2026 • 10mins read
This Week’s Recap
- Supreme Court strikes down Trump tariff regime; ruling exposes US administration to potential refunds exceeding $175b.: On Feb. 20, 2026, the U.S. Supreme Court ruled 6 to 3 that Donald Trump exceeded his authority under the International Emergency Economic Powers Act when imposing certain tariffs, putting more than $175 billion in tariff revenue at risk of refunds, according to the Penn Wharton Budget Model. Reuters reported the case is returning to the U.S. Court of International Trade, where companies are expected to pursue refunds.
- Trump announces 15% global tariff, bypassing Supreme Court ruling and raising trade policy uncertainty.: On Feb. 23, 2026, Al Jazeera reported the White House was set to impose a 15% tariff using Section 122 of the Trade Act of 1974 after the U.S. Supreme Court ruled against Trump’s use of the International Emergency Economic Powers Act for tariffs. The report said the move heightened uncertainty and contributed to stalled trade deals.
- Ripple CEO predicts April passage for CLARITY Act, claiming 90% chance of clearing US Senate.: CryptoPotato reported on Feb. 20, 2026 that Ripple CEO Brad Garlinghouse said he sees a 90% chance the CLARITY Act becomes law by April 2026. The article said he framed the bill as a major step toward clearer U.S. crypto regulation, citing what he described as steady legislative progress.
- Bitcoin mining difficulty surges 15% to 144.4T, marking the largest absolute increase since 2021.: The Block reported on Feb. 20, 2026 that Bitcoin mining difficulty rose about 14.7% to 144.4T in a record absolute increase as network hashrate rebounded after U.S. winter storm curtailments. The report linked the jump to miners coming back online, which makes block production harder and reflects a rapid recovery in network computing power.
- Dubai unveils $16 billion real estate tokenisation plan using XRP Ledger for instant property resales.: Securities.io reported on Feb. 24, 2026 that the Dubai Land Department and Ctrl Alt launched Phase Two secondary market trading for tokenized real estate on the XRP Ledger, enabling resale of over $5 million of property tokens, and it cited a Dubai roadmap to tokenize 7% of the city’s real estate market by 2033, worth about $16 billion. The article said the controlled secondary market is intended to improve liquidity and accessibility, and it reported Dubai plans to expand access globally later.
- CME Group to launch 24/7 crypto derivatives trading starting 29 May to meet demand for risk management tools.: On Feb. 19, 2026, CME Group said its cryptocurrency futures and options will begin trading nearly 24/7 on CME Globex starting Friday, May 29 at 4:00 p.m. CT, with at least a two-hour weekly maintenance period over the weekend. CME said the change is intended to support around-the-clock access to regulated crypto markets, with clearing, settlement, and regulatory reporting processed the following business day for weekend trading.
- SEC readies innovation exemption for tokenised securities, outlining path for interaction with existing rules.: On Feb. 18, 2026, SEC Chair Paul Atkins said he would like to consider an “innovation exemption” to let market participants experiment with trading certain tokenized securities on public blockchains and in mechanisms such as automated market makers, and Commissioner Hester Peirce discussed doing this in an incremental way. The remarks indicate the SEC is exploring a policy pathway for onchain trading experiments while keeping tokenized securities within the existing securities law framework described in their discussion.
- Ethereum releases 2026 protocol roadmap, planning to raise gas limit to 100 million for L1 scaling.: Cointelegraph reported on Feb. 20, 2026 that the Ethereum Foundation listed 2026 priorities including continuing to scale Ethereum’s gas limit toward and beyond 100 million, and it highlighted the Glamsterdam upgrade planned for the first half of 2026. The report said the roadmap frames higher L1 throughput and long-term security work, including post-quantum readiness, as key objectives for the network’s 2026 development focus.
- Kraken xStocks tokenised equities volume tops $25 billion, with $3.5b in on-chain trading across Solana and Ethereum.: On Feb. 19, 2026, Kraken said its xStocks tokenized equities exceeded $25 billion in total transaction volume in under eight months, including more than $3.5 billion in onchain activity and over 80,000 unique onchain holders, with xStocks live on Solana, Ethereum, and TON. Kraken said the milestone shows tokenized equities are operating as active markets across centralized and decentralized venues, and it described cross-chain availability and interoperability as the next stage of expansion.
- SEC issues guidance on brokers’ capital stablecoin requirements, allowing 2% haircut for eligible stablecoins.: On Feb. 19, 2026, SEC Trading and Markets staff issued an FAQ stating it would not object if a broker-dealer applied a 2% haircut to proprietary positions in a payment stablecoin when calculating net capital under Exchange Act Rule 15c3-1, and Commissioner Hester Peirce discussed the guidance on Feb. 19, 2026. The guidance reduces the capital penalty for qualifying payment stablecoins, which Peirce said is a practical step that can make it easier for broker-dealers to use stablecoins in regulated market activity.
- ProShares stablecoin-ready ETF generates record $17 billion in day-one volume for its asset class.: Yahoo Finance reported on Feb. 21, 2026 that ProShares’ GENIUS Money Market ETF (ticker IQMM) recorded about $17 billion in first day trading volume. The report said the debut volume signaled unusually strong early demand for a new ETF tied to stablecoin related themes.
- BNP Paribas taps Ethereum for money market fund pilot, issuing shares via a permissioned model.: BNP Paribas said on Feb. 20, 2026 that it issued a tokenised share class of a BNP Paribas Asset Management money market fund on the public Ethereum network via its AssetFoundry platform, using a permissioned access model that restricts holdings and transfers to eligible participants. BNP Paribas said the structure is designed to align tokenised fund shares with regulatory requirements while testing public blockchain infrastructure for fund tokenisation.
- Spot Bitcoin ETFs notch five straight weeks of outflows, totaling $3.8 billion in net withdrawals.: CoinDesk reported on Feb. 23, 2026 that U.S. listed spot bitcoin ETFs saw nearly $3.8 billion in net outflows over five consecutive weeks. The report said the streak reflects sustained risk-off positioning in bitcoin ETF allocations over that period.
- Bitcoin miner Bitdeer liquidates entire 1,132.9 BTC treasury to fund AI data center expansion.: CoinDesk reported on Feb. 23, 2026 that Bitdeer sold its full bitcoin treasury of 1,132.9 BTC, taking its bitcoin holdings to zero, to build liquidity for expansion. CoinDesk said the proceeds are intended to support Bitdeer’s push into AI and high performance computing data center capacity, as part of a broader miner pivot described in the article.
- The SEC gives Cardano a 75-day shortcut to a spot ETF, potentially compressing the approval timeline.: CryptoSlate reported on Feb. 22, 2026 that the SEC has a framework it described as allowing a 75 day timeline for certain spot crypto ETF filings tied to futures market criteria, and it said this could apply to Cardano after CME Cardano futures launched on Feb. 9, 2026. The article said the change could shorten the spot ETF review path compared with earlier spot bitcoin ETF timelines, with the next step being issuers advancing filings once eligibility conditions are met.
- Nearly 7 million Bitcoin (worth $440b) are threatened by advancing quantum computing power.: On Feb. 22, 2026, CoinDesk reported that nearly 7 million bitcoin, including about 1 million attributed to Satoshi Nakamoto, could be at risk if quantum computing breaks the cryptography securing certain older, exposed public keys, valuing the potentially vulnerable coins at about $440 billion. The report said the prospect has prompted debate over whether and how to protect those coins, because any credible quantum capability against Bitcoin keys would create a major security and market risk.
- Strategy logs 100th Bitcoin purchase, adding 592 coins for $39.8m to reach 717,722 BTC total holdings.: MarketWatch reported on Feb. 23, 2026 that Strategy bought 592 bitcoin for $39.7 million in the week ended Feb. 22 at an average price of $67,286, bringing holdings to 717,722 bitcoin. The report said the purchase underscores Strategy’s continued accumulation strategy despite bitcoin’s recent price declines and a large unrealized loss position described in the article.
- Crypto.com approved for U.S. federally regulated crypto custodian bank, consolidating custody services.: CoinDesk reported on Feb. 23, 2026 that Crypto.com received conditional U.S. approval to establish a national trust bank, identified as Foris Dax National Trust Bank, to expand custody and related digital asset services under federal oversight. The report said the approval would allow Crypto.com to consolidate and scale custody services within a federally regulated structure if the charter becomes fully effective.
- BitMine Immersion adds $98 million of Ether, now holding 4.42 million ETH (3.66% of total supply).: On Feb. 22, 2026, BitMine Immersion Technologies said it held 4,422,659 ETH valued at $1,958 per ETH and stated this equaled 3.66% of ETH supply based on 120.7 million ETH, alongside other crypto and cash holdings it reported totaled $9.6 billion. The release said BitMine’s accumulation is part of its strategy to build a large ETH treasury, and it stated its MAVAN staking solution was on track to launch in Q1 2026.
- Standard Chartered predicts stablecoins may generate $1 trillion in T-bill demand by 2028, with market caps reaching $2 trillion.: CoinDesk reported on Feb. 23, 2026 that Standard Chartered projects stablecoin market capitalization will reach $2 trillion by end 2028 and said that could translate into around $1 trillion of demand for U.S. Treasury bills. The report said the forecast implies stablecoins could become a materially larger structural buyer of short dated U.S. government debt, affecting Treasury issuance strategy as described in the article.
- Over $615 million in crypto long positions liquidated from the market in the past 24 hours.: On Feb. 23, 2026, Phemex News reported that $615 million was liquidated from the cryptocurrency market in the past 24 hours. The outlet said the liquidations highlighted heightened volatility and market pressure.
- Trump panel examines stablecoin proposal for postwar Gaza to revive economic activity and limit physical cash flows.: On Feb. 24, 2026, the Financial Times reported that officials linked to Donald Trump’s “Board of Peace” were exploring a US dollar pegged stablecoin for Gaza, with discussions involving Gaza’s new National Committee for the Administration of Gaza and the Office of the High Representative for Gaza. The Financial Times said backers argue the plan could help restart commerce where access to physical cash and banking has been disrupted, while critics raised concerns about economic isolation and infrastructure constraints.
- Fed proposes rule to scrap reputation risk, aiming to end supervisors pushing banks to cut off crypto businesses.: On Feb. 23, 2026, the Federal Reserve Board announced a proposal that would remove “reputational risk” from its bank supervisory guidance and said comments are due within 60 days after publication in the Federal Register. The Fed said the change is intended to keep supervision focused on financial risks while maintaining expectations for strong risk management and compliance.
- SEC approves WisdomTree 24/7 tokenized fund trading, adding momentum to the $10b tokenized Treasury market.: On Feb. 23, 2026, Reuters reported that the SEC granted WisdomTree a one off exemption allowing intraday trading in tokenized shares of its Treasury Money Market Digital Fund, instead of end of day mutual fund pricing. Reuters said the relief could speed settlement and improve retail access to liquidity, and WisdomTree said it was the first for a tokenized mutual fund.
- Meta plans stablecoin integration for late 2026, eyeing a second half comeback for payments and potential $1T Treasury shift.: On Feb. 25, 2026, The Paypers reported that Meta was planning to integrate stablecoin based payments into its platforms in the second half of 2026, citing people familiar with the matter. The Paypers said the effort would mark Meta’s re entry into stablecoins after its earlier crypto project, positioning stablecoin payments as a potential new rail for its apps.
- Coinbase rolls out stock and ETF trading, expanding beyond crypto to become an ‘everything exchange’ for US users.: Investopedia reported on Feb. 26, 2026 that Coinbase launched commission-free stock and ETF trading for U.S. users, with 24/5 availability. The report said the launch expands Coinbase beyond crypto and aligns with CEO Brian Armstrong’s stated goal of becoming an “everything exchange.”
- Bitcoin tops $69.5k after stock market rebound and US policy clarity boosted risk appetite.: Investopedia reported on Feb. 26, 2026 that bitcoin rose about 7% to around $69,000 alongside a broader rebound in related risk assets. The report linked the move to improved risk appetite as markets rallied, supporting gains in crypto-exposed stocks.
- Circle Q4 earnings beat estimates, with USDC issuance growing and shares surging up to 29%.: Reuters reported on Feb. 25, 2026 that Circle’s fourth-quarter USDC circulation rose 72% from a year earlier to $75.3 billion and that revenue from reserves totaled $733 million. Reuters said the results showed USDC continuing to scale rapidly, citing analyst commentary on improving profitability.
- Senator opens probe on Binance over alleged $1.7 billion flows to Iranian entities, seeking records.: Senator Richard Blumenthal said on Feb. 24, 2026 that he opened an inquiry into Binance and requested information after reporting alleged $1.7 billion in flows tied to Iran proxies and Russia’s shadow fleet. The statement said the next step is Binance providing records and answers to the senator’s questions.
- Stripe considers acquiring some or all of PayPal in a potential major payments industry consolidation.: Reuters reported on Feb. 24, 2026 that Stripe is considering acquiring all or parts of PayPal, citing a Bloomberg News report, and that PayPal shares rose nearly 7% after the report. Reuters said both companies declined to comment and described the discussions as early-stage interest.
Bitcoin Market Analysis
Bitcoin was reported to have traded primarily within the $60,000 to $70,000 region over the week, with rallies reaching into the upper end of that band and a push above roughly $69,500 being recorded during a risk asset rebound. The weekly tape was therefore defined by range behavior rather than a clean directional extension, with advances being absorbed near overhead supply and declines being contained above the most visible demand zone.
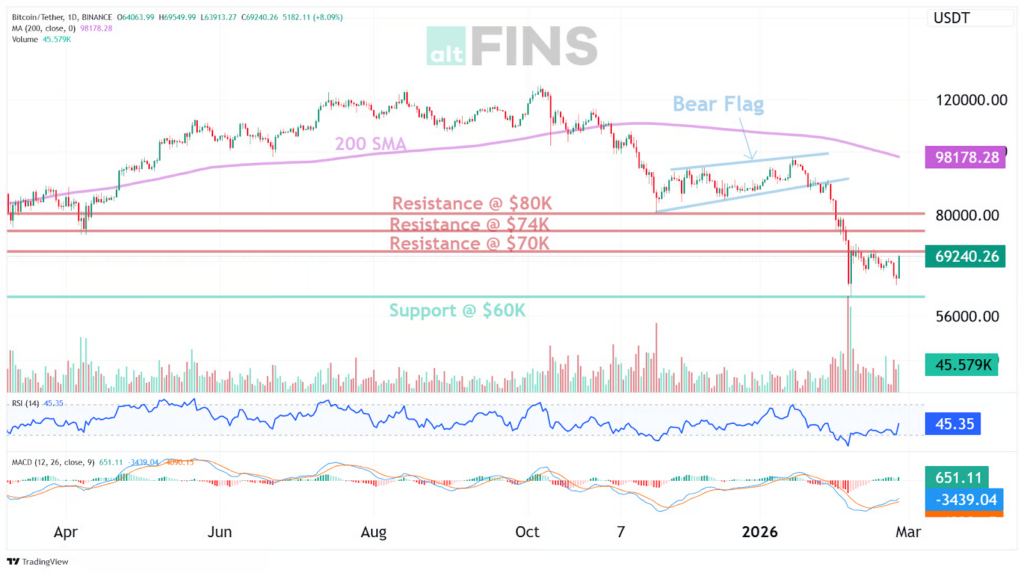
Source: https://altfins.com/technical-analysis
A downtrend state was maintained across short, medium, and long horizons, and price was kept well below the 200 day simple moving average, which was marked near $98,178.28. Momentum was kept neutral, with RSI-14 printed at 45.35, and no overbought or oversold condition being signaled by that reading. MACD conditions were printed with a positive histogram near 651.11 while the MACD line remained near -3,439.04, a mix that was consistent with improving short-run momentum inside a broader bearish regime.
Key levels were defined with support centered at $60,000, and resistance centered first at $70,000, then at $74,000, with a higher supply area indicated near $80,000. A polarity framework was implied by the repeated importance of former support and breakdown zones during retests, and supply was therefore expected to be expressed as $70,000 and $74,000 were approached. Invalidation for the near-term range thesis was most cleanly expressed by sustained acceptance below $60,000, while a constructive regime shift would be better supported by sustained acceptance above $74,000 rather than by a single intraday probe.
A mixed institutional flow regime was recorded through U.S. spot Bitcoin ETF activity over Feb 18 through Feb 24, 2026, with daily net flows posted at -$133.27 million, -$165.76 million, +$88.04 million, -$203.82 million, and +$257.71 million, for a net -$157.10 million across those sessions. The largest outflow was registered on Feb 23 at -$203.82 million, and the largest inflow was registered on Feb 24 at +$257.71 million. Short-run momentum was improved late in the window as the largest outflow was followed by the largest inflow, yet net positioning across the span remained negative, and the flow backdrop was therefore kept as a headwind rather than a tailwind.
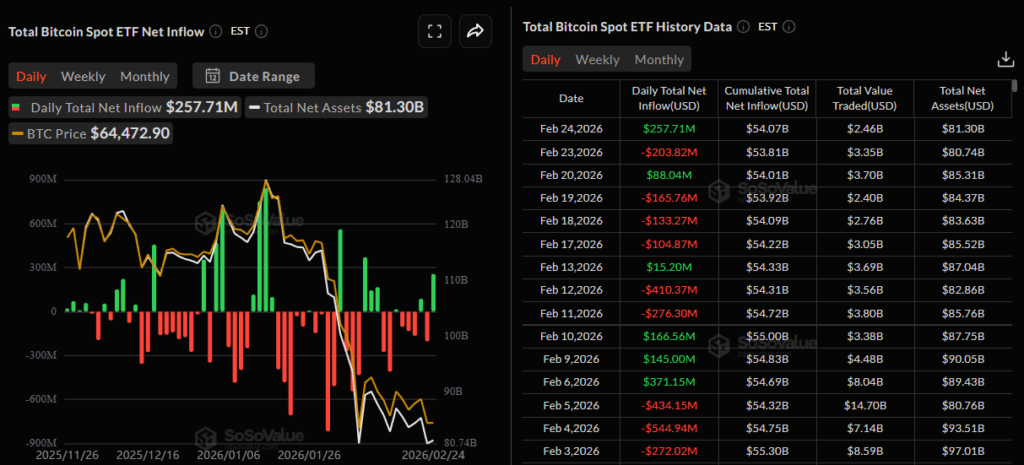
Source: https://sosovalue.com/assets/etf/us-btc-spot
Macro sensitivity was reinforced by the way upside traction was associated with a rebound in equities and improved policy clarity, with risk appetite being cited as a supporting factor as price approached the $70,000 area. A separate flow narrative was also carried by reporting that U.S. spot Bitcoin ETFs had experienced five consecutive weeks of net withdrawals totaling about $3.8 billion, a development that aligned with the choppy, reaction-driven price behavior observed near resistance.
Network and corporate headlines added cross-currents. Mining difficulty was reported to have increased roughly 15 percent to about 144.4T, and miner balance sheet behavior was highlighted by reporting that Bitdeer had liquidated its entire 1,132.9 BTC treasury to fund AI data center expansion. Corporate accumulation was kept in view through reporting that Strategy had logged its 100th bitcoin purchase, adding 592 BTC for about $39.8 million to reach 717,722 BTC in total holdings. Longer-horizon protocol risk was elevated in market discussion through reporting that nearly 7 million BTC, valued around $440 billion, could be exposed under advancing quantum computing capabilities, although that exposure estimate was dependent on assumptions about address types and key exposure, and it should therefore be treated as a debated risk framework rather than an audited total.
Ethereum Market Analysis
Ethereum was described as consolidating inside a sideways channel bounded by $1,800 and $2,100, while an observed price reading of $1,858.58 was associated with the same window as the ETF flow table. A complete daily open and close set, along with a confirmed week high and week low, was not provided, so the weekly candle profile and the precise path taken through the week could not be stated with certainty. Within those constraints, trade was best treated as occurring under a ceiling that had remained intact, with price having been held nearer the lower portion of the stated band at the time of the observed reading. The market’s tone was therefore framed as defensive by default, not because strength was absent, but because confirmation could not be claimed.
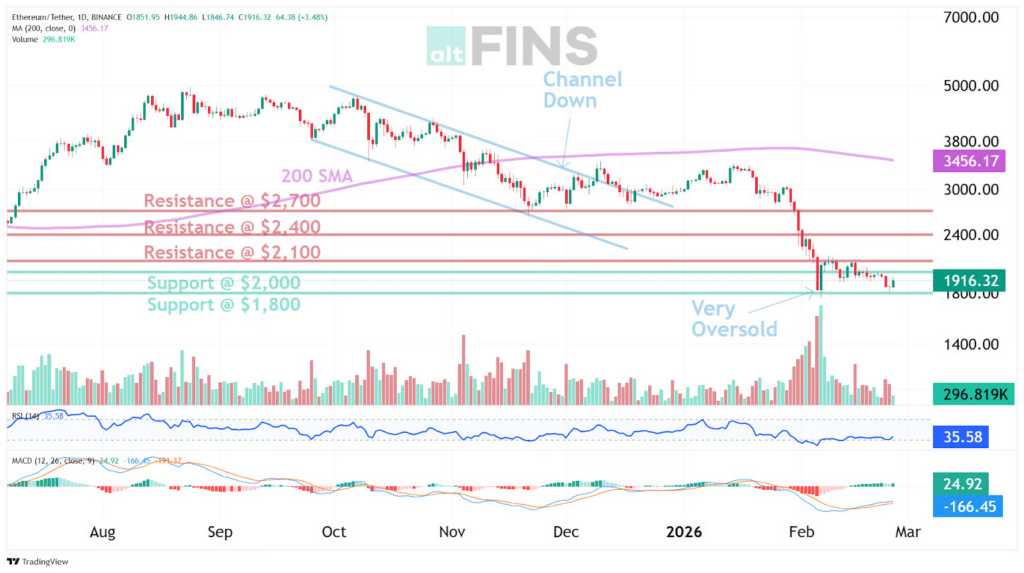
Source: https://altfins.com/technical-analysis
A multi horizon trend state was supplied, with the short term trend labeled down and both the medium term and long term trends labeled strong down. RSI 14 was described as neither overbought nor oversold, with the condition defined as being between 30 and 70, while no numeric RSI value was provided and no moving averages, MACD, or volatility metrics were supplied. With that limitation, the technical picture was anchored to structure and trend labels rather than to indicator crossovers or exhaustion signals. Consolidation inside a defined band was therefore read as a pause within a broader bearish framework, where time had been bought but trend pressure had not been disproved. The implication was that patience would have been rewarded more reliably than urgency, even if the tape had occasionally tempted otherwise.
Support and resistance were defined with nearest support at $2,000 followed by $1,800, and nearest resistance at $2,100 followed by $2,400. A breakout condition was specified as a move above $2,100, with a recovery path toward $2,400 resistance having been outlined, while a downside break in the direction of the existing downtrend was stated as the more likely scenario. No explicit invalidation level was provided beyond the practical role of the levels themselves, so a formal thesis invalidation line could not be asserted and had to be treated as uncertain. In practice, the band edges were forced into that role, with $2,100 functioning as the upside trigger level and $2,000 then $1,800 functioning as the downside decision points. The subtext was straightforward, a market that needed to prove strength would have been expected to do so at resistance, not after the fact.
Expectations were kept conditional and were kept tied to the structure that was supplied. If acceptance had been achieved above $2,100, continuation toward $2,400 would have been the cleanest expression of the recovery thesis, and that zone would have been expected to attract supply given its designation as resistance. If a break had been registered below support, movement toward the next support level would have been favored, consistent with the stated downtrend regime across time horizons. Because the sequence of closes and intraperiod extremes was not provided, the balance of outcomes could not be quantified from realized weekly statistics, so the directional bias was left qualitative and aligned to the stated view that continuation with the downtrend was more likely. The quiet message carried by that framing was that risk would have been better defined than reward until the upper boundary had been reclaimed.
Source: https://sosovalue.com/assets/etf/us-eth-spot
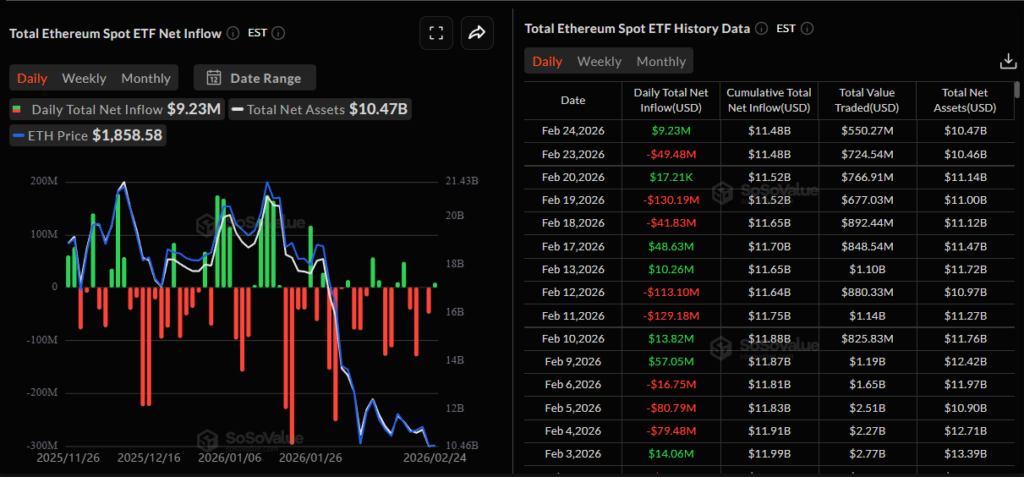
Ethereum spot ETF activity was provided through seven dated entries spanning Feb 13, 2026 through Feb 24, 2026. Net flow across those entries was recorded at negative $153.36 million, with the largest inflow recorded at positive $48.63 million on Feb 17, 2026 and the largest outflow recorded at negative $130.19 million on Feb 19, 2026, while total value traded across the entries was recorded at $5.56 billion. Total net assets were recorded as having declined from $11.72 billion to $10.47 billion across the same dated entries, a change of negative $1.25 billion, while cumulative net inflow readings were shown around $11.48 billion to $11.70 billion within the displayed rows. On those figures, participation was suggested by turnover, yet net allocation pressure was suggested by the negative net flow sum and the decline in net assets. The implication was that activity had not automatically translated into sustained sponsorship, and that rallies would have been expected to meet scrutiny until flows had rotated more decisively.
Four narrative drivers were supplied and were treated as context rather than as timing tools. A 2026 protocol roadmap was described as having been released, with gas limit increases toward 100,000,000 having been planned for L1 scaling, and that theme was treated as structurally constructive while its near term market relevance was left uncertain. Kraken xStocks tokenized equities activity was described as having reached $25 billion in volume, with $3.5 billion in on chain trading across Solana and Ethereum, and that was treated as incremental evidence of tokenization demand touching Ethereum. BNP Paribas was described as having used Ethereum for a money market fund pilot via a permissioned model, reinforcing an institutional experimentation narrative that tended to matter most when liquidity had been selective. BitMine Immersion was described as having added $98 million of Ether and as holding 4.42 million ETH, stated as 3.66 percent of total supply, and that was treated as a positioning signal whose market impact would have depended on execution, custody, and the degree to which such concentration had been welcomed or discounted by participants.
Volatility Bites Bitcoin
The Supreme Court decision on Feb. 20 did not restore a stable baseline for markets, it shifted uncertainty from a court centered question into a policy execution question. Investors quickly moved from pricing the legality of one tariff framework to pricing the probability, scope, and speed of replacement measures under other authorities. In practical terms, the ruling narrowed one pathway while leaving the broader tariff trajectory unresolved, and that kept the distribution of outcomes wide rather than collapsing it.
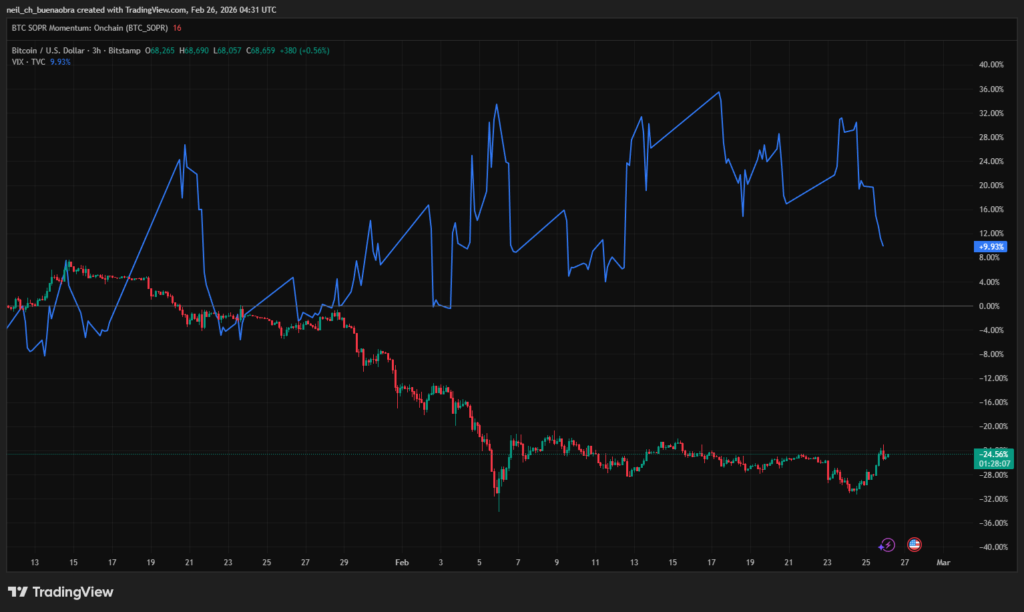
Source: https://www.tradingview.com/chart/2siDZm6r/?symbol=TVC%3AVIX
That regime shift typically shows up first in volatility, because volatility is the market’s way of admitting it cannot confidently map the next few steps. When implied volatility rises and stays elevated, it signals persistent demand for protection and a lower tolerance for surprise. The key subtext is that policy becomes a source of repeated discontinuities, so participants pay up to hedge not a single event, but a sequence of potential announcements, revisions, exemptions, and escalations.
In the same environment, high beta assets tend to trade like liquidity instruments, they struggle when protection demand rises and risk budgets tighten. The concurrent pattern of higher volatility alongside weaker bitcoin fits a risk off read through: hedging costs up, positioning more defensive, and marginal demand for risk exposure reduced until the policy path becomes more legible. The market reaction after the decision, in other words, is consistent with uncertainty returning in a new form, not with uncertainty being resolved.
Mark Your Calendars
Economic Data Releases:
- March 6, 2026 (Friday): U.S. unemployment rate
Token Unlock
- February 28, 2026 (Saturday): GRASS (GRASS) unlocks $11.40 M (13.15 % of market cap)
- February 28, 2026 (Saturday): JUP (JUP) unlocks $40.61 M (7.94 % of market cap)
- March 1, 2026 (Sunday): SUI (SUI) unlocks $41.99 M (1.13 % of market cap)
- March 5, 2026 (Thursday): ENA (ENA) unlocks $18.74 M (2.24 % of market cap)
- March 6, 2026 (Friday): HYPE (HYPE) unlocks $275.98 M (2.72 % of market cap)