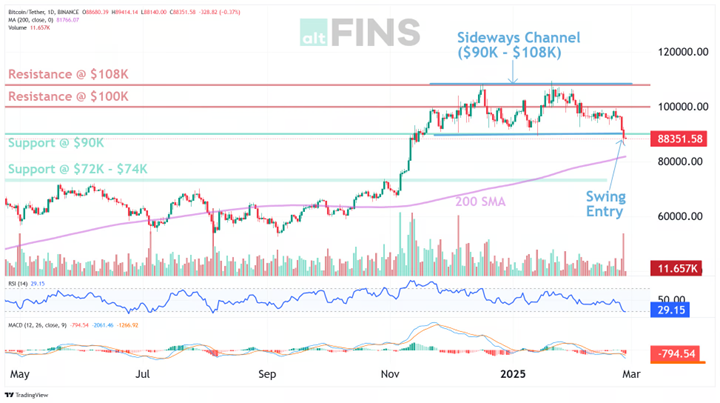
Bitcoin faced a turbulent week as a $1.5 billion Bybit hack, escalating tariff concerns, and broader macroeconomic uncertainties triggered a sharp sell-off, breaking key support levels. The price plummeted from $98,000 on February 20 to $82,500 by February 27, driven by record ETF outflows that accelerated the decline below critical psychological thresholds. Bitcoin dominance surged, reflecting a shift toward risk-off behavior, while extreme oversold conditions hint at potential accumulation. Adding to the volatility, a major options expiry on February 29 could introduce short-term price distortions. Whether Bitcoin stabilizes or sees further downside toward $75,000 depends on ETF flows, institutional sentiment, and its ability to reclaim resistance levels near $90,000–$93,500.
Source: https://altfins.com/technical-analysis
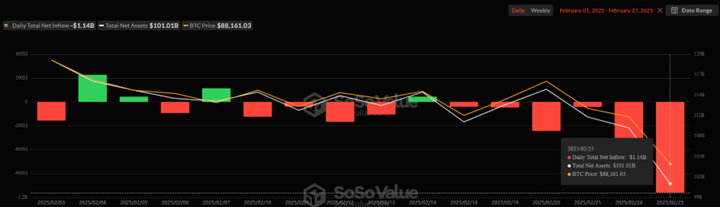
A major factor behind this week’s volatility is the unprecedented $937.9 million outflow from U.S. spot Bitcoin ETFs on February 25, marking the largest daily withdrawal in history. Historically, ETF flows have served as a leading indicator for Bitcoin’s price direction, making this a critical development. The sell-off coincided with Bitcoin breaking below $90,000, further exacerbating market weakness. The combination of institutional exits and a broader market correction suggests that Bitcoin is now searching for a strong support zone, with $75,000 emerging as a key level to watch.
Source: https://sosovalue.com/
The divergence between institutional and retail behavior has been striking this week. Institutional investors have been significantly reducing exposure, as evidenced by the substantial ETF outflows. This suggests that larger investors are either securing profits from the recent rally or positioning for further downside risk. Meanwhile, with RSI levels dropping below 25 indicating extreme oversold conditions, there are signs that some market participants may view the current price levels as a potential buying opportunity, while institutions continue to exercise caution.
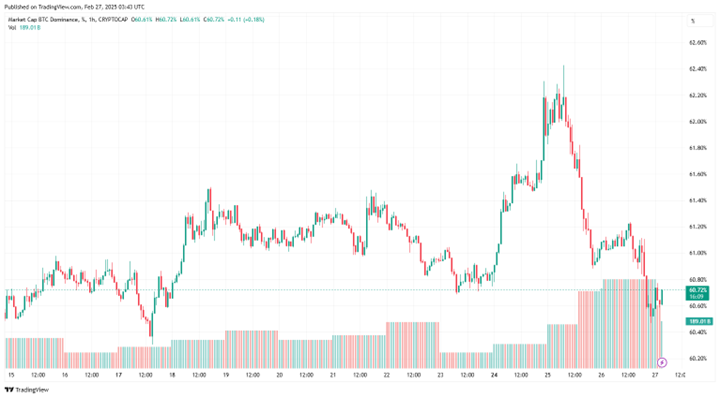
One significant trend has been the rising Bitcoin dominance, now at 60%, indicating that capital is consolidating within BTC while altcoins suffer more pronounced losses. Historically, an increase in Bitcoin dominance during a downturn signals a shift toward safer assets within the crypto market, as traders rotate out of speculative plays and into BTC. However, if dominance continues rising without a price recovery, it could suggest that liquidity is exiting the crypto space altogether rather than rotating within it.
Source: https://www.tradingview.com/
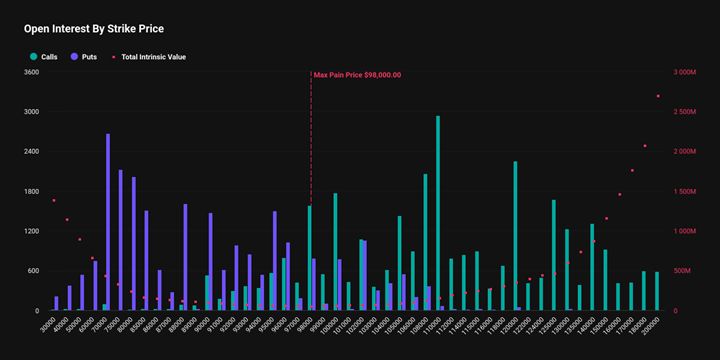
Adding to the market’s complexity is the upcoming Bitcoin options expiry on February 29, where approximately $5 billion worth of contracts will expire on Deribit. The max pain price—the level at which options sellers experience the least financial loss—is set at $98,000, significantly higher than the current spot price. This gap presents a potential price distortion, as options sellers may attempt to push Bitcoin’s price higher before expiry. If bullish momentum fails to materialize, the current bearish trend could persist, with price action likely gravitating toward the next major support at $74,000.
Source: https://www.deribit.com/statistics/BTC/metrics/options
While the max pain theory often plays a role in short-term market movements, broader sentiment suggests that Bitcoin is still facing strong resistance levels at $90,000 and $100,000. Breaking above these levels would require renewed institutional buying, which remains absent amid ongoing ETF outflows. If Bitcoin fails to reclaim key levels post-expiry, further downside toward $74,000 is increasingly likely.
Bitcoin’s decline of over 23.4% from its January all-time high of $109,350 has officially pushed it into bear market territory. the combined impact of ETF sell-offs, macroeconomic uncertainty, and security concerns such as the $1.5 billion Bybit hack has weakened investor confidence, making it difficult for BTC to recover in the short term. However, long-term accumulation signals remain strong, as Bitcoin whales continue to withdraw from exchanges, reducing available supply and easing potential selling pressure. Historically, corrections of this scale have often triggered significant accumulation phases, indicating that the foundation for the next bullish cycle may already be taking shape.
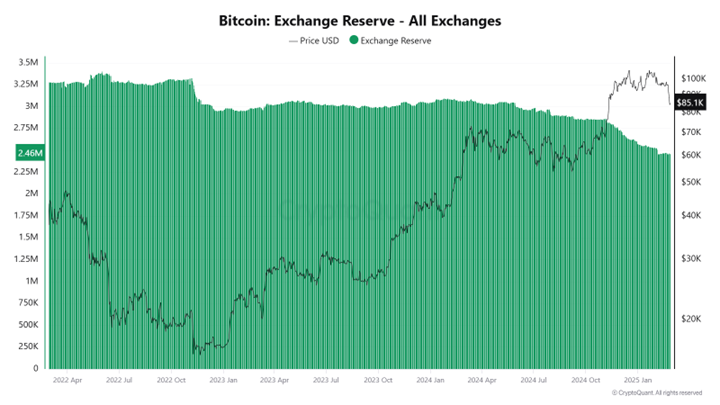
Source: https://cryptoquant.com/
Meanwhile, regarding a potential relief rally, Rekt Capital highlights that Bitcoin is approaching the completion of a CME Gap between $78,000 and $80,700, formed in November 2024. However, as the price retraces, a new CME Gap has emerged between $92,700 and $94,000, aligning with a key re-accumulation support level. This pattern suggests that Bitcoin could potentially revisit $93,500 as part of a post-breakdown relief rally, given its historical tendency to fill nearly every CME Gap since March 2024.
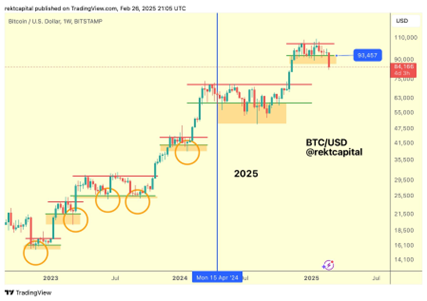
Source: https://x.com/rektcapital/
Given current market conditions, traders should closely watch key support at $74,000, as a sustained breakdown below this level could accelerate selling pressure. On the upside, $90,000 and $93,500 serve as critical resistance levels, with $93,500 aligning with a new CME Gap and potential relief rally target, as highlighted by Rekt Capital. The $98,000 options max pain level remains another key area to watch. Monitoring ETF flows will be crucial, as recent record outflows exceeding $1 billion on February 26 have contributed to market weakness. A slowdown in these outflows could signal the return of institutional interest. Additionally, Bitcoin dominance has risen to 62%, indicating that capital is consolidating within BTC, though it remains unclear whether this signals a broader rotation within crypto or continued market-wide risk aversion.
For long-term investors, Bitcoin’s oversold conditions and exchange outflows by whales suggest potential accumulation opportunities. However, caution is warranted, given macroeconomic uncertainties and ongoing institutional sell pressure. If ETF outflows stabilize and sentiment improves post-options expiry on February 29, Bitcoin could see a relief rally toward $90,000–$93,500. However, if institutional selling persists, the bearish trend could continue, with $75,000 as the next major downside target.
This Week’s Headlines
- Ethereum Foundation supports Tornado Cash developer by donating $1.25 million to Alexey Pertsev’s legal defense, reinforcing the stance that “writing code is not a crime.”
- ARK Invest reallocates funds by shifting nearly $9 million from its Bitcoin ETF holdings to Coinbase shares amid the ongoing market slump.
- Marathon Digital reports record revenue with a 69% increase to $656.4 million, while its Bitcoin holdings grew to 44,893 BTC, including 10,374 BTC loaned or used as collateral.
- MEXC invests $20M in Ethena’s USDe, further intensifying the stablecoin wars with additional $16M backing for Ethena Labs and incentives like zero-fee trading pairs and a $1M reward pool
- XRP open interest drops to 2025 low: XRP’s futures open interest has fallen to its lowest point this year.
- Ethereum makes slight recovery amid increased institutional hedging: While Ethereum’s price has experienced a modest uptick, there has been a notable surge in institutional downside hedging.
- Ethereum’s Pectra upgrade faces issues as several blocks were missed and finalization remains pending on the Holesky testnet due to misconfigurations in execution clients, particularly incorrect deposit contract addresses.
- Grayscale files for spot Polkadot and Cardano ETFs as competition in the altcoin ETF space heats up, marking another step in Grayscale’s efforts to expand its crypto investment products.
- Tron to Launch ‘Gas Free’ Feature for Tether USDt Next Week: Tron is set to introduce a ‘Gas Free’ feature enabling commission-free transactions for Tether’s USDT stablecoin.
- SEC Drops Investigation into Uniswap Labs: The U.S. Securities and Exchange Commission (SEC) has concluded its investigation into Uniswap Labs without pursuing enforcement action.
- Canary Capital files for first spot Hedera HBAR ETF, aiming to provide direct investor exposure to HBAR as institutional interest grows.
- Solana drops to lowest price since October after a $22B memecoin wipeout, driven by scandals and declining liquidity.
- DekaBank launches crypto trading and custody for institutions, managing €377B in assets after securing a BaFin crypto custody license.
- Ethereum’s Pectra upgrade hits issues on the Holesky testnet, with missed blocks and pending finalization as developers work on fixes.
- Coinbase celebrates end of SEC’s crackdown as focus shifts to Congress: The SEC has agreed in principle to dismiss its lawsuit against Coinbase, signaling a shift in regulatory approach under the current administration.
- Bitwise anticipates substantial demand for XRP ETFs: Bitwise’s Chief Investment Officer, Matt Hougan, predicts that significant interest in XRP ETFs will lead to numerous filings and launches throughout the year, reflecting growing institutional appetite for diversified crypto investment products.
- Dubai recognizes USDC and EURC as official stablecoins under its crypto token regime, enabling institutional integration within the Dubai International Financial Centre (DIFC).
- Bybit hit by a $1.5B hack, surpassing 2024’s largest breaches and tripling the scale of the Mt. Gox collapse, though the exchange assures customer funds remain secure.
- Crypto sponsorships in sports surge across F1, football, MMA, and snooker, as companies ramp up high-visibility deals to drive mainstream adoption.
- SEC ends investigation into OpenSea, signaling a more lenient regulatory stance and easing pressure on the NFT market.
- Michael Saylor urges the U.S. to acquire 20% of Bitcoin, arguing it would serve as “economic armor” and strengthen the nation’s financial position.
- SEC to dismiss enforcement case against Coinbase, signaling a shift in regulatory stance and easing legal pressure on the exchange.
- Franklin Templeton files for Solana ETF, expanding its crypto offerings beyond Bitcoin and Ethereum as institutional interest grows.
- XRP ETFs Near $8 Billion Milestone: Grayscale’s recent filing for an XRP ETF has been published in the Federal Register, initiating the SEC’s review process. A decision is anticipated by October 18, 2025, potentially paving the way for significant institutional investment in XRP.
- US Crypto Index ETFs Experience Slow Start: Recently launched cryptocurrency index ETFs in the United States, holding assets like Bitcoin and Ethereum, have seen modest inflows since their debut. This tepid reception suggests that investors may be cautiously evaluating these diversified crypto investment vehicles.
- Robinhood’s Crypto Trading Volume Projected to Triple by 2026: Analysts at Bernstein forecast that Robinhood’s cryptocurrency trading volume could triple by 2026, driven by a prolonged market rally and increased retail investor participation. This growth is expected to significantly boost the platform’s revenue from crypto transactions.
Mark Your Calendars
Economic Data Releases:
- February 27, 2025 (Thursday): Initial Jobless Claims for the week ending February 22, 2025. (Census.gov)
- February 28, 2025 (Friday): Personal Income and Outlays Report for January 2025. (Barrons)
- March 4, 2025 (Tuesday): U.S. Factory Orders for January 2025. (Census.gov)
- March 5, 2025 (Wednesday): ADP National Employment Report for February 2025. (Investopedia)
Cryptocurrency Events
- February 27, 2025: SONIC to launch its Mobius Mainnet, the first chain extension on Solana, enhancing scalability for dApps
Token Unlock
- March 1, 2025
- SUI: $66.14M unlocking (0.74% of circulating supply).
- March 2, 2025
- ZETA: $13.64M unlocking (6.48% of circulating supply).
- March 3, 2025
- ENA: $17.13M unlocking (1.30% of circulating supply).
")
")


")

