Strategy Overtakes IBIT as Bitcoin Presses $80,000
23rd April 2026 • 8 mins read
This Week’s Recap
- Charles Schwab begins rollout of direct spot Bitcoin and Ether trading: The $12 trillion brokerage is opening direct crypto access to retail clients, widening the pool of traditional buyers who can trade spot assets without leaving existing brokerage rails.
- Morgan Stanley’s MSBT fund tops $100 million in its first six trading days: The bank’s low-fee Bitcoin ETF reached nine figures faster than many expected, adding another bank-branded distribution channel to the spot ETF market.
- SEC staff statement gives some self-custody apps a five-year path without broker registration: The new guidance offers room for neutral wallet and interface providers to operate under disclosure guardrails rather than full broker treatment.
- CLARITY Act markup is now expected by mid-May: The timetable moved as lawmakers worked through the stablecoin-yield dispute that has delayed broader market-structure legislation.
- White House study says stablecoin yields do not currently threaten banks: That finding weakens one of the main arguments used against letting stablecoin issuers pass returns through to users.
- Goldman Sachs files for a Bitcoin Premium Income ETF: The product would use covered calls to turn Bitcoin exposure into an income strategy that fits more traditional adviser mandates.
- Anthropic unveils Mythos AI for autonomous smart contract vulnerability hunting: The release sharpened concern that AI will accelerate both auditing and exploitation at the same time.
- South Korea will pilot tokenized deposit tokens for government spending: The program moves tokenized money further into state-backed payments infrastructure instead of keeping it in private-sector pilot mode.
- Bitcoin hits $78,000 as easing Middle East tension lifts risk appetite: The move tied crypto’s rebound directly to a better macro and geopolitical tape, with oil backing off and risk assets recovering together.
- Kraken parent Payward agrees to acquire Bitnomial for $550 million: The deal gives Kraken a fuller U.S. derivatives stack and shows that exchange consolidation is still active in regulated venues.
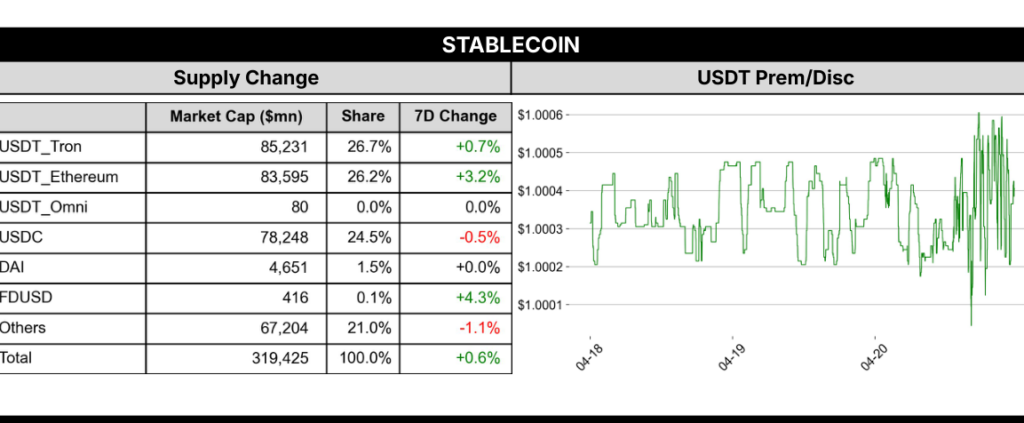
- Stablecoin supply reaches a record $320 billion: The growth kept coming even with the U.S. legislative fight unresolved, underlining demand for on-chain dollar rails.
- Circle is sued over the $280 million Drift Protocol hack: The case centers on whether the issuer acted fast enough to freeze stolen USDC after the exploit.
- Tether anchors a $127.5 million Drift rescue package: The recovery financing came with a strategic condition that pushes Drift toward USDT and away from USDC.
- Ethereum Foundation says 100 North Korean workers were identified across 53 crypto projects: The report broadened the market’s view of security risk from code flaws alone to embedded operational compromise.
- BIP 361 proposes a Bitcoin migration path for quantum-vulnerable coins: The proposal revived a debate over whether protecting the network should come before preserving legacy address access.
- France announces new measures against crypto wrench attacks: Physical security is becoming a policy issue as kidnapping and extortion cases keep climbing in Europe.
- Strategy overtakes BlackRock’s IBIT after buying 34,164 BTC for $2.54 billion: The purchase lifted Strategy’s holdings to 815,061 BTC and put the corporate treasury trade back on the front page.
- Kelp DAO hackers are already laundering millions from a $293 million exploit: The exploit became the week’s defining reminder that protocol risk can still wipe out otherwise constructive market tone.
- New York’s attorney general sues Coinbase and Gemini over alleged state-law violations: The case extends the prediction-market and state-jurisdiction fight into a fresh legal front.
- Banks fund attack ads and lobbying to slow the CLARITY Act: The industry’s concern is simple: yield-bearing stablecoins could pull deposits out of the banking system.
- An oil tanker was attacked after paying a fake Hormuz transit fee in BTC or USDT: The episode fused geopolitical stress with crypto fraud in a way that no one in the market could ignore.
- DoorDash is bringing stablecoin payouts onto Stripe-backed Tempo rails: The use case matters because it frames stablecoins as payout infrastructure rather than just trading collateral.
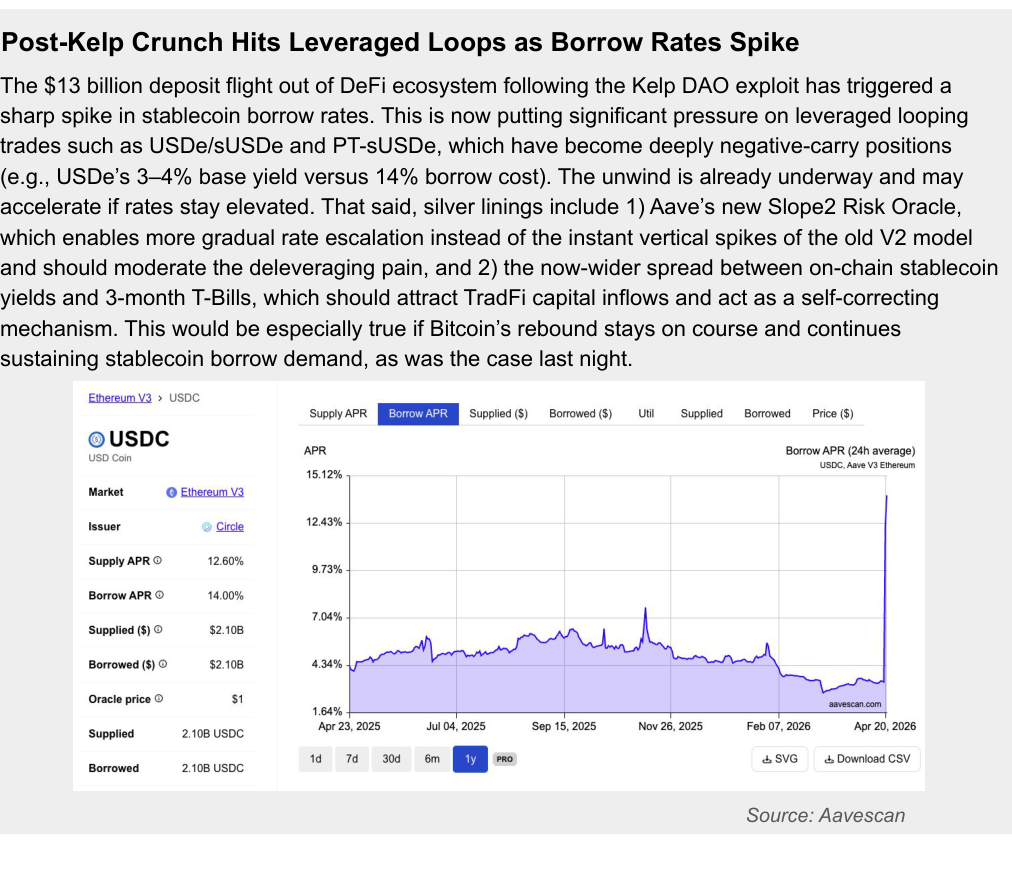
- Aave’s core markets hit 100% utilization at once: That squeeze pointed to liquidity pressure in one of DeFi’s flagship lending venues.
- Almost 80% of Japanese institutional investors say they plan to buy crypto by 2029: The survey shows how far crypto has moved into long-range institutional allocation planning.
- OCBC launches a tokenized gold fund on Ethereum and Solana: The product extends the real-world asset story beyond Treasurys and into a familiar store-of-value asset.
- Fireblocks powers a euro stablecoin for a 12-bank consortium: European banks are still building stablecoin infrastructure even as U.S. legislation remains contested.
- BitMEX taps Zodia Custody for off-exchange collateralized derivatives trading: The model continues the post-FTX shift toward segregated collateral and tighter institutional safeguards.
- Bitcoin tops $79,000 as the rally gathers steam: Price moved to its strongest level in months as the market leaned into accumulation rather than fading the breakout.
- Banks push to slow stablecoin oversight under the GENIUS Act: The fight over yield-bearing stablecoins is now central to the banking lobby’s Washington strategy.
- Ethereum’s staking ratio hits a fresh all-time high above 32%: More supply being locked helped reinforce the tighter-float argument even with ETH still below its larger resistance band.
- North Korea is tied to $578 million in crypto hacks this month: The figure shows how quickly state-linked theft can distort market confidence in a strong tape.
- Bitcoin’s Coinbase premium posts its longest bullish streak since October’s record high: The streak points to steady U.S. spot demand rather than a move driven only by offshore leverage.
- HIVE raises $115 million to push deeper into AI data centers: The financing is another sign that miners still see AI compute as a second act, not just a side business.
Bitcoin Market Analysis
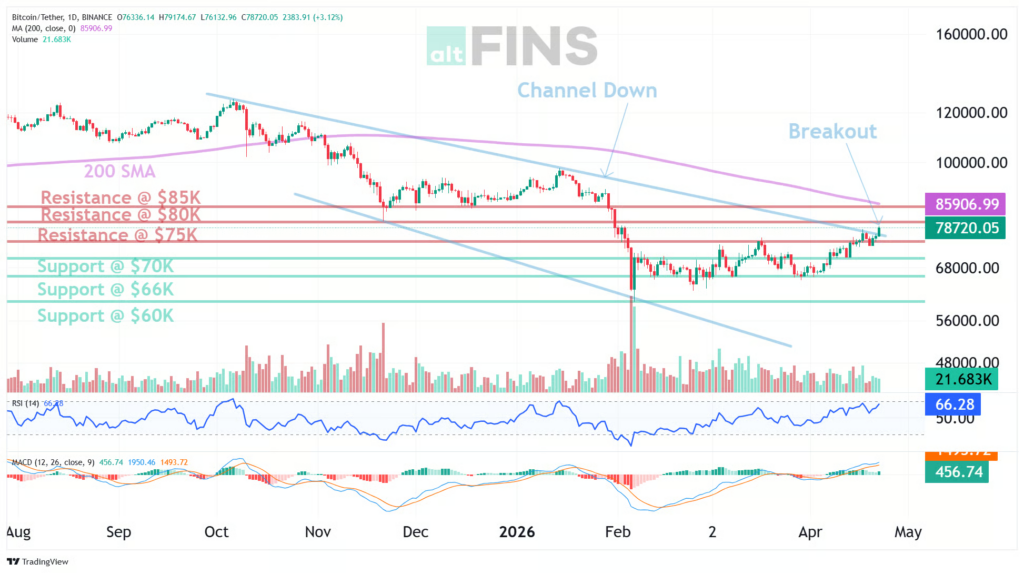
Bitcoin enters the end of the week looking more like a breakout than a bounce. Price closed near $78,200, about 4.8% above last week’s level, and printed a move to roughly $79,485 while holding above the $75,000 line that had capped the market through much of April. That matters because the week no longer reads like recovery from a washout. It reads like a market trying to normalize higher after forcing shorts out of the way.
Source: https://altfins.com/technical-analysis
The indicator set supports that shift, though it does not remove risk. Short-term trend strength sits at 8 of 10 and the medium-term trend has turned up as well. MACD remains bullish, momentum is still positive, and RSI around 66 is firm without yet reading as exhausted. Bollinger Bands from roughly $67,751 to $79,317 place current price near the upper edge of the range, while ATR near $2,592 says daily swings are still large enough to punish late entries.
The map is cleaner than it was a week ago. Support sits first at $70,000 and then $66,000. Resistance is $80,000, followed by $85,000. The important change is that $75,000 has already been reclaimed, so the next test is not whether Bitcoin can escape the old channel down pattern. It already has. The test now is whether price can hold above the breakout zone and force acceptance through $80,000 rather than slipping back into the old range.
Source: https://sosovalue.com/assets/etf/us-btc-spot
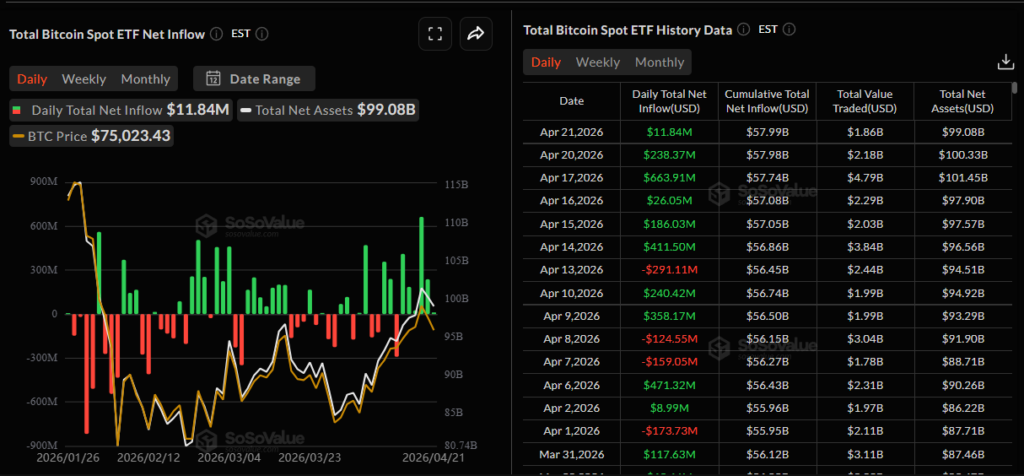
ETF flows have been supportive at the right time. The latest figures showed spot Bitcoin ETFs taking in $186.0 million on April 16, $26.1 million on April 17, $238.4 million on April 21, and $11.8 million on April 22, with total net assets rising to about $99.1 billion. That is not the kind of one-day burst that fades as soon as headlines cool. It reads more like a steady institutional bid showing up behind the price move instead of chasing it after the fact.
The week’s biggest Bitcoin narrative came from Strategy overtaking IBIT after another $2.54 billion purchase. That does two things at once. It keeps the treasury-company playbook alive, and it tells the market that the highest-conviction buyer is still acting as if the bear-market lows were inventory windows, not warnings. That story sat neatly beside the Coinbase premium streak, which suggests U.S. spot demand has stayed active through the move.
The other side of the tape is easier to miss because price is stronger now. Banks lobbying against CLARITY and banks pushing to slow the GENIUS Act are reminders that policy friction has not gone away. If Bitcoin clears $80,000 and starts pressing $85,000, that resistance will likely come from positioning and macro, not from a lack of buyers. But if Washington turns more hostile again, the market has already shown it can still react fast.
Ethereum Market Analysis
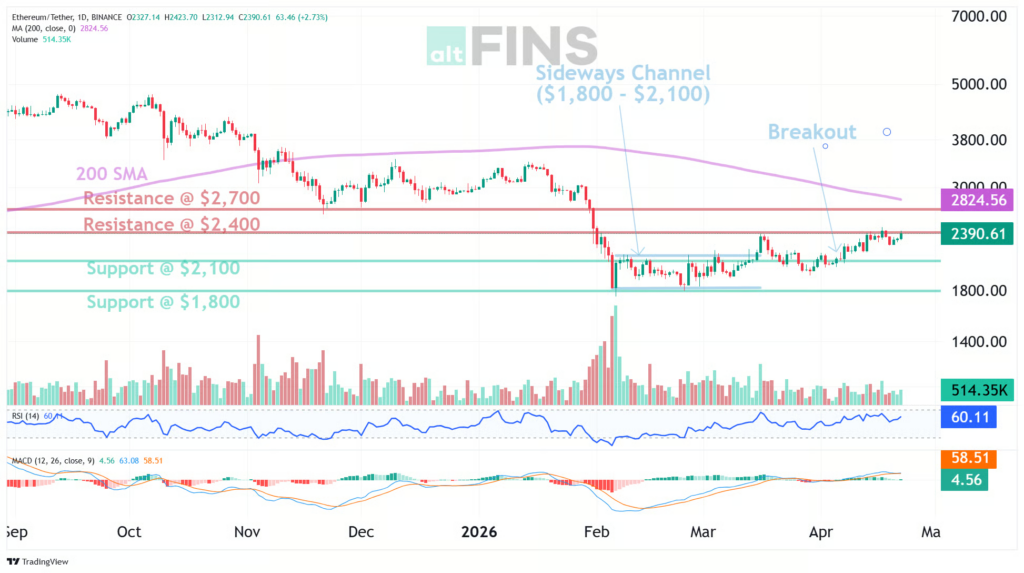
Ethereum’s week was quieter than Bitcoin’s, but the setup may be more delicate. Price held near $2,374, up about 0.5% on the week and roughly 15.5% on the month, after already reclaiming the $2,100 zone earlier in the move. That leaves ETH sitting just under the first real ceiling that matters. Bitcoin has already pushed through its near-term breakout line. Ethereum is still proving it can do the same at $2,400.
Source: https://altfins.com/technical-analysis
That makes the structure straightforward. Support remains $2,100, then $1,800. Resistance is $2,400 first and $2,700 after that. The upper Bollinger Band near $2,471 lines up closely with the first resistance, which helps explain why the advance has slowed here. If $2,400 breaks cleanly, the next leg can widen quickly. If it rejects again, the market likely goes back to checking whether buyers still defend $2,100 with the same confidence they showed on the first reclaim.
The indicators are constructive, but less forceful than Bitcoin’s. Short-term and medium-term trend scores both sit at 8 of 10. MACD is bullish, RSI around 59 is neutral-to-firm, and momentum remains positive, but the short-term averages are doing more work than the long-term ones. ETH is still below its 50, 100, and 200-day longer trend references, which is why this still feels like a reversal attempt inside a larger damaged chart rather than a fully repaired structure.
Source: https://sosovalue.com/assets/etf/us-eth-spot
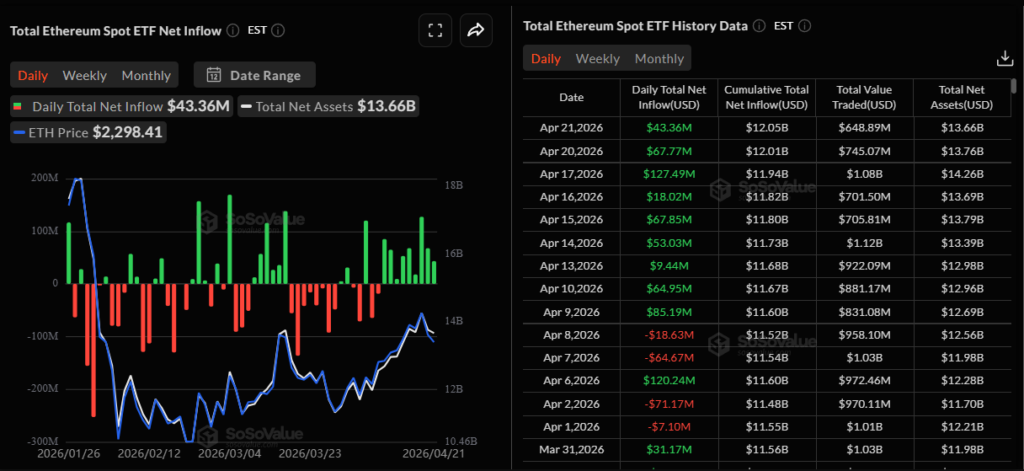
Flows have been better than the price action suggests. It showed spot Ether ETFs taking in $67.8 million on April 16, $18.0 million on April 17, $67.8 million on April 21, and $43.4 million on April 22, with total net assets around $13.7 billion. That is a healthy sequence for an asset still stuck below overhead resistance. It implies allocation interest is building before the breakout is confirmed, not after.
The most durable ETH-specific story this week was not a headline trade. It was staking reaching a fresh high above 32% of supply. That matters because tighter liquid supply changes how quickly price can move once demand firms up. It also fits with the larger institutional-tokenization push, including OCBC’s tokenized gold fund on Ethereum and Solana, which keeps Ethereum close to the center of the real-world asset buildout even when Bitcoin dominates the price conversation.
Ethereum still had the week’s ugliest reminder that adoption does not cancel risk. The Kelp DAO exploit and the report on North Korean workers across crypto projects pushed security back into the foreground. That does not erase the bullish case around tighter supply and rising ETF inflows. It just means ETH is still trading with two competing truths at once: the monetary structure is improving, but the application layer keeps proving how easy it is to break trust.
Kelp DAO and the New Trust Problem
The Kelp DAO exploit was the week’s cleanest reminder that DeFi still struggles to hold trust at the exact moment it wants larger pools of capital to arrive. The headline figure, roughly $293 million, was large enough on its own. What made it worse was the sequence after the breach. Funds were already being routed across chains while the market was still deciding whether the event was isolated protocol damage or the start of another broader confidence hit. That pace matters because it compresses the time available for issuers, bridges, and governance actors to respond.
Source: https://assets.ctfassets.net/m1hizt3hapq0/18oHx3fznli7WAMCF2jl6g/ac4b98cc56a1223a6c7d94e34daf3487/Daily_Market_Brief_260421.pdf
The exploit also landed in a market that had started to feel more constructive. Bitcoin was pressing $80,000, Ether was holding above $2,300, and ETF flows were improving. A story like that should have been enough to keep risk appetite focused higher. Instead, the Kelp event cut through it because security failures still rank above almost every other narrative when real capital is at stake. Millions being laundered and Arbitrum freezing $71 million in linked ether showed both sides of the same problem: crypto has become fast enough to move value globally, but its response systems are still fragmented across issuers, chains, and governance structures.
That is why this story matters beyond one protocol. If the next wave of institutional allocation is meant to move on-chain, the standard is no longer whether a protocol can work in normal conditions. It is whether it can fail without the whole market learning about it in real time through stolen funds moving wallet to wallet. This week did not kill the DeFi adoption case. It did narrow the list of excuses the sector can still use for why security and operational response remain below the level that the next class of capital will demand.
Stablecoins Move Further Into Real Payments
Stablecoins had one of their strongest weeks of quiet progress in months. The market focused on Bitcoin’s breakout and the Kelp exploit, but the steadier story was that on-chain dollars kept moving into real operational use. Stablecoin supply reaching $320 billion matters because that base is no longer being built only by traders rotating collateral between exchanges. It is increasingly being built by issuers, payout platforms, and financial institutions that want a faster settlement rail.
Source: https://assets.ctfassets.net/m1hizt3hapq0/18oHx3fznli7WAMCF2jl6g/ac4b98cc56a1223a6c7d94e34daf3487/Daily_Market_Brief_260421.pdf
DoorDash moving payouts onto Stripe-backed Tempo infrastructure was the clearest sign of that shift this week. That is not a crypto-native use case searching for relevance. It is a mainstream company using stablecoins because payout rails are becoming a product decision rather than a token thesis. The same pattern showed up in Fireblocks supporting a euro stablecoin for a 12-bank consortium and in tokenized deposit and fund-settlement projects that kept advancing in parallel.
This is why the fight over stablecoin yield and stablecoin oversight has become so aggressive. The argument in Washington is no longer about whether stablecoins exist. That has been settled by usage. The fight is about who gets to own the customer relationship when money moves instantly, settles globally, and starts to look less like a deposit product and more like an internet-native payment layer. That is the deeper reason this story belongs in the report. Stablecoins are no longer just adjacent to the real economy. They are starting to plug directly into it.
Mark Your Calendars
Economic Data Releases:
- April 30, 2026 (Thursday): GDP (Advance Estimate), 1st Quarter 2026
- May 8, 2026 (Friday): Employment Situation for April 2026
Token Unlock
- May 2, 2026 (Saturday): ENA (ENA) unlocks about US$30.7 M
- May 3, 2026 (Sunday): SUI (SUI) unlocks about US$59.4 M