Hormuz Blockade, Tame Inflation, and a $76,000 Bitcoin
16th April 2026 • 7 mins read
This Week’s Recap
- Bitcoin surges past $76,000 after a $650 million short squeeze as US producer prices come in below consensus: Producer price inflation rose 4.0% year over year against a 4.7% forecast, triggering a wave of short liquidations that drove Bitcoin to its highest level in four weeks.
- Strategy acquires 13,927 Bitcoin for $1 billion, total holdings now 780,897 BTC: Funded through STRC preferred stock sales, which hit a record $1.1 billion in daily trading volume as the market priced in continued accumulation.
- Goldman Sachs files for a Bitcoin Premium Income ETF: The fund uses covered call options on holdings with at least 80% bitcoin-linked exposure to generate monthly distributions for advisers looking for income from Bitcoin volatility.
- Deutsche Boerse takes a $200 million stake in Kraken: The German exchange operator now holds a 1.5% fully diluted stake, the first major European institution to take direct equity in a US crypto exchange.
- Morgan Stanley’s MSBT spot Bitcoin ETF debuts with $30.6 million in net inflows: The bank-issued spot product purchased 430 BTC on its first day, adding direct fee competition to BlackRock’s IBIT.
- SEC admits its crypto enforcement strategy went too far, dismisses seven cases: A 2025 review concluded that prior enforcement pursued media headlines over measurable investor harm.
- Japan classifies crypto as financial products: New legislation imposes penalties up to 10 years in prison for operating without registration.
- Hong Kong grants first stablecoin licenses to HSBC and a Standard Chartered-led group: Anchorpoint is structured as a joint venture between Standard Chartered, Animoca Brands, and HKT.
- Bitcoin drops as US-Iran negotiations fail to reach an agreement: Crypto fell between 1.5% and 2% following 21 hours of failed talks in Islamabad.
- Oil futures spike 7% on Hyperliquid as Trump orders naval blockade of Strait of Hormuz: US crude pushed back above $105 per barrel, adding immediate pressure to risk assets.
- CLARITY Act faces a two-week Senate deadline before midterm cycle begins: The digital asset market structure bill is stuck over whether stablecoin issuers can pass yields to users, and industry leaders warn that failure now means no progress until 2030.
- Pakistan lifts seven-year crypto ban, allowing banks to service virtual asset providers: The central bank notified all financial firms they may provide services to licensed crypto providers, ending a restriction in place since 2018.
- Anthropic’s Mythos AI model can find smart contract flaws at machine speed: Security experts warned the model identifies vulnerabilities in core infrastructure that humans have missed for decades, with more than 99% of discovered flaws currently unpatched.
- Bitcoin proposal BIP-361 would freeze 5.6 million BTC vulnerable to quantum computing: Researchers proposed locking coins in addresses with exposed public keys, sparking debate over ownership rights versus network security.
- Coinbase custodies 84% of US spot Bitcoin ETF assets, roughly $74 billion: Concentration in a single custodian raises questions about systemic risk as the ETF asset base grows.
- World Liberty Financial loses $700 million in market cap amid Justin Sun feud: The Trump-backed protocol’s token hit an all-time low of $0.077 after a $75 million borrowing position on Dolomite trapped retail deposits and allegations of hidden freeze functions emerged.
- Bittensor sheds $900 million in market value after top AI developer exits: TAO fell 27% following the departure of Covenant AI amid allegations of centralised control over the network’s incentive structure.
- SpaceX holds $603 million in bitcoin in Coinbase Prime custody: The company maintains 8,285 BTC despite a $5 billion loss elsewhere tied to xAI.
- Bitmine reports a $3.8 billion Q1 loss as ETH holdings reach 4.87 million tokens: Mark-to-market accounting drove the loss even as annualised staking revenue reached $212 million.
- Crypto ETPs record $1.1 billion in weekly inflows, the strongest since January: US spot Bitcoin ETFs led the week, marking the first seven-day period above $1 billion since early in the year.
- Bhutan has sold 70% of its bitcoin in 18 months: Tracked holdings dropped from 13,000 BTC in October 2024 to 3,954 BTC, with the kingdom also slowing its mining operations.
- Commodity traders turn to stablecoins as Iran-related debanking disrupts settlement: Traders are using stablecoins for cross-border settlement as banks pull back from trade finance in the conflict zone.
- Private credit exit wave reaches $20 billion as major funds cap withdrawals: Barings Private Credit Corp. capped redemptions after investors sought to reclaim 11.3% of shares, raising concerns about a secondary drag on risk asset liquidity.
- Zcash outperforms Bitcoin by 46% as privacy coins decouple during the Iran conflict: An institutional access thesis and a Grayscale Trust conversion path are behind the move.
- Fed chair nominee Kevin Warsh discloses personal holdings in crypto and DeFi protocols: Warsh revealed stakes in Ethereum scaling networks and DeFi protocols ahead of his Senate confirmation hearing.
- Fake Ledger app on Apple App Store drains $9.5 million from more than 50 victims: The phishing campaign ran for about a week before removal, targeting wallets across Bitcoin, Tron, and Solana.
- FBI reports record $11.4 billion in crypto fraud losses for 2025: Seniors aged 60 and older accounted for $4.4 billion of the total, underscoring that consumer protection failures continue to scale.
- Rakuten allows XRP to be used as a payment method by its 44 million customers: Users can spot trade XRP and exchange reward points for the token via the Rakuten Pay app.
- Visa and Stripe join Tempo blockchain for machine-to-machine payments: Visa built and manages a validator node in-house after six months of development, positioning the integration for autonomous payment flows.
- US GDP growth revised down to 0.5% as the economy nearly stalls: Fourth quarter 2025 growth slowed sharply from the 4.4% pace in Q3, while inflation stayed too elevated for the Fed to offer easy relief.
Bitcoin Market Analysis
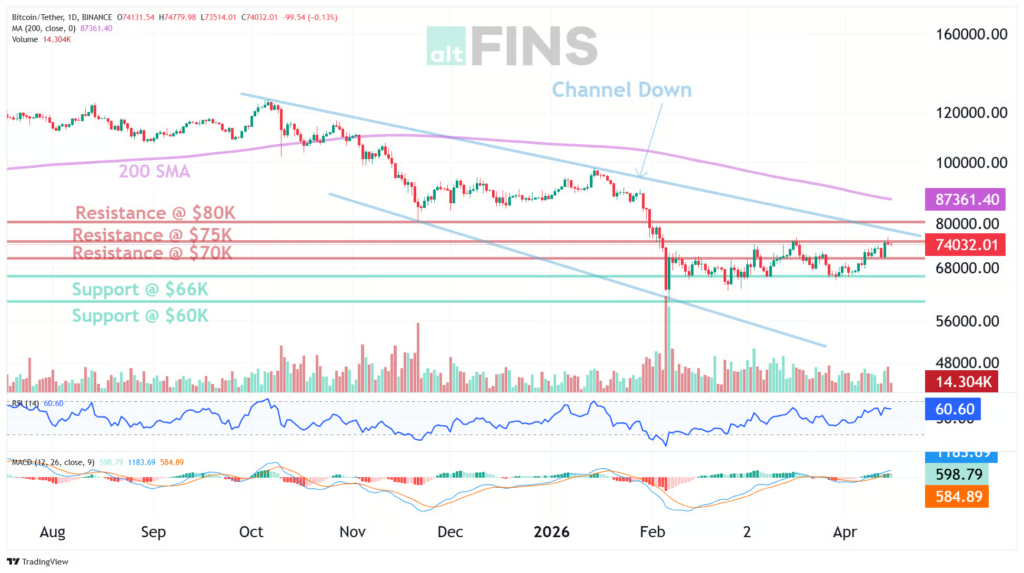
Bitcoin finished near $74,636, up about 5% on the week, after trading a range that only tells half the story. Price dropped below $71,000 early in the period as US-Iran peace talks collapsed in Pakistan and a Hormuz naval blockade was ordered, pushing oil past $105 and triggering defensive positioning across risk assets. The reversal came when US producer prices printed 4.0% year over year against a 4.7% consensus. That 70-basis-point gap between feared and actual inflation triggered a $650 million short squeeze that sent Bitcoin past $76,000 for the first time in four weeks. The strongest intraday impulse landed on the PPI session, and Tuesday’s close was the highest daily close since mid-March.
Source: https://altfins.com/technical-analysis
Short-term momentum has clearly turned. The trend reads 8 of 10, MACD crossed above its signal line 27 days ago and held a positive reading of 1,360 through the rally, and shorter-term oscillators including Stochastic RSI and Williams %R pushed into overbought territory — expected given how fast the recovery moved. RSI on the 14-period sits near 62, neutral enough for continuation. ATR at 2,526 reflects daily swings that remain elevated, and Bollinger Band width from $64,363 to $76,053 puts current price right against the upper boundary. The medium-term trend is neutral; the long-term trend is still strongly down at 2 of 10.
The $66,000 to $75,000 range has defined Bitcoin’s world for weeks. This week, price made its first serious run at the ceiling. Support at $66,000 lines up with the lower Channel Down boundary and has been tested twice without breaking. Below that, $60,000 is the structural floor, sitting almost exactly on the 52-week low of $60,006. On the upside, $75,000 is where the upper Bollinger Band, Channel Down resistance, and round-number psychology converge. A breakout needs sustained daily closes above $75,000 to stick; rejection reopens the path to $66,000. The setup is binary, and this week leaned toward the break.
Source: https://sosovalue.com/assets/etf/us-btc-spot
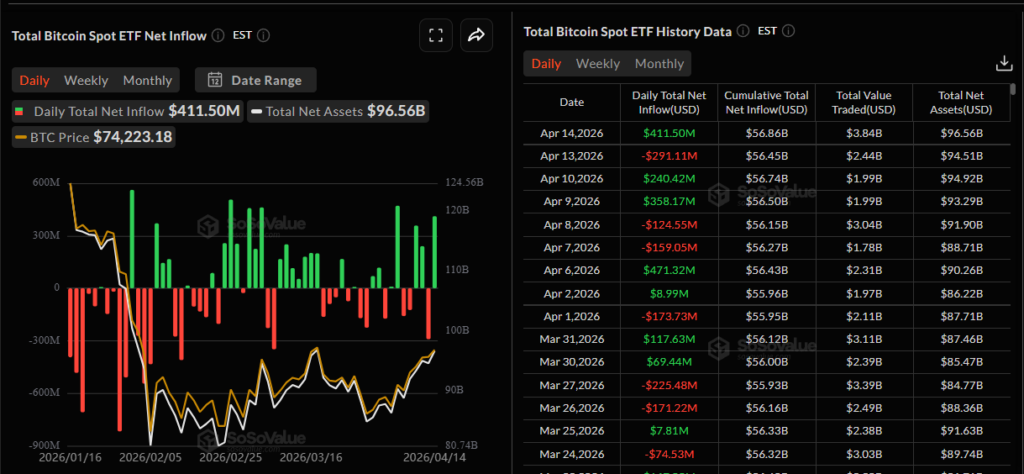
Spot Bitcoin ETF flows ended net positive at about $595 million across five trading sessions, with net assets climbing from $91.9 billion to $96.6 billion — the highest since mid-March. The flow pattern tracked the news cycle almost hour by hour: a $125 million outflow on Wednesday as Hormuz headlines hit, $358 million of inflows on Thursday after CPI undershot, $240 million on Friday, a $291 million outflow on Monday as the blockade began, then $411 million on Tuesday after PPI cemented the relief trade. Cumulative net inflows reached $56.9 billion. The speed of the reversals stood out — the same capital that pulled on Monday came back on Tuesday.
The institutional pipeline widened through the volatility. Goldman Sachs filed for a Bitcoin Premium Income ETF built to sell covered calls on bitcoin-linked holdings for monthly yield, a product that packages Bitcoin’s volatility into something a traditional adviser can put in a model portfolio without raw directional risk. Deutsche Boerse took a $200 million stake in Kraken, the first major European exchange operator to buy direct equity in a US crypto exchange. Morgan Stanley’s MSBT debuted with $30.6 million in first-day inflows and 430 BTC purchased, adding a second bank-branded spot product alongside BlackRock’s IBIT. Three of the five largest global investment banks now have active or filed Bitcoin product lines.
Strategy purchased 13,927 BTC for $1 billion, funded through STRC preferred stock that hit a record $1.1 billion in daily trading volume — the financing vehicle is now a story in its own right. Total holdings reached 780,897 BTC. At the other end of the conviction spectrum, Bhutan continued selling, reducing tracked holdings from 13,000 to roughly 3,954 BTC over 18 months, while the US government was reported as holding about 328,000 BTC. A different kind of risk surfaced when Coinbase was flagged as custodying 84% of US spot Bitcoin ETF assets, roughly $74 billion sitting with a single provider.
Ethereum Market Analysis
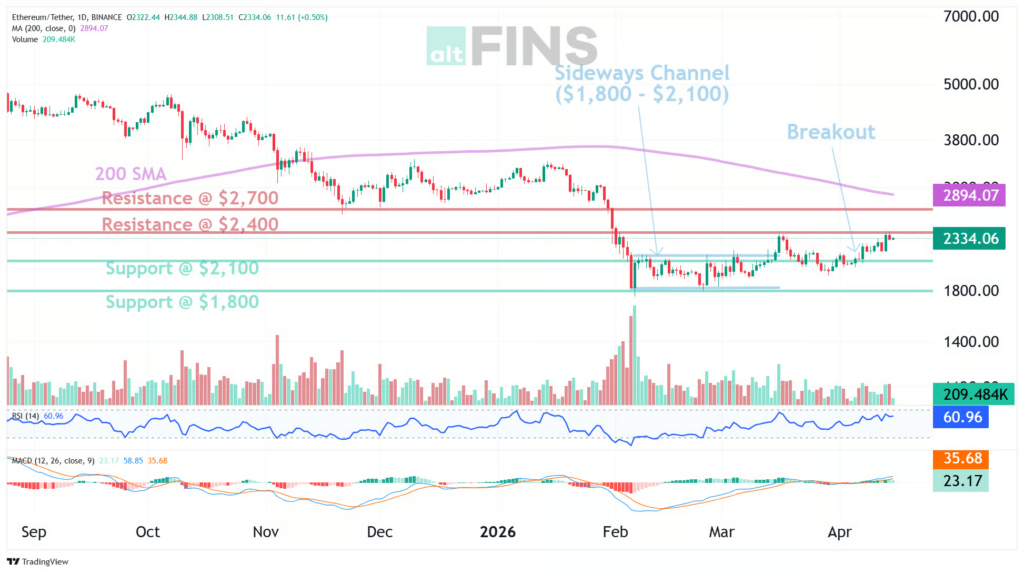
Ethereum was the better trade this week. A 7.5% gain to $2,354 outpaced Bitcoin, and the ETH/BTC ratio climbed to a 10-week high, the first sustained stretch of ETH outperformance since early February. The move above $2,100 mattered because that level had acted as a ceiling for weeks after breaking as support in late February. Reclaiming it and pressing toward $2,400 without giving back the floor turned sideways action into a recognisable recovery. The weekly high was $2,386; the low was $2,309. The gain came in daily increments across the full week.
Source: https://altfins.com/technical-analysis
The decision point is $2,400. That level lines up with the upper Bollinger Band at $2,404 and has been overhead resistance since March. A break opens roughly 15% of upside to $2,700. Rejection sends price back to $2,100 for a retest. Below $2,100, the next floor is $1,800, where heavy buying showed up during the February washout. The 52-week low at $1,385 sits more than 70% below current price, but the all-time high of $4,957 is still 52% overhead — ETH remains closer to its low than its high, stuck in the middle of a wide range with the direction still unresolved.
Momentum indicators are bullish but not emphatic. MACD crossed above its signal line 27 days ago and holds a reading of 65.4 — positive, but thin compared to prior rallies. The short-term trend is up at 8 of 10; the long-term trend sits at 2 of 10. Stochastic RSI and CCI are overbought, which fits the speed of the move. ADX reads 19, typical of a market exiting a range rather than trending hard. ATR at 110 keeps daily swings wide relative to price. The short-term picture is improving. The medium and long-term pictures have not changed.
Source: https://sosovalue.com/assets/etf/us-eth-spot
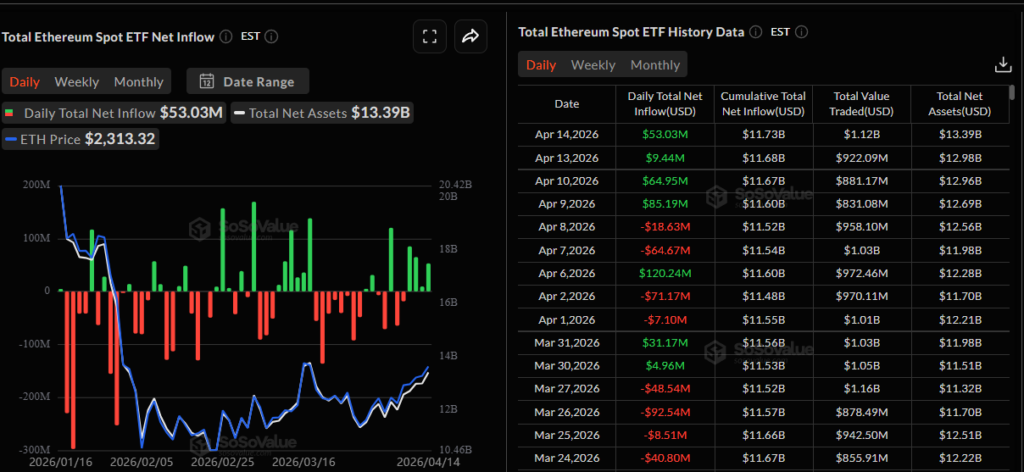
Spot Ethereum ETF flows were net positive at roughly $194 million, with net assets climbing from $12.6 billion to $13.4 billion. The strongest session was $85 million on Thursday after CPI data lifted risk appetite, and the most recent print showed $53 million. Cumulative net inflows reached $11.7 billion. The flow improvement ran alongside the price recovery, suggesting fresh allocation rather than recaptured outflows — but whether that holds over a longer window is still an open question.
Bitmine pushed its ETH holdings to 4.87 million tokens, roughly 4% of total supply, with $212 million in annualised staking revenue and a public framing of Ether as “the wartime store of value.” That label only works if staking income stays durable and price holds above the loss tolerance embedded in Bitmine’s $3.8 billion Q1 loss under mark-to-market accounting. The $1.6 billion Ether Machine SPAC collapsed over unfavorable conditions, a direct read on capital market appetite for ETH-treasury vehicles even while the underlying asset recovers.
The ETH/BTC ratio’s climb to a 10-week high coincided with 284,000 new Ethereum users in Q1 and stablecoin supply on the network reaching a record $180 billion. The Ethereum Foundation unveiled a $1 million audit subsidy to cut smart contract costs for builders, but also converted 5,000 ETH to stablecoins for operating expenses — a sale that undercuts the “less selling” narrative built around its staking work. A sharper question came from outside the ecosystem: Anthropic’s Mythos model was reported as able to find smart contract vulnerabilities at machine speed, with more than 99% of discovered flaws still unpatched. If that capability scales, it rewrites the economics of both auditing and exploitation.
War, Oil, and the Stablecoin Settlement Shift
The Hormuz blockade did more than move oil prices. It broke payment rails. Sanctions and bank de-risking tied to the Iran conflict have cut the correspondent banking chains that commodity traders rely on for cross-border settlement, and traders are turning to stablecoins because the alternative is waiting days for a wire that may not clear at all.
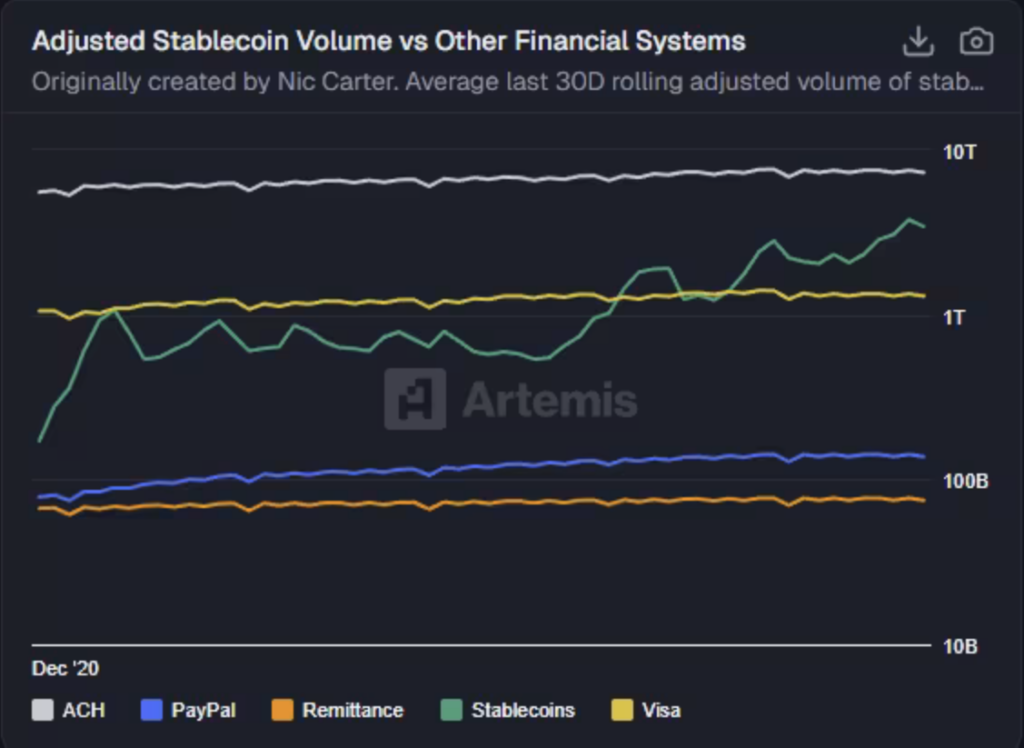
Source: https://app.artemis.xyz/stablecoins
The logic is practical. A trader with $40 million of diesel on the water needs a payment rail that works at 2 AM on a Saturday when the bank has suspended the credit line. Stablecoins settle in minutes, skip the correspondent chain, and do not close for holidays. Stablecoin volumes are projected to reach $719 trillion by 2035, and the war is pulling forward adoption that was already technically ready but lacked urgency. Iran’s reported plan to charge tankers a Bitcoin toll for Strait passage takes it further, embedding cryptocurrency directly into the mechanics of global shipping.
Whether that proposal sticks is beside the point. The week showed that crypto’s role in commodity settlement has moved from conference panel to cargo hold, driven by the fact that traditional rails broke under pressure when traders needed them most.
Mark Your Calendars
Economic Data Releases:
- April 21, 2026 (Tuesday): Advance Monthly Retail Sales (March 2026)
- April 24, 2026 (Friday): Advance Durable Goods Orders (March 2026)
Token Unlock
- April 16, 2026 (Thursday): ARB (ARB) unlocks US$10.64 M
- April 20, 2026 (Monday): ZRO (ZRO) unlocks US$50.39 M
- April 22, 2026 (Wednesday): UDS (UDS) unlocks US$37.31 M
- April 25, 2026 (Saturday): H (H) unlocks US$11.42 M