Inflation Shock Meets Onchain Finance
14th May 2026 • 8 mins read
This Week’s Recap
- Bitcoin loses $80,000 after April PPI hits 6%: Producer inflation accelerated from 4.3% to 6%, and BTC slipped back under the level traders had been trying to turn into support.
- Senate confirms Kevin Warsh to the Federal Reserve board: Warsh now sits in position for the post-Powell handoff, giving crypto markets a policy figure they already see as more open to market-structure change.
- CLARITY Act final draft released before May 14 markup: Passive stablecoin yield is barred, activity-based rewards survive, and the banking lobby still has plenty to argue about.
- US senators file more than 100 amendments to the crypto bill: The amendment pile shows how far the bill has moved and how little consensus there is on the final shape.
- JPMorgan files tokenized money market fund on Ethereum: JLTXX targets a stable $1.00 NAV backed by US Treasuries, a direct fit for stablecoin issuers that need reserve assets.
- Circle raises $222 million for Arc: Arc was valued at $3 billion on a fully diluted basis, with BlackRock and Apollo tied to the institutional network’s backing.
- Tokenized Treasuries reach $15 billion: Treasury tokenization kept growing while Bitcoin stalled, a useful contrast between asset price stress and infrastructure demand.
- Bitcoin long-term conviction buyers reach 4 million BTC: Record long-term holdings gave bulls a supply argument even as ETF flows turned negative.
- Charles Schwab starts US spot crypto rollout: A first group of retail clients can now trade bitcoin and ether through Schwab Crypto, extending last week’s brokerage-access push.
- Metaplanet posts operating progress but Bitcoin losses hit earnings: BTC markdowns drove a $728 million loss, another reminder that treasury accumulation can look very different in the income statement.
- Exodus sells 1,000 Bitcoin to fund payments acquisitions: Exodus lifted cash and stablecoin holdings to $74.4 million by turning part of its BTC stack into acquisition fuel.
- CleanSpark reports a $378.3 million quarterly loss: Lower Bitcoin prices and mining pressure hit the quarter, and the stock fell 9%.
- Jane Street adds Ether ETF exposure while cutting Bitcoin funds: Jane Street added at least $82 million in Ether ETF exposure while cutting Bitcoin funds.
- Spot XRP ETFs draw the largest daily inflow since January: XRP funds took in $25.8 million in one day, the largest single-day inflow since January.
- XRP tops bitcoin and ether volumes on major South Korean exchanges: XRP/KRW led trading on Upbit, putting local retail activity back into the XRP story.
- Ethereum Foundation unveils Clear Signing standard: Wallet approvals are getting a readability push after years of phishing losses tied to unclear signing prompts.
- Ethereum Glamsterdam upgrade moves toward Q3 2026: Protocol leads were named and a new gas-limit floor was finalized for the upgrade path.
- NUVA connects Figure’s $19 billion of tokenized assets to Ethereum: Home-equity credit lines and Treasuries are being routed toward Ethereum DeFi markets.
- Fidelity International launches Moody’s-rated tokenized fund on Chainlink: Sygnum infrastructure and JPMorgan pricing data sit underneath the new Moody’s-rated fund.
- DTCC integrates Chainlink for tokenized collateral platform: DTCC is building toward 24/7 automated collateral management before a planned Q4 rollout.
- Kraken and Franklin Templeton partner on onchain products: Tokenized yield and institutional market products are the first targets.
- Privacy blockchains top $1 billion in total funding: Arc, Canton, and Tempo pushed privacy infrastructure past the $1 billion funding mark.
- Elliptic raises $120 million for AI-powered monitoring: Nasdaq and Deutsche Bank backed the round as compliance firms race to use AI against crypto crime.
- North Korea-linked hackers stole $2.06 billion in 2025: CertiK described state-linked theft as industrialized, keeping security risk in the same conversation as adoption.
- Binance says AI security blocked $10.53 billion in fraud: Binance said its newer controls blacklisted 36,000 malicious addresses.
- Telecom giant KDDI buys 14.9% of Coincheck Group: KDDI’s $65 million stake comes with customer referrals and revenue-sharing plans in Japan.
- Ledger pauses US IPO plans: The wallet maker stepped back after exploring a possible $4 billion listing.
- UK parliament to probe Nigel Farage’s $6.8 million crypto-linked donation: Investigators are reviewing an undeclared gift from Christopher Harborne.
- Vietnam targets Q3 launch for regulated crypto market: The finance ministry is preparing a formal market framework for the third quarter.
- Hyperliquid ETF records $1.2 million in debut inflows: The 21Shares product opened with modest demand, but the wrapper keeps moving beyond the largest assets.
Bitcoin Market Analysis
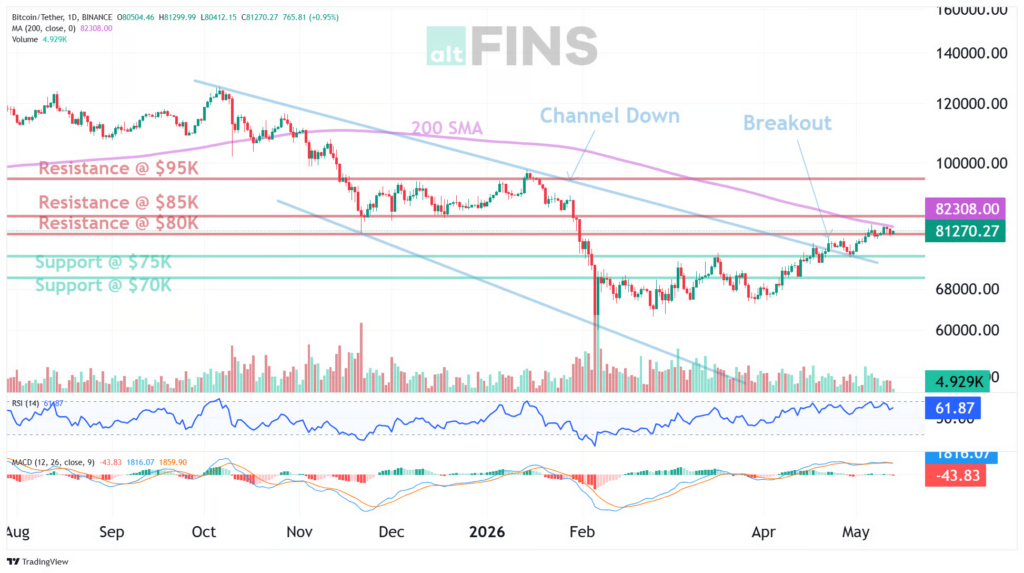
Bitcoin came into the week trying to turn $80,000 from a headline into a base. The PPI print spoiled that attempt. Price was shown near $79,595 in the latest technical snapshot, after trading between roughly $78,748 and $81,316 on the day. The one-week move was down about 2.2%, but the one-month move was still up 7.0%, which is why the selloff reads as a failed confirmation rather than a completed breakdown. The market lost the clean breakout. It did not lose the recovery.
Source: https://altfins.com/technical-analysis
The chart still looks better than it did during the winter drawdown, but the recovery has rough edges. Short-term and medium-term trends were both marked Up, while the long-term trend stayed Neutral. MACD was bearish, the 100-day and 200-day moving average trends were still down, and the 200 SMA sat near the minor resistance area around $83,000. That leaves BTC with enough momentum to keep buyers engaged, but not enough to make the low $80,000s easy. Every push into that zone still runs into old overhead supply.
$75,000 is now the line that keeps the recovery intact. It was the first listed support level, with $70,000 below it, while $80,000 and $85,000 remained the next resistance zones. The $83,000 area matters because it sits between the reclaim and the official target, close to the 200 SMA. A daily close back above $80,000 would put that $83,000 to $85,000 stretch back in play. Another failure there would shift the week from breakout pause to a retest of the prior channel-down breakout.
Source: https://sosovalue.com/assets/etf/us-btc-spot
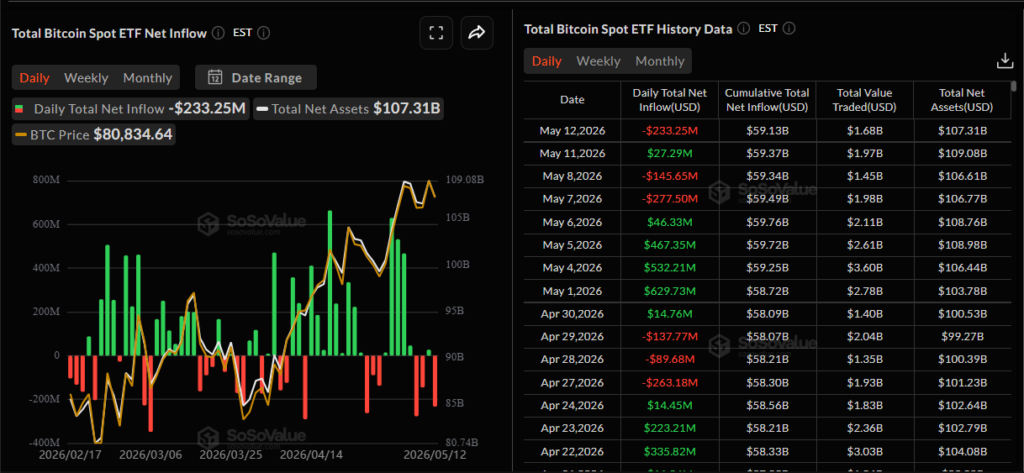
ETF demand matched the hesitation in price. The SoSoValue table showed about $233 million of net outflows, roughly $1.7 billion of value traded, total net assets near $107.3 billion, and cumulative net inflow around $59.1 billion. Earlier inflow days keep the latest outflow from becoming a full demand reversal, but the timing matters. Bitcoin needed ETF support to validate the $80,000 reclaim. Instead, the flow table gave traders another reason to wait.
Supply told a firmer story than flows. Long-term conviction buyers now hold a record 4 million BTC, tightening available supply even as ETF demand cooled. Access also kept widening as Charles Schwab began rolling out spot crypto trading, following Morgan Stanley’s E*Trade move last week. That is the quieter support under the market: coins are being locked away, and the brokerage doors keep opening. Price still has to prove itself at $80,000, but the distribution rails are not waiting for perfect conditions.
Corporate Bitcoin looked more complicated. Metaplanet’s Bitcoin revaluation loss, Exodus selling 1,000 BTC, and CleanSpark’s $378.3 million quarter all landed while BTC was losing the round number. Treasury accumulation still matters, but earnings season is making the trade look less effortless. The recovery can survive while $75,000 holds. It becomes a stronger report only when $80,000 stops rejecting buyers.
Ethereum Market Analysis
Ethereum’s strongest weekly stories were not in the candle chart. JPMorgan filed a tokenized money market fund on Ethereum, and NUVA is connecting Figure’s $19 billion of tokenized assets to Ethereum. Those are reserve, fund, and collateral stories, the kind that give Ethereum a role in financial workflows even when ETH itself is not leading the market. The network had a better week than the asset.
Source: https://altfins.com/technical-analysis
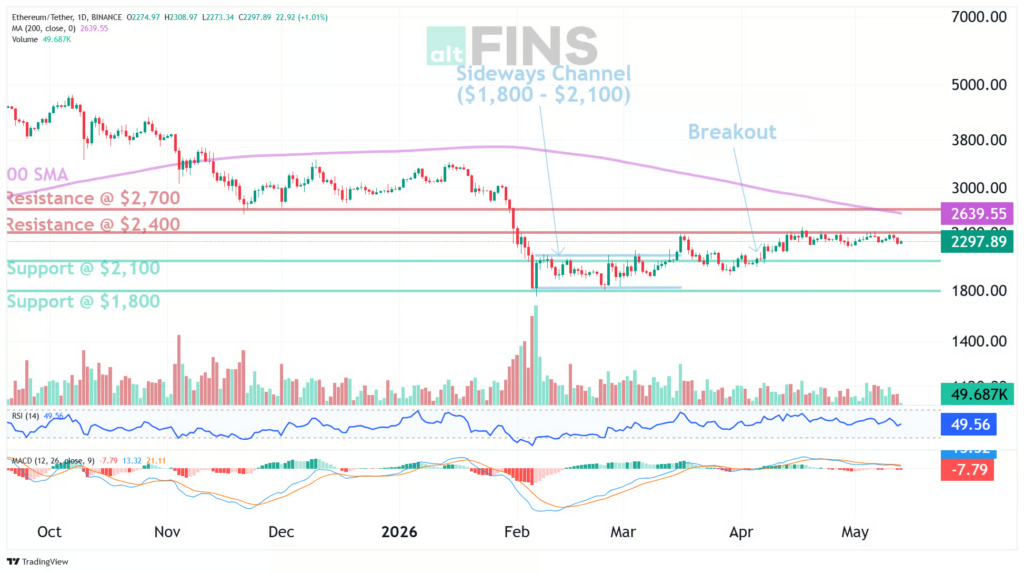
Price told the colder version. ETH was near $2,267 in the technical snapshot, down about 3.6% over one week and 4.4% over one month. The daily range ran from about $2,234 to $2,324, and price sat close to the lower Bollinger Band near $2,238 rather than pressing the upper band near $2,384. ETH had already reached the $2,400 resistance area during the prior recovery. This week showed that reaching a level and owning it are different things.
The indicator set backed up that loss of momentum. Short-term trend was Down, medium-term trend was Neutral, and long-term trend was Neutral. RSI stayed neutral, but Stochastic, Stochastic RSI, CCI, and Williams readings leaned oversold, while MACD and momentum were bearish. That leaves ETH stretched enough for a bounce but too weak to call the pullback complete. The chart is no longer falling apart, but it is not driving the week either.
Source: https://sosovalue.com/assets/etf/us-eth-spot
$2,100 is the number that keeps ETH’s rebound alive. The next support sits at $1,800, while resistance remains $2,400 and then $2,700. A move back toward $2,100 can still be part of a constructive reset if buyers defend it, especially after last week’s push above that zone changed the tone from repair to recovery. A close above $2,400 would reopen the $2,700 target. A loss of $2,100 would put ETH back below the level that made the rebound credible.
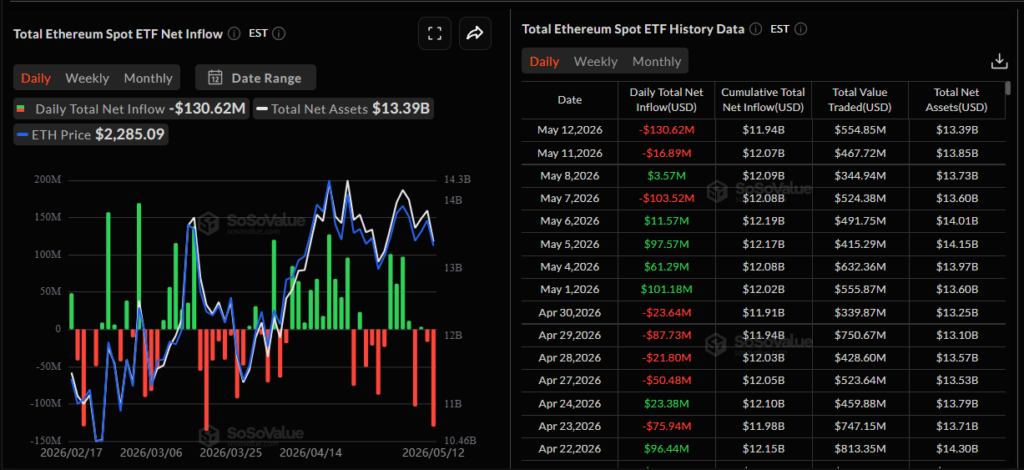
ETF flows made that support test more important. The latest spot ETH ETF snapshot showed about $131 million of net outflows, roughly $555 million traded, total net assets near $13.4 billion, and cumulative net inflow around $11.9 billion. Last week, improving ETF demand helped ETH look like it was building a sturdier recovery. This week, that support disappeared while Bitcoin was also losing the $80,000 handle. ETH had less room to carry its own story.
The protocol response was practical. The Ethereum Foundation’s Clear Signing standard goes at malicious approvals, one of Ethereum’s most familiar user-level failure points, while Glamsterdam’s Q3 roadmap gives the upgrade track a clearer shape. ETH still needs buyers at $2,100 before the price section improves. The long-term case is being rebuilt through safer signing, tokenized assets, and institutional reserve products.
Stablecoin Rules Hit the Fine Print
The Washington stablecoin debate got specific this week. The CLARITY Act draft moved into the May 14 markup with passive yield barred and activity-based rewards still alive. That sounds narrow, but it is the part banks care about. A dollar token that rewards user activity starts to look like a deposit rival once it leaves the crypto app and reaches payments, payroll, or merchant settlement. Crypto firms want that flexibility because rewards are often how new rails build habit before they build trust.
JPMorgan’s Ethereum money-market filing made the fight less theoretical. The proposed fund points straight at stablecoin reserve management, where tokenized Treasuries can sit behind digital dollars and still operate inside a regulated wrapper. Circle’s Arc raise put a $3 billion value on the same direction of travel, while tokenized Treasuries reaching $15 billion showed that institutions are already testing faster settlement and collateral movement before the law is finished.
The markup is really deciding where the bank perimeter ends once dollars start moving onchain. If the rules are too tight, stablecoin payment products lose the incentives that help them compete. If they are loose, banks have to defend deposits against software that settles faster and runs all day. BTC and ETH traded the inflation shock this week. The quieter fight was over who gets to own the next dollar rail.
Mark Your Calendars
Economic Data Releases:
- May 20, 2026 (Wednesday): FOMC meeting minutes
Token Unlock
- May 15, 2026 (Friday): STRK unlocks about 127 million tokens, roughly $6.4 million
- May 16, 2026 (Saturday): ARB unlocks about 92.7 million tokens, roughly $13.4 million
- May 17, 2026 (Sunday): AVAX unlocks about 1.7 million tokens, roughly $17.3 million
- May 18, 2026 (Monday): FTN unlocks about 20 million tokens, roughly $87.4 million