Bitcoin Rebound Oil Shock: Rising Oil Prices Test Crypto Recovery
9th July 2026 • 7 mins read
This Week’s Recap
- Crypto and stocks tumble after Trump declares ceasefire over following Iran strikes: Bitcoin fell toward $62,000 after the ceasefire collapse pushed oil higher and pulled risk assets lower. The pressure came from energy, not crypto plumbing: higher crude can feed inflation, keep the Fed cautious, and make the July rebound harder to extend.
- US payroll growth slows sharply in June: Employers added only 57,000 jobs in June, roughly half the expected pace. That weak print gave Bitcoin its first real opening because slower hiring reduced fear of another rate hike and put rate cuts back into the conversation.
- Bitcoin jumps above $63,000, reversing end-June losses: BTC moved above $63,000 in thin July 4 trading and briefly erased the late-June slide. The bounce showed buyers were willing to step in once rate pressure eased, but $65,000 remained the first level where relief would need to turn into follow-through.
- US spot Bitcoin ETFs end a 10-day outflow streak: The funds took in $221.7 million on July 2, ending a painful selling run. Fresh SoSoValue data then showed another $265.7 million entering on July 6 and $21.4 million on July 7, so the ETF channel stopped dragging on price just as BTC tried to hold above $60,000.
- Bitcoin whales bought 270,000 BTC in two weeks even as ETFs bled a record $4 billion: Large holders reportedly bought about $16.7 billion of BTC during the drawdown while ETFs were still losing money. That split gives the week a cleaner read: public funds were under pressure, but deep-pocketed buyers were absorbing supply below the surface.
- Strategy faces $8.3 billion Bitcoin Q2 loss as Saylor sells over $200 million in BTC: Strategy sold 3,588 BTC for about $216 million to fund preferred stock distributions. The sale changed the usual Strategy story because the largest public-company holder used Bitcoin as a cash source, which makes its funding structure part of the market risk.
- JPMorgan says Strategy’s Bitcoin sales policy adds two-way risk to crypto markets: JPMorgan argued that Strategy should raise cash through equity rather than Bitcoin sales. The concern is practical: if investors begin treating Strategy as both a buyer and a possible seller, its disclosures can move sentiment in both directions.
- Metaplanet buys another $170 million of Bitcoin, expanding holdings to 43,000 BTC: Metaplanet bought 2,823 BTC and lifted its holdings to 43,000 BTC, worth about $2.58 billion in the supplied coverage. The purchase kept the Japanese corporate-buyer theme alive and gave the market a clear contrast with Strategy’s sale.
- K Wave Media sold every BTC as debt and Nasdaq pressure closed in: K Wave Media exited a $64.2 million Bitcoin position to meet debt obligations and fund a GPU infrastructure pivot. The story is a warning for smaller public-company Bitcoin buyers: when debt, listing pressure, and AI spending collide, BTC can become the easiest asset to sell.
- Bitcoin miners are using up to 12% of BTC reserves as collateral rather than selling coins: CleanSpark reported 1,719 BTC held as collateral or receivables tied to derivative transactions. That helps miners avoid direct sales, but it still turns BTC reserves into working capital and makes lower prices more painful for balance sheets.
- SBI Crypto to shut down mining pool that holds roughly 2% of Bitcoin’s hashrate: SBI Crypto is closing a mining pool with roughly 2% of Bitcoin’s hashrate. The network can absorb that size, but the shutdown adds to the miner-reset theme as operators reassess whether mining, AI hosting, or power sales offer the better return.
- TeraWulf soars on a $19 billion AI data-center lease with Anthropic: TeraWulf signed a 20-year AI hosting deal with Anthropic, and the stock reaction showed where equity investors see value. Power capacity is being priced as AI infrastructure first and Bitcoin mining second, which raises the bar for miners that stay pure-play.
- SpaceX IPO powers record $3.86 billion in tokenised equities trading in June: SpaceX-linked tokens captured 31% of monthly tokenised equity volume after the company’s reported $75 billion IPO. The number shows tokenised shares can pull real attention when they give investors access to a name they already want.
- Securitize tokenises $295 million of its own stock on Solana and Avalanche: Securitize tokenised $295 million of its own shares around its NYSE debut. Issuer-led tokenisation is stronger than a platform-created synthetic product because the claim, reporting, and shareholder relationship are closer to the company itself.
- Dinari and tZERO join forces on turnkey platform for tokenized US equities: Dinari and tZERO are building a platform for blockchain-based stock trading. The partnership matters because tokenised equities need distribution, broker connectivity, and settlement discipline before record volume can become routine usage.
- Edel protocol hit by $403,000 exploit tied to tokenised Google stock collateral: Edel lost about $403,000 after an attacker manipulated the exchange rate behind tokenised Google stock collateral. The underlying stock did not need to move, which is the risk investors often miss: tokenised assets can break at the pricing and collateral layer.
- US SEC to propose crypto rule as soon as this month to ease startup fundraising: The SEC placed a Reg Crypto proposal on its near-term agenda. If the rule gives startups a clearer path to raise money in the US, it could pull more projects back onshore and reduce the incentive to launch through legal workarounds.
- Vanguard opens search for digital assets leader: Vanguard is hiring a digital-assets leader to oversee tokenisation and stablecoin work. For a $12 trillion manager that has historically kept crypto at arm’s length, a dedicated role suggests the question has moved from whether to study the market to how to respond to clients and competitors.
- Kraken is trying to become a bank in Europe: Kraken is seeking a European banking license through Lithuania. A bank-like footprint would help the exchange control deposits, payments, and euro access at a time when regulators are pushing crypto firms toward more formal operating models.
- Coinbase secures UK authorization to offer traditional investments alongside crypto: Coinbase gained UK approval to offer traditional investments alongside crypto. The move points to a broader exchange strategy: become the account where users trade stocks, crypto, and related products instead of staying inside a narrow coin-trading box.
- Ripple secures full MiCA license in Luxembourg: Ripple’s Luxembourg approval lets it offer regulated crypto services across the European Economic Area. That gives Ripple a cleaner route into 30 markets just as Europe is forcing platforms to sort compliant assets from products that no longer fit the rules.
- Revolut to delist USDT in August: Revolut told customers remaining USDT balances would be converted after August 31. The decision shows MiCA’s gatekeeper effect in practice, with large platforms willing to disrupt users rather than carry stablecoin products that create regulatory risk.
- US Treasury sanctions over 100 ISIS-K crypto addresses: US officials sanctioned addresses tied to more than $1.4 million of alleged ISIS-K activity across Tron, Monero, and Bitcoin. The action reinforced how stablecoin freezing, address screening, and chain surveillance now sit inside national-security enforcement.
- France records 77 crypto kidnapping and extortion cases: French authorities reported 77 crypto-related kidnapping and extortion cases this year, with about 200 arrests. The threat is moving beyond wallet hygiene; public wealth signals, leaked personal data, and travel patterns are now part of crypto risk management.
- BONK faces $20 million treasury drain after attacker spends $4 million to pass malicious proposal: An attacker reportedly spent $4 million to acquire enough voting power to pass a proposal that diverted $20 million. The attack exposed a governance weakness: a token vote can be economically rational for an attacker if the treasury prize is large enough.
- Summer.fi halts Lazy Summer vaults after $6 million exploit: Summer.fi paused its Lazy Summer vaults after a $6 million drain and SUMR fell 18%. The hit shows why automated yield products are still judged on incident response, not just advertised returns.
- Ethereum developers embrace Vitalik Buterin’s long-term vision but urge quicker execution: Developers backed the Lean Ethereum direction while pushing for faster delivery. The roadmap targets 1 gigagas per second on the base layer and post-quantum security, but investors will judge whether the upgrade path can move faster than rival chains and app demand.
- Bitmine announces $74 million Ether treasury buy: Bitmine added $74 million of ETH while several Bitcoin-linked firms were selling coins, pledging reserves, or chasing AI infrastructure. The buy gave ETH a rare company-balance-sheet support story and tied it to hopes that the Crypto Clarity Act could make ETH holdings easier to justify.
- Base crosses $2 billion in total value locked: Base crossed $2 billion in value locked as layer-2 competition intensified. For Ethereum, the milestone cuts both ways: it shows activity is growing around the ecosystem, while also reminding investors that value can accrue to apps and scaling networks before it reaches ETH itself.
- Pump.fun is unlocking $127 million insider tokens worth almost twice recent daily volume: Pump.fun’s July 12 unlock is worth about $127 million, or 29.23% of circulating supply. The unlock is almost twice recent daily trading volume, so even moderate selling could test how much demand is really sitting under the token.
Bitcoin Market Analysis
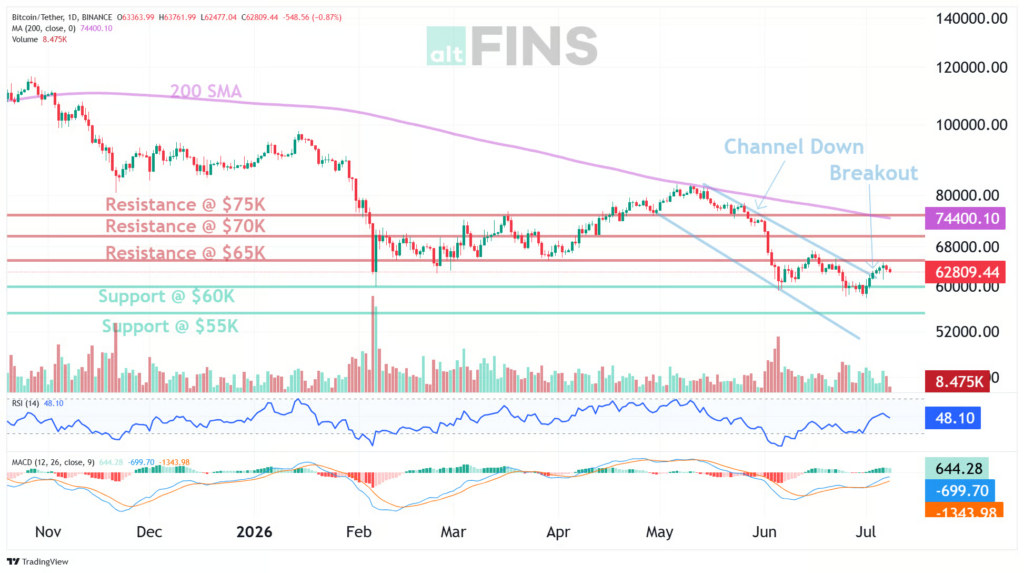
Bitcoin ended the week with a fragile bounce rather than a clean turn. Price was quoted near $62,158, down 0.22% on the day but up 3.55% over the week, after trading between $61,534 and $63,756 in the latest session. The asset reclaimed $63,000 earlier in the window after weak US payrolls changed the rate discussion, then slipped back toward $62,000 as oil rose and the Iran ceasefire story broke down. That left the market above the $60,000 support zone but below the $65,000 level that would make the rebound look sturdier.
Source: https://altfins.com/technical-analysis
The chart still carries damage from the prior decline. Short-term trend was marked down, medium-term and long-term trend were both marked strongly down, and the 20-day through 200-day moving averages remained pointed lower. Momentum looked better than trend, with MACD still above its signal line and shorter moving averages starting to rise, but the histogram was fading. RSI was neutral rather than washed out, so the market no longer had the easy “oversold bounce” excuse it had near the lows.
The level map is simple. Buyers need to defend $60,000 first, with $55,000 beneath it if that floor breaks. On the upside, $65,000 is the first resistance and $80,000 is the larger ceiling. Bollinger Bands ran from roughly $58,290 to $65,350, placing spot close to the upper side of the current band but still below the level where the bounce would become more convincing. A daily close through $65,000 would change the conversation. Losing $60,000 would reopen the June low.
Source: https://sosovalue.com/assets/etf/us-btc-spot
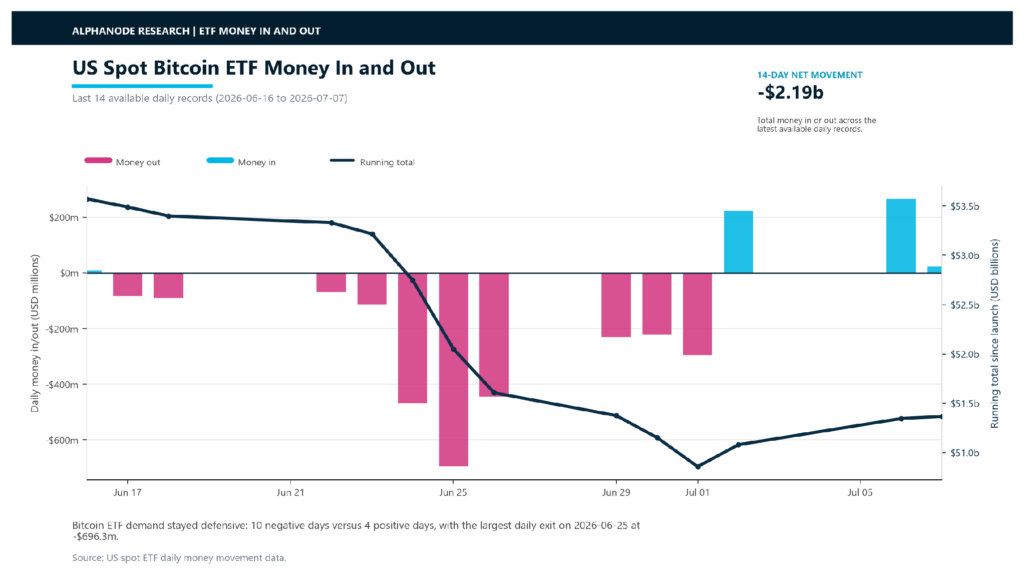
ETF data showed why the rebound still felt unsettled. Across the latest 14 available daily records, $2.19 billion left US spot Bitcoin ETFs, with 10 negative days and only four positive days. The late turn was better: $221.7 million entered on July 2, $265.7 million entered on July 6, and $21.4 million entered on July 7. Net assets finished the API window at $77.26 billion, and cumulative net money entering the funds stood at $51.37 billion. The rebound has ETF support now, but it is still repairing the damage from June.
Balance-sheet behavior was the week’s sharper Bitcoin story. Strategy sold 3,588 BTC for about $216 million to fund preferred stock distributions, and JPMorgan warned that the sale policy creates two-way risk because the largest public-company holder can become a seller when funding needs rise. Metaplanet moved the other way, adding 2,823 BTC, while K Wave Media sold its full Bitcoin position to fund AI infrastructure and meet debt pressure. The split gives the market a more complicated large-holder story than “companies keep buying.”
The best support came from buyers away from the ETF screen. Large holders reportedly bought 270,000 BTC over two weeks, roughly $16.7 billion, even as ETFs were still recovering. That explains why $60,000 held after a heavy selling run. The next test is cleaner: if oil pressure eases and $65,000 breaks, the bounce has room. If energy prices keep inflation fears alive, Bitcoin is back to defending the same floor.
Ethereum Market Analysis
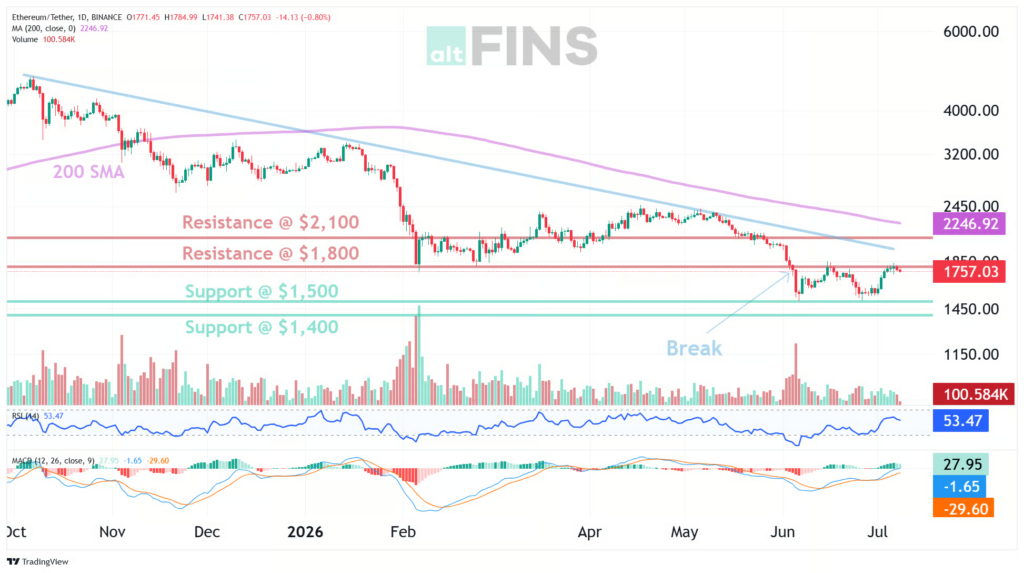
Ethereum’s week was less about panic and more about whether the rebound had enough strength to challenge $1,800. ETH traded near $1,739, up 8.06% over the week, and the latest session printed a $1,713 to $1,785 range. The price improvement was real, but the chart source still framed $1,800 as resistance and warned that the market could be rejected there. ETH is closer to its first ceiling than Bitcoin is to $65,000, so the next few sessions should answer quickly.
Source: https://altfins.com/technical-analysis
The trend setup is still uneven. Short-term trend was neutral, medium-term trend was down, and long-term trend was strongly down. Momentum was bullish but fading, with MACD above its signal line while the histogram declined. RSI readings were neutral, so the market was no longer at an extreme. Moving averages told the same mixed story: the 5-day and 10-day simple averages had turned higher, but the 20-day through 200-day measures still pointed lower.
Support sits at $1,500, then $1,400, while resistance is clustered at $1,800 and then $2,100. The Bollinger Band range ran from about $1,514 to $1,848, placing ETH near the upper side of its recent envelope. That makes $1,800 the immediate decision point. A close above it would give ETH room to test $2,100, but failure there would keep the market trapped inside a recovery that has not yet escaped the broader downtrend.
Source: https://sosovalue.com/assets/etf/us-eth-spot
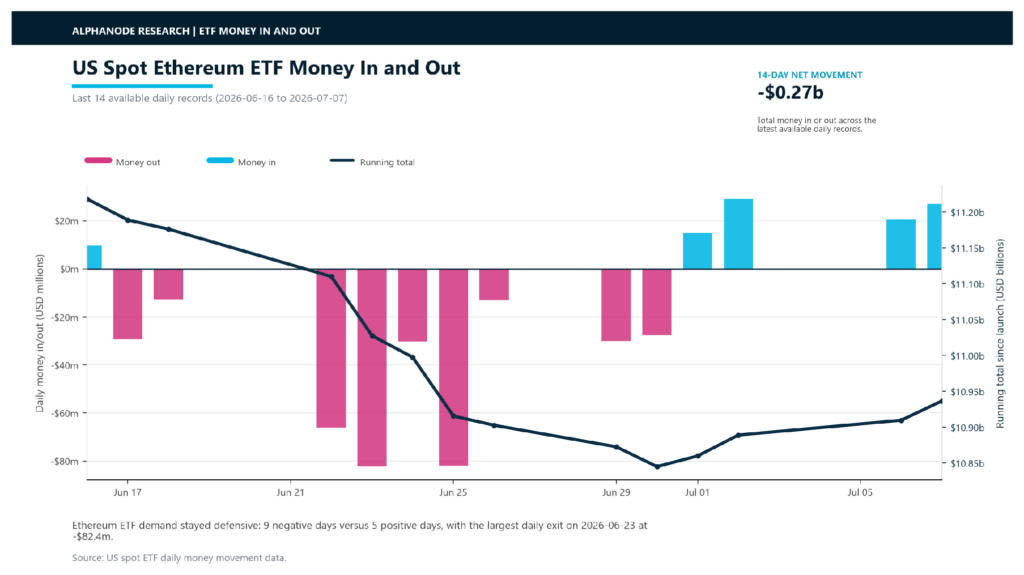
ETH ETF data was quieter than Bitcoin’s but cleaner late in the period. Across the latest 14 available records, $272 million left the funds, with five positive days and nine negative days. The latest four reported sessions were positive: $14.9 million on July 1, $29.1 million on July 2, $20.7 million on July 6, and $26.9 million on July 7. Net assets finished at $9.53 billion, while cumulative net money entering the funds stood at $10.94 billion. ETH ETF demand is not strong enough to carry price by itself, but it stopped working against the market.
The Ethereum-specific news had more substance than the chart. Bitmine added $74 million of ETH, giving ETH a public-company buyer at a time when several Bitcoin-linked firms were selling, pledging coins, or moving toward AI data centers. Vitalik Buterin’s Lean Ethereum roadmap also reset the longer debate by targeting 1 gigagas per second on the base layer and post-quantum security over a three to four year plan. The promise is useful. The delivery clock matters more.
That leaves ETH with a cleaner but still conditional setup. A break above $1,800 would align the improving ETF numbers with a chart that is finally clearing resistance. Failure there would turn the week into another lower-level rebound inside a larger decline. The best part of the ETH story is that buyers returned before the chart became obvious. The weak part is that $2,100 is still a long way off.
Tokenised Equities Hit Their First Real Stress Test
Tokenised equities were one of the few areas this week where growth and risk arrived together. SpaceX-linked tokens helped drive a reported $3.86 billion of June volume, with SpaceX tokens taking 31% of the monthly total. Securitize also tokenised $295 million of its own stock on Solana and Avalanche around its NYSE debut, and Dinari joined with tZERO to build a broader platform for tokenised US equities. Those are not small pilot headlines. They are early market structure.
The weakness showed up in the mechanics. Edel’s $403,000 exploit did not require Google’s stock to move. The attacker targeted the exchange-rate logic behind tokenised Google stock collateral, which is exactly the kind of token-level failure that ordinary investors will not see until money is already at risk. Tokenised shares can make markets faster and broader, but the new failure points are not always in the asset being represented. They can sit in pricing, collateral rules, governance, bridges, or the legal claim behind the token.
That is why the week’s tokenised-equity story is more useful than a simple adoption headline. Record volume proves demand. The exploit proves the design still needs hardening. If large financial firms want tokenised stocks to become normal market plumbing, the next stage is less about announcing more assets and more about making the token structures boring enough to survive stress.
Mark Your Calendars
Economic Data Releases:
- July 14, 2026 (Tuesday): CPI and Core CPI
Token Unlock
- July 12, 2026 (Sunday): PUMP (PUMP) unlocks US$127.00 M