
Bitcoin Trades Like Gold Again
10th September 2026 • 8 mins read
This Week’s Recap
- Consensys split MetaMask into its own company: MetaMask’s 100 million users now sit under a consumer-only entity chaired by Ethereum co-founder Joe Lubin, while Linea, Besu and Teku stay with a renamed Consensys under CEO Mike Kriak. Separating the wallet from the protocol business lets MetaMask chase payments, savings and investing products without dragging institutional infrastructure along for the ride.
- Jack Dorsey’s Block applied for a federal trust bank charter: The proposed Builders Bank would offer federally supervised Bitcoin and stablecoin custody while explicitly declining to accept deposits. Sidestepping deposit-taking keeps Block outside the stricter capital rules that come with being a full bank while still giving it a regulator’s seal for custody.
- Tether pushed into private credit with a $400 million fund alongside Fasanara: The USDT issuer will supply stablecoin settlement infrastructure for asset-backed lending across more than 60 countries. Tether keeps finding new lanes for its balance sheet beyond Treasury bills, this time as the plumbing behind loans it doesn’t originate itself.
- US Bank ran a live cross-border payment on its own stablecoin: The fifth-largest US commercial bank completed a transaction using its USBDC token on the Stellar network, its clearest signal yet that the project is headed toward production rather than staying a pilot.
- Germany’s draft bill would tax Bitcoin gains like stocks at 25%: The proposal targets currently tax-free long-term crypto gains while leaving existing holdings under the old rules. Germany has been one of the more generous major economies on crypto taxation, and the draft would close that gap just as ownership broadens beyond early adopters.
- Hunter Biden’s LAPTOP memecoin crashed 99% within two hours of a $1.6 billion debut: The token hit $190.81 within two minutes of opening on Base against a liquidity pool holding roughly $48,000, then collapsed to about $2. A nine-figure valuation propped up by a five-figure liquidity pool was never going to hold, and at least 14 copycat tokens launched within the following hour anyway.
- A Singaporean ringleader pleaded guilty in a $245 million crypto fraud case: Malone Lam, 22, admitted to leading a network that stole 4,100 Bitcoin from a single victim. The plea closes one of the larger individual-victim theft cases of the cycle without a trial.
- Crypto trade groups escalated their fight against an Illinois transaction tax: Industry groups are seeking a preliminary injunction to stop a 0.2% tax on crypto transactions before its January effective date. A state-level transaction tax, even a small one, sets a precedent other states could copy if Illinois prevails.
- Robinhood’s Vlad Tenev defended stock tokens in a public fight with AMC’s CEO: Tenev argued public companies shouldn’t hold veto power over third-party securities that merely reference their shares. The dispute is really about who controls the wrapper once a stock gets tokenized, not about AMC’s shares specifically.
- PayPal launched PYUSDx, a platform for other companies to issue their own stablecoins: Built with M0 and MoonPay, the platform already has three live projects, Saturn, Concrete and Cap, and has processed more than $100 million in volume. PayPal is betting other brands want the economics of a stablecoin without building the reserve and redemption plumbing themselves.
- Bitcoin and Ethereum are racing a quantum computing deadline the US just funded with $300 million: The Commerce Department finalized CHIPS Act awards of $100 million each to Rigetti, D-Wave and Quantinuum, taking equity stakes in all three. A March research paper found Shor’s algorithm could threaten wallet cryptography with as few as 10,000 to 26,000 qubits, and Ethereum has set December 2029 as its own deadline to reach quantum resistance.
- Grayscale’s Zcash ETF crossed $500 million in assets two weeks after launch: ZCSH holds more than 550,000 ZEC after debuting August 25 on NYSE Arca, though roughly $100 million of the total came from a single DCG International Investments allocation rather than independent demand. Zcash itself crossed $1,000 for the first time since October 2016 in the same stretch.
- Solana pulled in $348 million of 30-day real-world-asset inflows: Tokenized RWA value on the network reached $720 million, still a fraction of Ethereum’s tokenization footprint but evidence Solana is capturing a share of the trade.
- The XRPL Lending Amendment moved closer to its 80% validator threshold: Support for the XLS-66d proposal reached 71.4% among active validators, edging toward the supermajority the network needs to activate on-ledger lending.
- India’s financial intelligence unit flagged 15 crypto platforms for AML lapses: FIU-IND issued non-compliance notices to virtual digital asset service providers operating in the country, part of a broader tightening of onboarding and reporting standards for exchanges serving Indian users.
Bitcoin Market Analysis
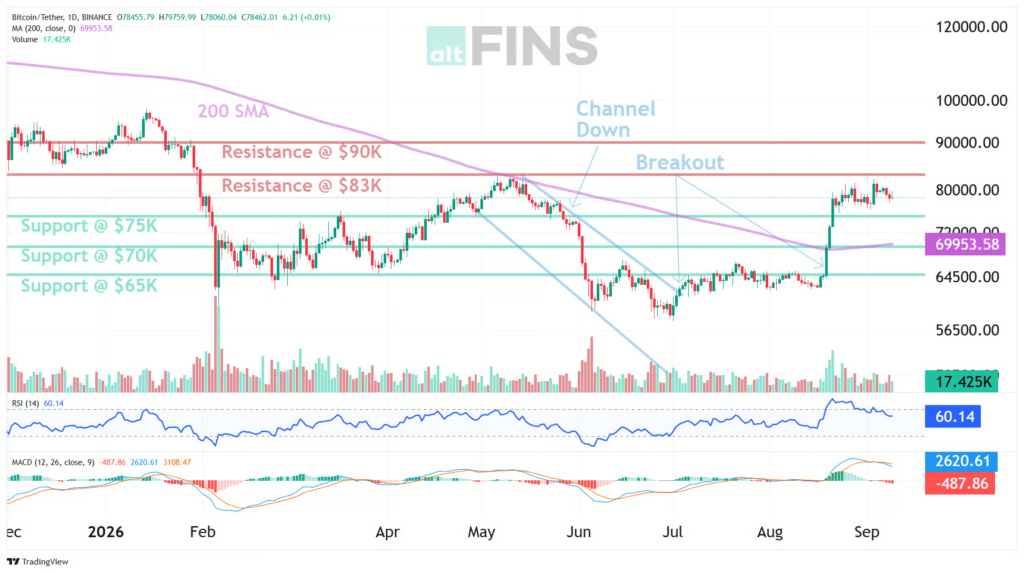
Bitcoin opened the week at $81,270 on Friday and closed Thursday’s still-forming session at $78,180, a 3.80% decline across the seven days. Friday itself set the tone with a 1.98% drop, and the weekend brought a partial reprieve: Saturday added 0.21%, Sunday another 0.64%. Monday erased both moves at once, down 1.53% to $79,112. Tuesday’s session dipped to a $77,620 low, the week’s floor, before rebounding intraday to $79,485 and closing down 0.83% at $78,456. Wednesday pushed as high as $79,760, the sharpest bounce of the week, but gave it back to close down 0.19% at $78,306. The $81,428 high from Friday’s open and Tuesday’s $77,620 low bracket a $3,808 range, about 4.7% of where the week started.
Source: https://altfins.com/technical-analysis
The shorter moving averages have all flipped below spot: price sits 0.89% under the five-day average, 1.03% under the ten-day, and 0.65% under the twenty-day, confirming the short-term downtrend. Zoom out and the picture flips entirely. Bitcoin remains 4.71% above its 30-day average, 10.94% above the 50-day, and 11.68% above the 200-day at $70,006, the kind of gap that turns a 3.80% weekly pullback into a pause rather than a reversal. AltFins still frames the broader structure as an uptrend confirmed by the earlier break above $70,000 and the 200-day average, with resistance marked at $83,000 and the $65,000 to $70,000 zone as the level buyers would likely defend on a deeper pullback.
Momentum readings split by timeframe the same way trend does. RSI-14 sits at 42.5, below the neutral 50 line and consistent with the week’s give-back, while the longer RSI-25 at 72.1 still reflects August’s rally. MACD has turned bearish on the crossover, with the line at 2,391 against a 2,963 signal and a histogram of negative 572, the first clean negative print since the breakout. ATR-14 of $2,169 is about 2.8% of spot, so this week’s full range covered less than two ATRs, an ordinary pullback by the market’s own volatility measure rather than a breakdown. Bollinger Bands have narrowed to $76,513 and $80,876, and Wednesday’s failed push to $79,760 stalled well inside the upper band rather than testing it.
Source: https://sosovalue.com/assets/etf/us-btc-spot
The pullback looks different depending on how far back the chart goes. Bitcoin is still 38.08% below its $126,217.71 all-time high from October 6, 2025, 339 days ago, even after three straight months of gains. It also sits 35.22% above its 52-week low of $57,793.56, so a $78,180 close is closer to the middle of the past year’s range than either extreme suggests at first glance. That context matters for reading the week’s 3.80% decline: a pullback that looks sharp against August’s highs is minor against the range Bitcoin has actually traded since last October.
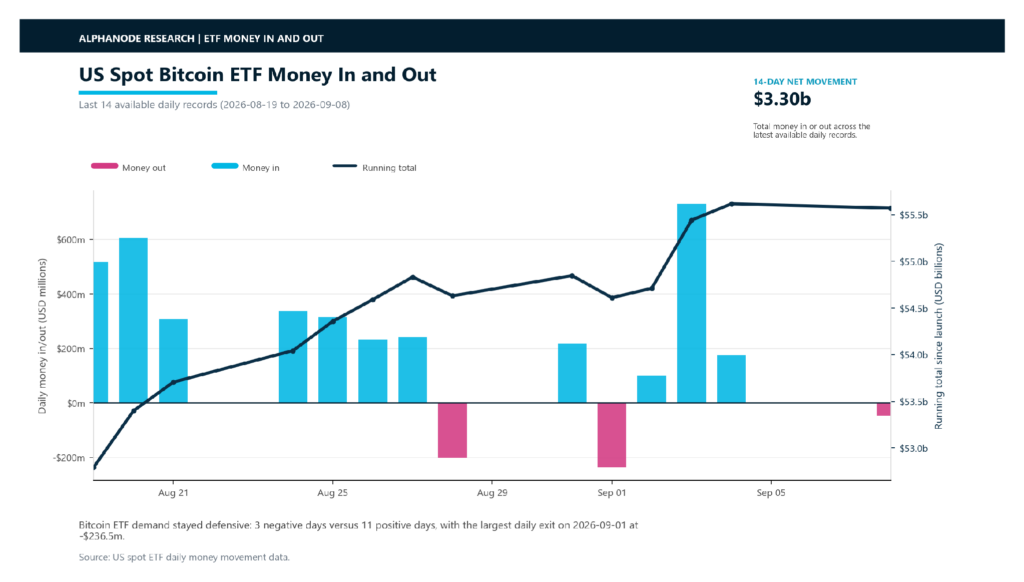
US spot Bitcoin ETFs kept buying through most of the stretch. The 14-session window from August 19 to September 8 produced 11 positive days against 3 negative ones for a net $3.30 billion, with net assets closing at $99.52 billion and cumulative inflows since launch reaching $55.57 billion. The negative days landed at scattered points rather than in a cluster: a $201.8 million exit on August 28, the largest single outflow of $236.5 million on September 1, and September 8’s smaller $46.6 million exit that closed out the window. Between those three, positive days as large as $730.9 million on September 3 kept the period comfortably net positive even as spot gave back ground into the close.
Bitcoin’s own chart says one thing this week; its behavior next to other assets says another. Brent crude broke $100 a barrel after US strikes on Iranian oil tankers and Iranian counterstrikes on American bases in Jordan, and Bitcoin rose to a $79,700 intraday high while equities sold off, the reverse of a nearly identical episode on September 2. Its rolling correlation with gold reached 0.56 in the process, the cleanest evidence yet that some allocators are treating Bitcoin as ballast rather than a leveraged tech trade. The Treasury tripled its long-bond buyback to $6 billion on September 9, and the 10-year yield still pushed to 4.85% anyway, its highest since 2023. Producer prices land September 10, consumer prices September 11, and the Fed’s rate decision follows September 16. A close that holds the $77,620 low and the reclaimed 30-day average near $74,662 keeps the medium-term uptrend intact; a break below $74,662 would put the 20-day average back in play and shift the tone from a pause to a genuine test of the rally.
Ethereum Market Analysis
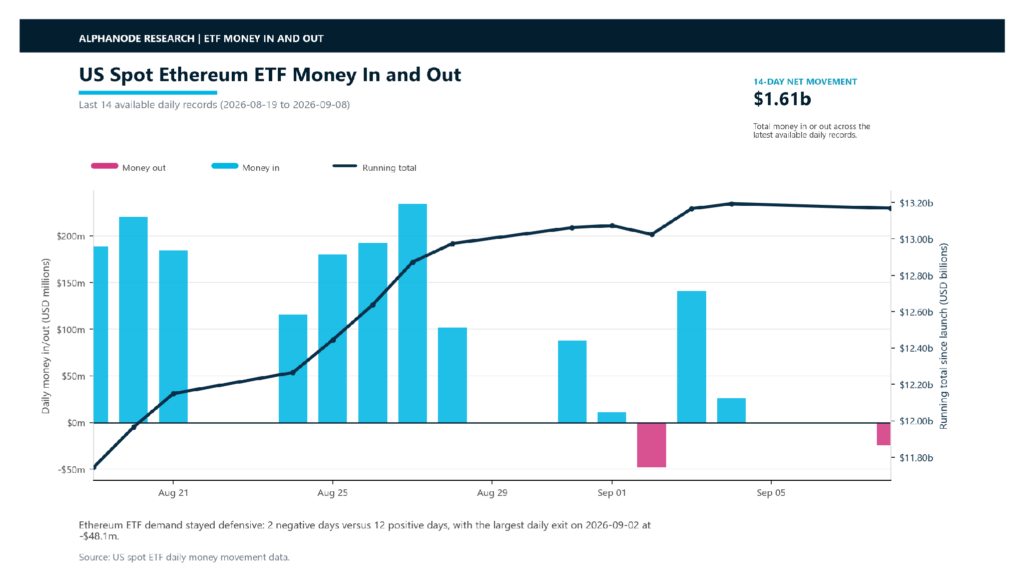
Ether’s ETFs had the calmer week. US spot funds posted 12 positive days against 2 negative ones across the 14-session window from August 19 to September 8, adding $1.61 billion in net inflows and pushing net assets to $15.72 billion. Cumulative inflows since launch now stand at $13.17 billion. The only two red days, a $48.1 million exit on September 2 and a $24.3 million exit on September 8, were both modest next to the $234.5 million and $192.4 million days from the week before, so the streak’s occasional pauses did little to change its shape.
Source: https://altfins.com/technical-analysis
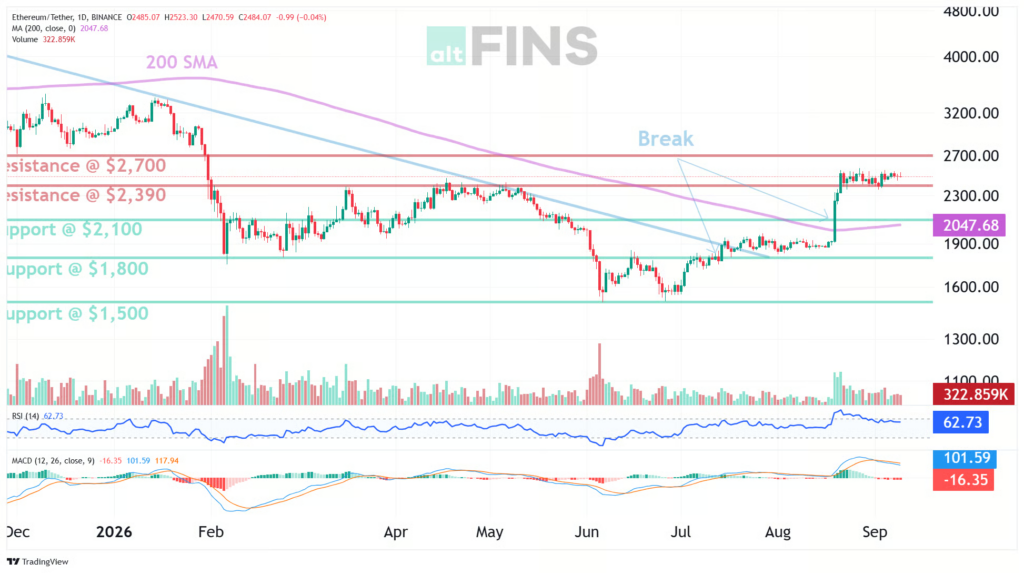
Price told a rockier story. Ether opened at $2,508 on Friday and dropped 2.06% that same day to $2,456, the week’s sharpest single move. The weekend brought two straight up days, 1.00% Saturday and 1.38% Sunday, lifting price back to $2,514, before Monday gave back 0.97% and Tuesday and Wednesday each shed a further 0.20% and 0.68%. Thursday’s still-forming session sat at $2,466, down 1.67% for the week and a shade off the $2,432 low set on Tuesday.
Ether’s short-term averages sit much closer to spot than Bitcoin’s do. Price is just 0.77% under the five-day average, 0.09% under the ten-day, and is actually 0.04% above the twenty-day average at $2,465, a tighter grouping than Bitcoin’s spread. The longer averages still carry the bulk of the story: Ether trades 14.70% above its 50-day average, 26.97% above the 100-day, and 20.26% above the 200-day at $2,050. AltFins reads the setup as a confirmed bullish reversal since Ether cleared its descending trendline and the 200-day average, with $2,400 marked as the nearest resistance and the $2,000 to $2,100 zone as the level worth watching on any deeper retracement.
Source: https://sosovalue.com/assets/etf/us-eth-spot
Momentum has more room to cool here than Bitcoin’s does. RSI-14 sits at 45.7, and the longer RSI-25 at 70.7 still shows August’s rally, a similar split to Bitcoin’s but from a base that never got as stretched. MACD flipped negative on the crossover, with a histogram of negative 19.25 against a 93.63 line and 112.87 signal. ATR-14 of $85.20 works out to roughly 3.5% of spot, and the week’s full $115 range covered barely more than one ATR, ordinary chop rather than anything close to a breakdown.
Ether remains 50.29% below its $4,956.67 all-time high from August 24, 2025, 382 days ago, a steeper cycle drawdown than Bitcoin’s even after outperforming Bitcoin on a monthly basis, 30.96% versus 22.92%. The ETH/BTC ratio actually rose this week, from roughly 0.03086 at Friday’s open to 0.03154 at Thursday’s price, a reminder that Ether’s smaller weekly decline was relative outperformance even while both assets fell in dollar terms.
Consensys split its 100-million-user MetaMask wallet into a standalone company this week, chaired by Ethereum co-founder Joe Lubin, while keeping Linea, Besu and Teku under a renamed Consensys. A wallet used by a tenth of the world’s crypto holders now answers to different owners than the infrastructure it runs on, a structural change that matters more for Ethereum’s ecosystem than any single price move. The same September 10 to 16 data calendar that frames Bitcoin’s next move applies here too: a close back above $2,485 would repair most of this week’s damage, while a slide through the $2,432 low would open the door toward the $2,398 lower Bollinger Band.
Bitcoin Starts Trading Like a Hedge Again
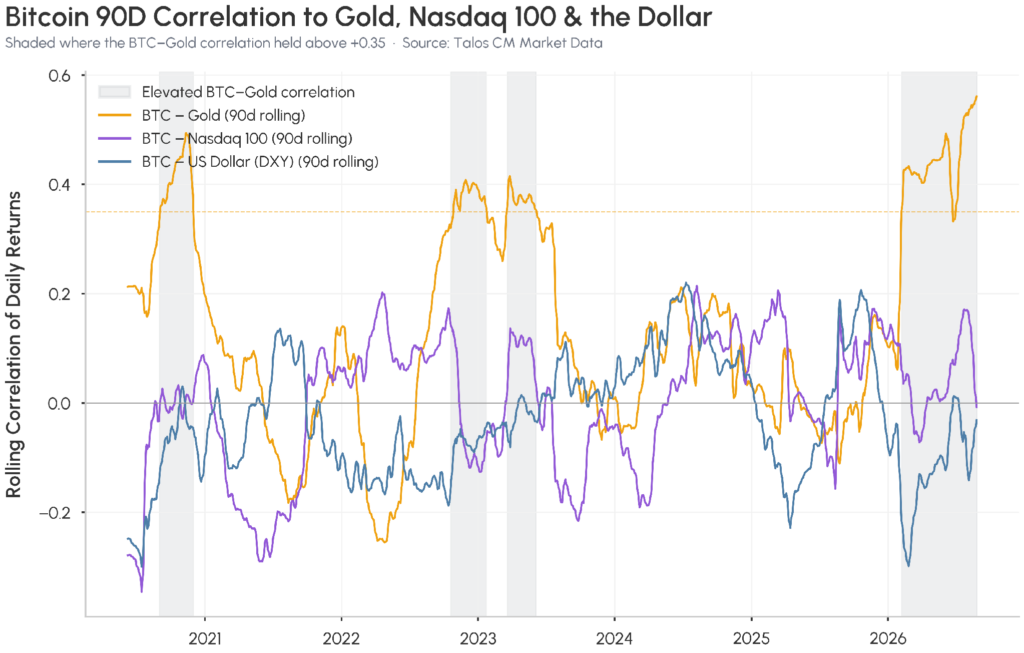
Bitcoin’s oldest pitch got a real test this week, and for once the price action backed it up. Brent crude broke $100 a barrel after US strikes destroyed five Iranian oil tankers and Tehran struck American bases in Jordan, sending the Stoxx Europe 600 down 0.5% and Nasdaq 100 futures lower. Bitcoin rose 1.4% to $79,700 in the same stretch, tracking gold and silver higher instead of falling with equities. That is the reverse of what happened on September 2, when a similar round of Iran headlines sent Bitcoin lower alongside stocks. Its rolling correlation with gold reached 0.56 this week, a level that would have sounded absurd to Bitcoin skeptics a few years ago and still sounds surprising to some of its own advocates.
Source: https://coinmetrics.substack.com/p/state-of-the-network-issue-380
The chart below puts numbers on the shift. Bitcoin’s rolling 90-day correlation with gold has spiked to roughly 0.56 right at the current edge of the data, a reading exceeded only a handful of times since 2020: during that year’s pandemic liquidity shock, a stretch in late 2022, and a brief window in 2023. What makes this spike different is what is happening next to it. Bitcoin’s correlation with the Nasdaq 100 and with the US dollar both sit closer to zero over the same 90 days, which argues the relationship is specific to gold rather than a broad flight to any available hedge.
Whether that holds is the open question. Every one of the earlier shaded spikes on the chart eventually faded back toward zero or reversed outright, and Bitcoin’s relationship with equities has been unstable enough this year that a single quiet week without geopolitical noise could send the correlation right back toward its old pattern. What this week actually proves is narrower than the headlines suggest. When the specific trigger is an oil-and-yields shock rather than a generic risk-off wave, Bitcoin has started behaving like the hedge its supporters have long argued it would eventually become.
Source: Coin Metrics, “State of the Network,” Bitcoin 90-day rolling correlation to gold, Nasdaq 100 and the US dollar (data via Talos), September 9, 2026.
A Tripled Bond Buyback Cannot Tame Yields
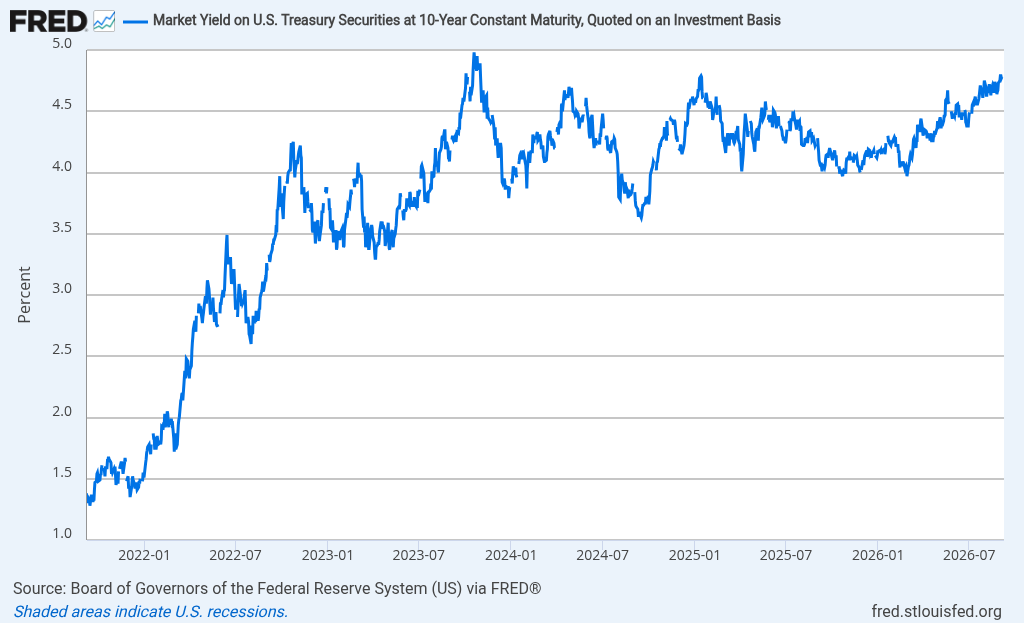
The Treasury tried to lean on the bond market this week, and the bond market didn’t fully cooperate. The Treasury Department will buy up to $6 billion in 10- to 20-year debt in its September 10 buyback operation, triple the size of its normal purchases and an unusually large intervention aimed at keeping longer-dated government debt liquid and, implicitly, capping how far borrowing costs can run. The 10-year yield rose to 4.85% anyway, its highest level since 2023, because some traders had priced in an even bigger buyback after Treasury Secretary Scott Bessent hinted purchases could exceed $4 billion per operation. Tripling the normal size still fell short of what the market wanted to see.
Source: https://fred.stlouisfed.org/series/DGS10
The chart shows why that gap matters. The 10-year yield has spent nearly four years climbing in a series of steps, from just above 1.25% in late 2021 to repeated pushes above 4.5% since 2024, with this week’s move putting it within striking distance of the 5% level briefly touched in 2023. Each rally in yields raises the government’s own refinancing costs on a debt load that keeps growing, which is exactly the dynamic buyback operations are designed to manage at the margin. A tripled operation that still doesn’t stop yields from rising is a signal about scale: the program, at its current size, isn’t big enough to offset the supply of new debt hitting the market.
For crypto, the read-through is the same one showing up in Bitcoin’s newfound correlation with gold. Higher long-term yields make holding a non-yielding asset more expensive in opportunity-cost terms, yet Bitcoin rose this week rather than fell, alongside a rising 10-year yield rather than against it. That combination, a hedge-like correlation with gold plus resilience against rising yields, is unusual enough to be worth watching for whether it survives the Fed’s September 16 decision or turns out to be a two-week coincidence tied to the Iran headlines specifically.
Source: Federal Reserve Bank of St. Louis (FRED), Market Yield on U.S. Treasury Securities at 10-Year Constant Maturity, data through September 2026.
Mark Your Calendars
Economic Data Releases:
- September 15-16, 2026 (Tuesday-Wednesday): Federal Reserve FOMC meeting and rate decision.
Token Unlock
- September 16, 2026 (Wednesday): Arbitrum (ARB) unlocks US$13.75 M (1.59% of released supply).
- September 25, 2026 (Friday): Humanity (H) unlocks US$21.53 M (7.34% of released supply).