
Bitcoin Reclaims $86k Before The Bid Fades
24th September 2026 • 9 mins read
This Week’s Recap
- Spot Bitcoin ETFs attract nearly $1,000m in a single day: The $999 million net inflow was the largest since October 2025 and landed on the same day leveraged shorts were being forcibly closed, which is why separating the two is hard work.
- Bitcoin recovers to $86,000 as oil prices fall: WTI below $90 gave risk assets the macro tailwind that had been missing since the summer, and crypto took more of it than equities did.
- Binance takes $100m stake in Circle under USDC deal: 1.24 million shares at $80.84 ties the largest exchange to the second-largest stablecoin for five years, deepening a relationship that already moves most of the market’s dollar settlement.
- Elon Musk’s X integrates trading with Coinbase and Kraken: Live charts and trading reachable through cashtags puts distribution in front of the venues rather than behind them, and it took Gemini along as well.
- Strategy buys 950 Bitcoin for $76m: The two-week pause ended at 846,000 BTC, and the purchase size suggests the treasury playbook has not changed with price.
- European Central Bank to invest in tokenised bonds: Settling DLT-based wholesale transactions in central bank money removes the settlement-risk objection that has held tokenised markets back, and the ECB is now a participant rather than an observer.
- Canada’s Big Six banks launch tokenised deposit initiative: The six institutions will test transfers of digital commercial deposits between themselves. No ledger, launch date or product has been named, so watch phase one detail rather than the announcement.
- Crypto PAC commits $30m to oppose Sherrod Brown: With the CLARITY Act dead in the Senate, Fairshake is moving the fight from legislation to seats, and $30 million in one race is the opening bid.
- Binance probed for alleged sanctions violations: Federal prosecutors are examining whether the exchange let users route around US sanctions on Iran, which keeps compliance risk at the top of the sector’s cost stack.
- Dogecoin leads market rebound with 15% pump: Short sellers paid $844 million for that move, and yet Bitcoin’s market-cap share barely moved, which tells you how narrow the rotation was.
- Animoca Brands suspends Nasdaq merger plans: Talks with Currenc stopped. The company still wants a listing, but the SPAC route just got more expensive.
- Bitmine buys $75m worth of Ether: Another 27,562 ETH moves the treasury firm toward its stated 5% of supply target, which at current issuance is a multi-year accumulation programme.
- Whitehats recover 52 Bitcoin from Coldcard hack: About 40% of the stolen funds now sit in a recovery trust for victims, an unusually clean outcome for a hardware wallet exploit.
- Big Tech eyes stablecoin and tokenisation talent: Google and Apple are hiring for digital asset payments and rails. Job postings move before products do, so treat this as a leading indicator rather than a launch.
- Saudi Arabia exits mBridge CBDC project: The kingdom left the China-backed cross-border platform that had drawn scrutiny from US policymakers, weakening the case that wholesale CBDC interoperability is a settled direction.
- Balancer considers orderly protocol wind-down: A governance proposal would return the remaining treasury to token holders instead of spending it on a turnaround, which is a rare and honest ending for a DeFi protocol.
Bitcoin Market Analysis
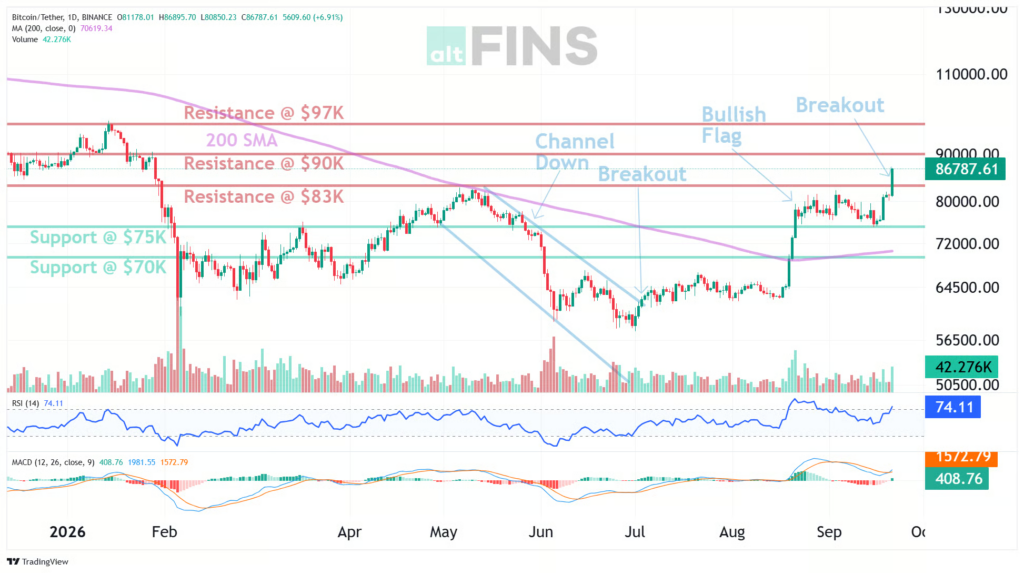
Bitcoin spent most of September grinding higher and then covered six weeks of range in a single session. Monday’s move from $81,178 to a $87,396 high was the week’s whole story compressed into hours, and it came from the least durable source available: forced buying. Glassnode had flagged $83,000 to $86,000 as a dense band of accumulated shorts built over months, and once price crossed $84,000 the band converted into market orders. CryptoQuant recorded Binance net taker volume jumping from roughly $11 million to $618 million within the hour as European trading opened. The trigger was not a news event but a positioning imbalance, which is why the first hour mattered more than the rest of the week.
Source: https://altfins.com/technical-analysis
The weekly close at $84,196 left Bitcoin up 10.48%, above every short and medium-term average on the board. Price sits 5.88% above the twenty-day SMA and 12.93% above the fifty-day. The 200-day average, which had capped the market for most of the year, is now $70,794 and price is 18.93% above it. RSI-14 at 64.5 is firm without being stretched, and MACD has been positive for 27 days with a histogram of 554. Bollinger bands have widened to $75,461.90 on the lower rail and $87,909.24 on the upper, and price closed the week inside them rather than pinned to the ceiling. ATR at 2,788.37 describes a market moving in wider daily ranges than at any point this quarter. Stoch RSI at 94.30 is the single reading that argues for caution, since it says short-term buying is stretched even while the longer measures stay constructive.
What makes the week more than a squeeze is what happened underneath it. Open interest rose 7.6% to about $156 billion while positions were being liquidated, which only happens when new capital replaces the old rather than leaving. Bitcoin futures open interest crossed back above 700,000 BTC for the first time in weeks. Funding rates stayed flat through the squeeze instead of spiking, which says the replacement positions were not crowded longs paying up for leverage. The market absorbed a violent two-way flush and ended the week with a healthier book than it started with. AltFins reads the structure as a resistance breakout above the $83,000 zone, with the nearest support at $75,000 and the next resistance at $90,000.
Source: https://sosovalue.com/assets/etf/us-btc-spot
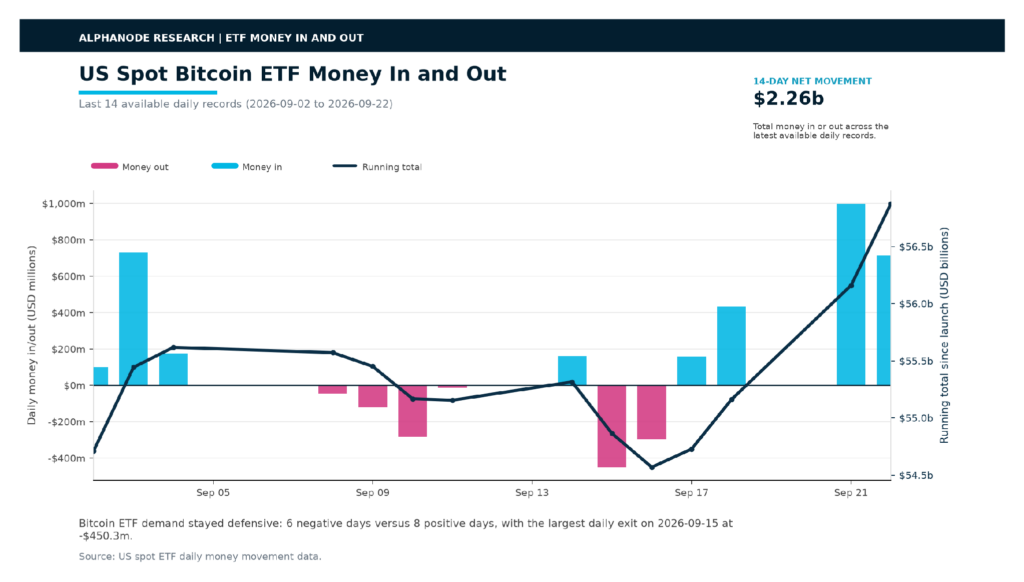
The ETF tape is the cleanest evidence that the demand was real. Monday’s $999 million net inflow was the ninth-largest on record, and Tuesday added $714.7 million. Net assets in US spot Bitcoin funds reached $110.84 billion, with cumulative inflows of $56.87 billion. The fourteen sessions to September 22 netted $2.26 billion across eight positive and six negative days, a pattern that looks less like a chase and more like steady allocation. That distinction is what separates this move from the leverage-driven rally in the spring, when the same funds bled for weeks after the squeeze ended. Carrying $110.84 billion of net assets means the marginal buyer is a scheduled allocator, not a trader working a level.
Valuation has not become the constraint. Bitcoin trades 33.17% below its October 2025 all-time high of $126,217.71, and 45.95% above the 52-week low of $57,793.56. The market is repricing the asset upward from a deep drawdown rather than extending a peak, which is a different risk profile from the one that ended last cycle. It also means the ceiling that stopped the last run is still distant, and the supply bought above $100,000 remains underwater.
The levels that matter are narrow. Support sits at $83,500, the floor of this week’s consolidation, then $75,000. Resistance is $90,000, where options open interest has concentrated, and $97,000 beyond it. A close below $83,500 would say the ETF bid was positioning on a squeeze rather than a reallocation, and the AltFins structure, which reads the move as a resistance breakout above the $83,000 zone, holds only while that floor does.
Ethereum Market Analysis
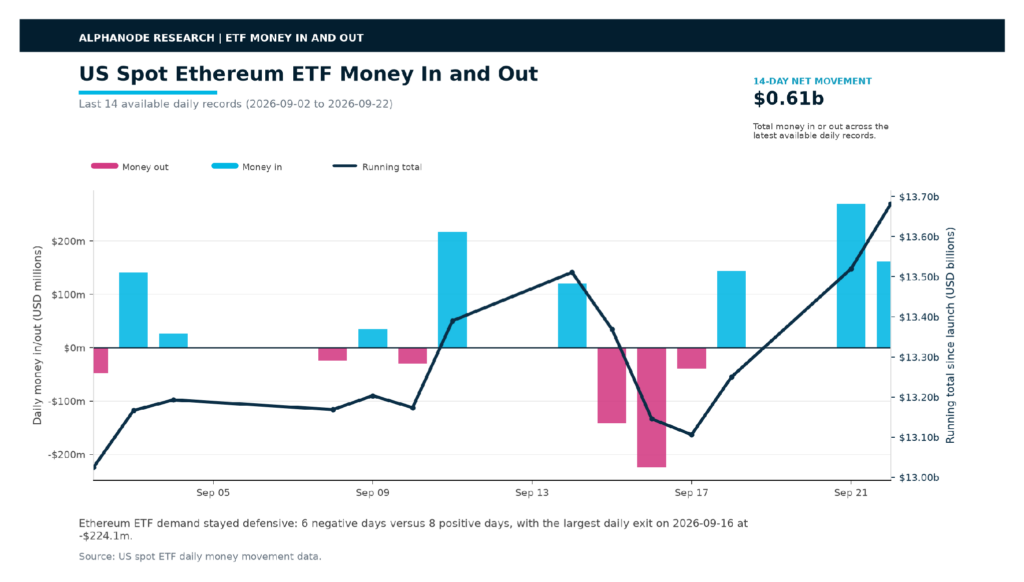
Ether’s week is better understood through who was buying than through the chart. Bitmine added 27,562 ETH for roughly $75 million, moving Tom Lee’s treasury firm closer to a self-declared target of 5% of total supply, and that kind of programme buys on a schedule rather than on momentum. Spot Ether ETFs collected $609.2 million across the fourteen sessions to September 22, with $270 million arriving on Monday alone.
Source: https://altfins.com/technical-analysis
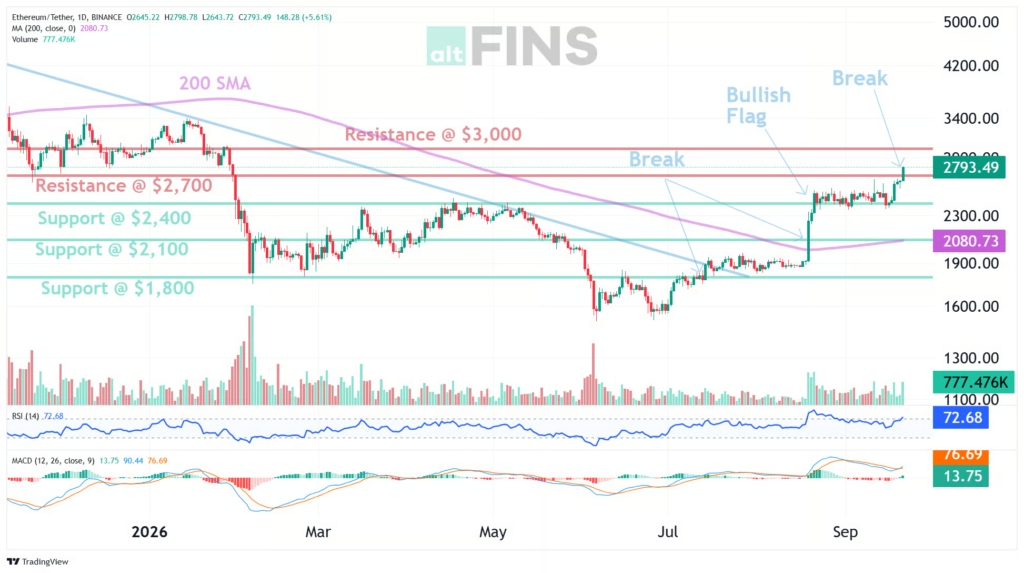
Price still did the work. Ether ran from $2,645 to a $2,807 high on Monday, closed the week at $2,663, and gained 10.12%. The move carried it cleanly through $2,700, which AltFins now marks as support-turned-resistance, with $3,000 the next objective and $2,400 the nearest floor. Price sits 14.50% above the fifty-day average and 27.54% above the 200-day. ATR of $101.89 and a MACD histogram of 96.38 both point to a market that has expanded rather than exhausted, and turnover of $4.37 billion on the breakout session was the heaviest of the month.
Momentum cooled faster than Bitcoin’s. Wednesday’s 3.29% decline was steeper than Bitcoin’s 2.34%, and the short-term trend reading is mixed rather than up. RSI-14 at 62.0 and a MACD histogram of 12.14 describe a market that is no longer accelerating but has not turned.
Source: https://sosovalue.com/assets/etf/us-eth-spot
The ETF channel is doing more of the work here than it did a quarter ago. Net assets in US spot Ether funds reached $17.92 billion against cumulative inflows of $13.68 billion, so roughly three-quarters of all money that has ever entered those products arrived and stayed. Monday’s $270 million was the second-largest daily print in the window after September 11’s $216.4 million.
Where Bitcoin is recovering from a deep drawdown, Ethereum is doing something closer to a re-rating. It is 46.11% below its August 2025 all-time high of $4,956.67, and still 77.41% above its 52-week low of $1,505.52, which means the recovery has further to run before it approaches prior highs. The three-month gain of 69.85% against Bitcoin’s 40.81% suggests the rotation into Ether has been under way for longer than this week. Longer-term holders who bought the 2021 and 2024 peaks are still carrying losses, and that overhang is the main reason Ether lags its own fundamentals.
Watch the $2,700 line. Holding it keeps the breakout structure intact and leaves $3,000 in play. Losing it points back to $2,400, then $2,100, where the ETF bid would get its first real test. Bollinger bands at $2,329.42 and $2,743.86 have narrowed since Monday, and price closed the week against the upper rail rather than through it. The treasury accumulation programmes are indifferent to either outcome, which is precisely why they matter.
Banks Are Tokenising Money To Head Off Stablecoins
Canada’s six largest banks announced on September 22 that they will build a shared interbank system for tokenised Canadian dollar deposits. Bank of Montreal, CIBC, National Bank, RBC, Scotiabank and TD are the participants. The first phase covers transfers of digital representations of commercial deposits between the six institutions, with other deposit-taking institutions expected to join later. No ledger, launch date or commercial product has been named.
Source: https://www.ecb.europa.eu/paym/target/pontes/html/index.en.html
The announcement arrived twelve days after Canada’s banking regulator removed the obstacle. On September 10, the Office of the Superintendent of Financial Institutions stated that a tokenised deposit is not legally distinct from a traditional one, and that the technology used to represent a product does not determine its legal character. That matters because it let six competitors move together under existing rules: a tokenised deposit stays a liability of the issuing bank, redeemable at par, carrying the same capital and liquidity treatment as an ordinary deposit. OSFI attached conditions, pointing institutions to its B-13 technology and cyber risk guidance and B-10 third-party risk guidance, and requiring engagement with lead supervisors before launch. Canada has run a version of this before. Project Samara, completed in March 2026 with the Bank of Canada alongside Export Development Canada, RBC and TD, settled a C$100 million tokenised bond in a simulated wholesale environment. The deposit initiative extends that architecture from the securities to the money used to buy them.
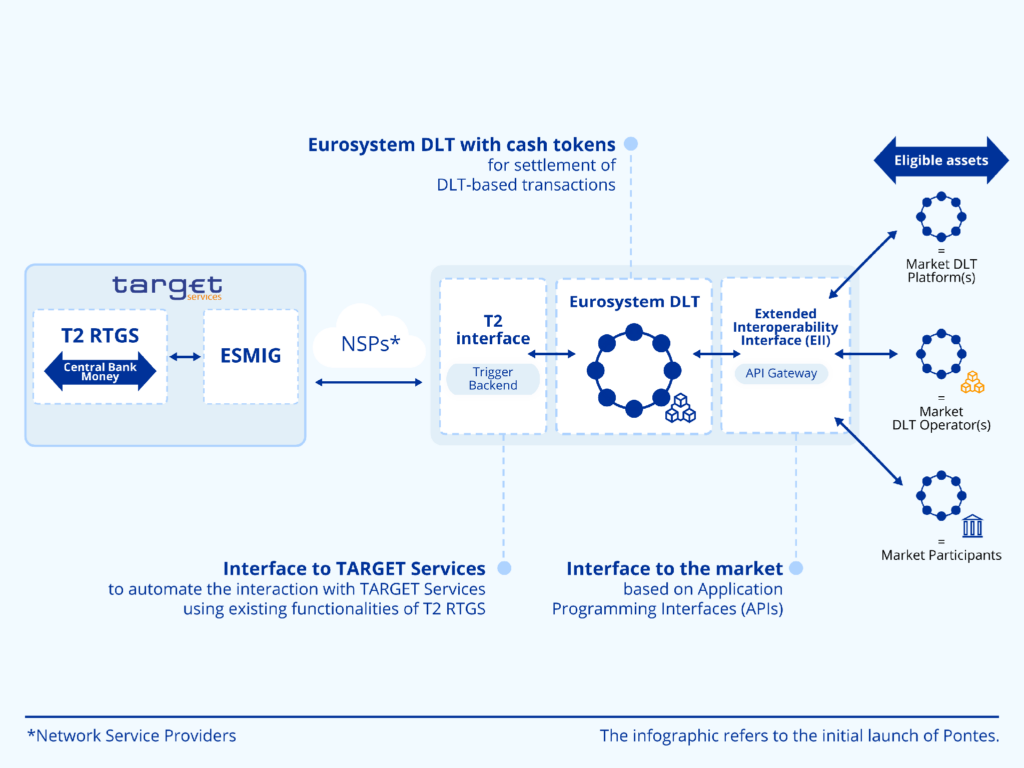
The European Central Bank is building the settlement layer for the same idea. Pontes, launched on September 21, links market distributed ledger platforms to TARGET Services so that wholesale tokenised transactions settle in central bank money, using either cash tokens on the Eurosystem DLT platform or the T2 real-time gross settlement system. The ECB also began preparatory work to invest part of its own funds in tokenised securities settled through Pontes, and set full implementation for 2028. The competitive logic behind both projects is defensive rather than expansionary. A tokenised deposit keeps money inside the regulated banking perimeter, where the claim runs against a supervised bank rather than against a separate issuer and its reserve pool. Canada’s own analyst note makes the point plainly: the design guards existing settlement flows against stablecoin disintermediation. The timing explains itself. Stablecoin supply expanded through the same quarter that bank deposit growth stalled, and every dollar settling outside the banking system is a dollar the banks no longer earn a spread on. Tokenising the deposit does not open a new revenue line, it defends an existing one. OSFI’s conditions make the trade-off explicit: institutions must keep holders identifiable at all times, because a tokenised deposit whose holder cannot be determined reverts to unsecured wholesale funding from another legal entity and carries a materially higher funding cost.
The Altseason Signal Fired Without The Rotation
Glassnode’s altcoin cycle signal flipped to altseason this week, printing 81.25 while Bitcoin’s market-cap dominance stalled at 59.7%, just below the 60% line that has framed the rotation debate all year. Total crypto market capitalisation reclaimed $3 trillion and the altcoin component reached $1.19 trillion. Read alone, that combination is the standard setup for capital moving down the risk curve. The signal is built on the relationship between Bitcoin’s price behaviour and the rest of the market across previous cycles, so a flip has historically preceded a period where altcoins outperform on a broad basis.
Source: https://coinmarketcap.com/charts/
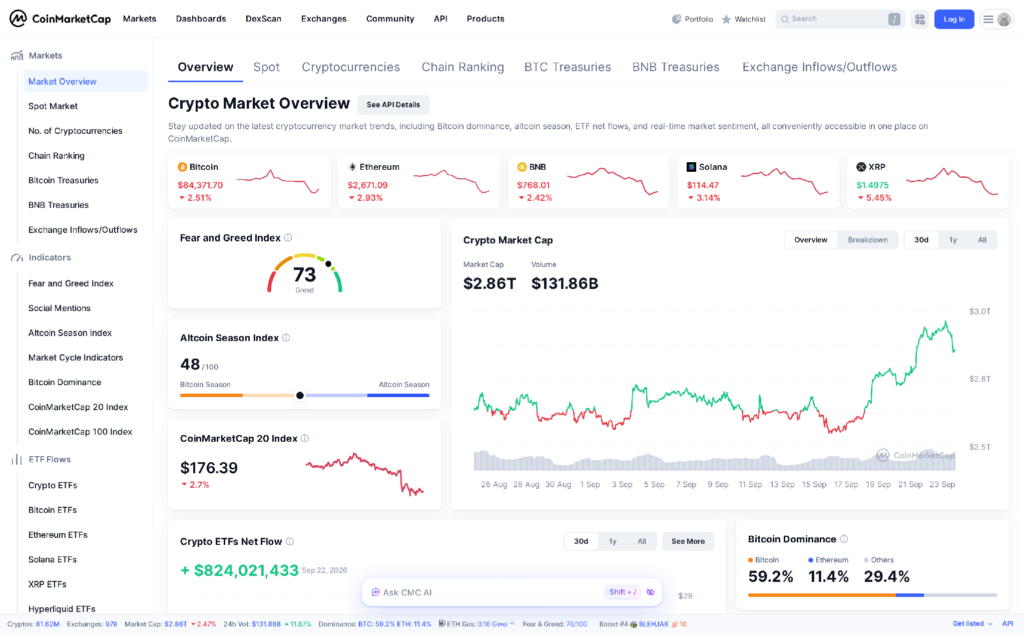
The breadth measures did not agree. CoinMarketCap’s Altcoin Season Index reads 48 out of 100, which is Bitcoin Season, not altseason. Bitcoin dominance sits at 59.2% with Ether at 11.4%, and the index has not crossed into altcoin territory at any point this month. Dogecoin’s 15% pump and PEPE’s 24% move look like rotation until you notice that dominance rose on the same days. Two or three large meme-coin moves are not the broad participation that the cycle signal is supposed to anticipate. The squeeze explains the anomaly. Tokens carrying the heaviest short interest posted the largest gains, which is a leverage effect rather than a capital-allocation effect, and the money that funded those moves left as quickly as it arrived.
What the data actually describes is a Bitcoin-led advance with isolated speculative spikes. The $999 million ETF inflow went into Bitcoin products, and the squeeze that preceded it was Bitcoin and Ether shorts, not altcoin positioning. Money entering through regulated vehicles concentrates in the two assets those vehicles hold, and no issuer has yet listed an ETF that tracks a basket of smaller tokens. An altseason driven by ETF flows into BTC and ETH would be a different kind of cycle from the ones the signal was calibrated on, and there is not yet evidence that it works that way. The interpretation that fits the figures is narrower: a handful of tokens with active short interest rallied hard, dominance held because the inflows went to Bitcoin, and the breadth measures never confirmed the rotation. The signal remains worth tracking as a leading indicator, and it may well be right with a delay. It is not yet a description of what is happening.
Mark Your Calendars
Economic Data Releases:
- September 29, 2026 (Tuesday): US job openings and labor turnover survey for August.
- September 30, 2026 (Wednesday): US personal income and outlays for August, including the PCE price index, alongside the third estimate of second-quarter GDP.
Token Unlock
- September 25, 2026 (Friday): Plasma (XPL) unlocks US$152.85 M (63.20% of released supply).
- September 26, 2026 (Saturday): STBL (STBL) unlocks US$97.92 M (77.25% of released supply).