Bitcoin Holds $100K as Ethereum Rallies Post-Pectra.
15th May 2025 • 13 mins read
This Week’s Recap
- Coinbase to acquire Deribit for $2.9 billion: Coinbase announced a $2.9 billion acquisition of crypto options platform Deribit, paid in $700 million cash and 11 million COIN shares to expand its derivatives offerings.
- U.S. Senate to vote on GENIUS stablecoin bill: The GENIUS Act, proposing mandatory reserve requirements and enhanced transparency for stablecoin issuers, is scheduled for a Senate vote.
- CoinShares: $867 million Bitcoin ETF inflow last week: Bitcoin-led ETFs drew $867 million in net inflows last week, while Ether ETPs saw $1.5 million added, per CoinShares data.
- BlackRock’s iShares crypto products attract $1 billion: BlackRock’s iShares crypto investment products collected $1 billion in net inflows last week, topping the market’s funds.
- Solana ETPs face outflows despite altcoin rally: Solana investment products saw $3.4 million in outflows, even as Sui ETPs led altcoin inflows with $11.7 million.
- Crypto investment products net $882 million this week: Global crypto investment products drew $882 million in weekly inflows, bringing year-to-date totals to $6.7 billion.
- ETFGI reports record $360.9 billion U.S. ETF inflows: The U.S. ETF industry recorded $360.9 billion in net inflows during the first four months of 2025, a new high.
- Senate probes Trump’s crypto ventures: U.S. senators opened investigations into former President Trump’s potential promotion of meme coins, with legislation dubbed the MEME Act targeting official endorsements.
- Bitcoin miners increase sales amid profit-taking: Major mining firms including Marathon and Riot have been liquidating BTC reserves to secure liquidity following the recent price rally.
- Tether Treasury issues $1 billion USDT on Tron: Tether pre-authorized a $1 billion USDT issuance on the Tron network as inventory for future demand, with no immediate market circulation implied.
- Tether USDT supply surpasses $150 billion: Tether’s USDT circulating supply exceeded $150 billion, cementing its 62 percent dominance of the stablecoin market.
- Tether unveils ‘Tether AI’ for crypto-AI payments: Tether launched an open-source AI protocol enabling native Bitcoin and USDT payment integration into artificial intelligence infrastructure.
- Tether nears $120 billion in U.S. Treasuries reserves: Tether reported approximately $120 billion exposure in U.S. Treasuries and over $1 billion in operating profit for Q1 2025.
- MiCA prompts USDT delistings in Europe: Ahead of the EU’s MiCA regulations, exchanges such as Binance and Kraken have delisted or restricted USDT trading for EEA users.
- Coinbase share price dips on earnings despite Deribit deal: Coinbase’s stock fell after earnings missed expectations, even as it announced the $2.9 billion Deribit acquisition.
- Bitcoin dominance dips to 63.9 percent as altcoins outperform: Bitcoin’s market share fell from 65 percent to 63.9 percent, coinciding with a rebound in altcoin performance.
- Altcoin Season Index rebounds to 41: Data from CoinMarketCap shows the Altcoin Season Index climbed to 41, nearing its 90-day high amid Ethereum’s rally.
- Solana Network Leads Global DEX Trading Volume with 48% Weekly Growth: BlockBeats data via DefiLlama shows Solana’s DEX volume hit $45.71 billion in 24 hours and $275.15 billion over the past week, marking a 48 percent increase
- XRP Investors Just Received Fantastic News From the SEC: The SEC provided a non-publication order on XRP sales to institutions, narrowing its enforcement focus and clearing a key regulatory hurdle for Ripple’s token
- Polkadot Is Still Down More Than 50%. Should You Buy the Dip?: From April 9 to May 12, DOT has rallied over 51 percent yet remains more than 50 percent below its all-time high, prompting debate on whether current prices present a buying opportunity
- Chainlink, Kinexys by J.P. Morgan, and Ondo Finance Team Up for Cross-Chain Settlement: This initiative leverages Chainlink’s CCIP to enable atomic settlement of tokenized assets between Kinexys’s securities and Ondo’s token protocols
- Aave and Uniswap Hit New Records; DeFi Shows Resurgence: DeFiLlama reports Uniswap processed over $3.6 billion in 24-hour volume and Aave achieved record TVL, suggesting renewed on-chain activity across major protocols
- Solana (SOL) Price News: DeFi Growth Fuels SOL Rally: SOL surged over 37 percent in the past month, ending at $177.88 on May 14, driven by increased DeFi TVL and on-chain transaction growth
- Uniswap Becomes First DEX to Cross $3 Trillion in Total Trading Volume: Uniswap marked a historic milestone with over $3 trillion in cumulative trading volume, reinforcing its dominance in decentralized exchange
Bitcoin Market Analysis
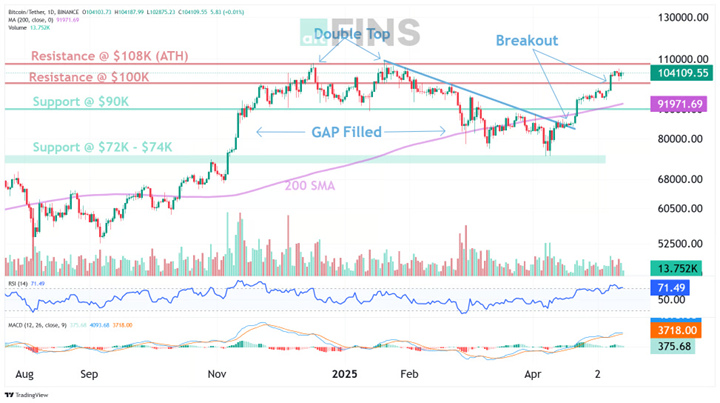
Over the past seven days, Bitcoin has staged a clear bullish breakout. After trading between $96 000 and $98 500 early in the week, price accelerated on May 8 when optimism over a U.S.–U.K. trade agreement drove a surge through $100 000. Heavy volume confirmed institutional participation, and by May 12 BTC hit an intraday high near $105 000 before settling around $104 000. The $100 000 level now serves as reliable support. Examining market structure reveals a sequence of higher lows and higher highs. Buyers defended the $96 000 swing low and absorbed supply in the $90 000 to $100 000 gap area. That gap fill signaled exhaustion of sellers, directing momentum toward the all-time high zone. With Fibonacci extensions lining up near $108 000, the path of least resistance points higher.
Source: https://altfins.com/technical-analysis
Classical indicators corroborate the uptrend while flagging potential pauses. The 200-day simple moving average, around $92 000, acted as support before price reclaimed it, creating a golden-cross environment favorable to further gains. The 14-day RSI rests at approximately 71 points, indicating overbought conditions that often prompt pullbacks. Meanwhile, the MACD line remains above its signal line yet shows contracting histogram bars, suggesting bullish momentum may be peaking.
Beyond price and moving averages, futures and on-chain metrics illustrate a deepening market commitment. Open interest on major derivatives venues has risen alongside price, implying fresh leverage rather than position rollovers. Perpetual swap funding rates have increased but remain below extremes associated with violent squeezes. Large-wallet holders, defined as those with at least 1 000 BTC, have increased balances this week, indicating accumulation by whale-size investors.
Looking ahead, several levels and signals warrant close attention. On the upside, $108 000 represents the next resistance target and all-time high zone. A pullback into $100 000 or the 200-day average would offer a lower-risk entry, especially if volume remains elevated. A slip below $92 000 would threaten the breakout and suggest a deeper correction. For indicators, an RSI drop under 65 or a bearish MACD crossover would confirm waning momentum, while funding rates above 0.10 percent per eight-hour period could signal overly stretched sentiment.
Macro developments have reinforced Bitcoin’s recent strength. The break above $100 000 coincided with reports of advancing U.S.–U.K. trade talks, which eased concerns over global tariff escalation. U.S. equity indices rallied in tandem, creating a broader risk-on environment. Bitcoin’s renewed correlation with equities underscores its evolving role as both a growth asset and a macro hedge when liquidity conditions improve.
Institutional flows continue to underpin price. Standard Chartered’s analysis shows $5.3 billion of net inflows into U.S. spot Bitcoin ETFs over the past three weeks, pushing cumulative assets under management past $40 billion. These inflows reflect growing comfort among large allocators with regulated vehicles for crypto exposure. Authorised participants arbitrage share premiums and discounts, ensuring that ETF creation flows translate directly into spot Bitcoin purchases.
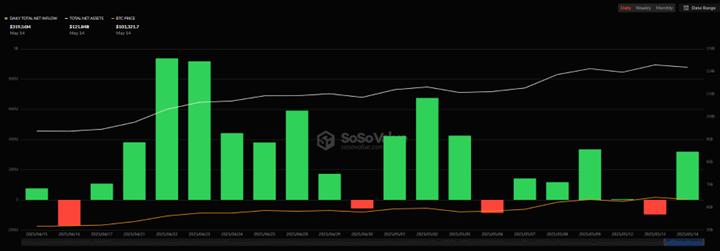
Source: https://sosovalue.com/dashboard/total-crypto-spot-etf-fund-flow
Regulatory milestones add further legitimacy. Arizona’s new unclaimed digital assets law allows the state to take custody of abandoned crypto after three years, funding public services. New Hampshire’s approval of a strategic Bitcoin reserve, permitting up to five percent allocation of state funds, marks a first for U.S. states. Such developments broaden Bitcoin’s narrative beyond speculative asset to strategic financial instrument, encouraging consideration by pensions, endowments and insurers.
Ethereum Market Analysis
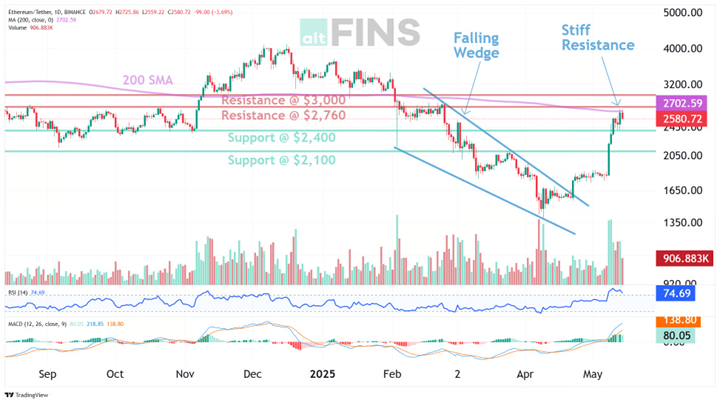
Over the past week, Ethereum has broken free from its multi-month downtrend and staged an emphatic rally. On May 8, ETH rebounded from roughly $2 206, and by May 13 it pierced $2 680 before retreating modestly to $2 568 as of May 15. This seven-day advance marked a decisive breakout from the falling-wedge pattern visible on the attached chart, and confirmed that the $2 400 area had flipped from resistance into support. Just above current levels, the $2 760 zone and the 200-day simple moving average (near $2 703) now represent the most formidable hurdles to fresh upside.
Source: https://altfins.com/technical-analysis
Behind the price move, market structure has shifted in Ethereum’s favor. A clear series of higher highs and higher lows shows buyers stepping in on each dip, while the prior trading gap between $2 100 and $2 400 has been fully absorbed. In technical analysis, filling such gaps often exhausts supply, clearing the way toward Fibonacci extensions that point squarely at the $3 000 round number and ultimately the next all-time high. Momentum indicators reinforce the bullish case but warn of near-term fatigue. The 14-period Relative Strength Index climbed above 74, signaling overbought conditions. Meanwhile, the MACD line sits comfortably above its signal line, and the expanding histogram bars attest to strong buying pressure. A golden-cross environment has emerged as shorter moving averages cross above the 200-day SMA, a configuration that often precedes sustained rallies—even as traders acknowledge the likelihood of a brief, healthy pullback. Funding rates on perpetual swaps have ticked upward but remain below extremes that trigger rapid, volatile unwinds. Crucially, large investors have been accumulating over the past 48 hours, whales added approximately $2.4 billion worth of ETH—reducing exchange balances and reinforcing scarcity dynamics.
Looking ahead, the $2 400–$2 100 band will serve as the first line of defense for bulls, while a fall below $2 060 could signal a deeper consolidation. On the upside, overcoming $2 760 and holding above the 200-day SMA would open the path to $3 000. Traders should watch for the RSI to dip below 70 or for MACD histogram contraction as early warning signs of profit-taking. A rebound from support with renewed volume would affirm the uptrend’s resilience.
On-chain data also revealed roughly $167 million worth of ETH about 67,265 tokens flowing out of Binance and some $800 million in BTC (8,000 coins) departing Coinbase, the latter move coinciding with news that Coinbase will join the S&P 500. Such large-scale withdrawals into cold or non-exchange wallets are classic hallmarks of institutional accumulation, as holders signal no immediate intention to sell and position themselves for longer-term exposure. The ETH outflow may reflect growing confidence in Ethereum’s upcoming staking and ETF prospects, while the BTC movement, timed with Coinbase’s S&P 500 inclusion, suggests that smart money is pre-positioning Bitcoin as a formal asset class within traditional finance. Taken together, these near-$1 billion withdrawals underscore a strategic shift by sophisticated investors and could presage the next phase of crypto’s market expansion.
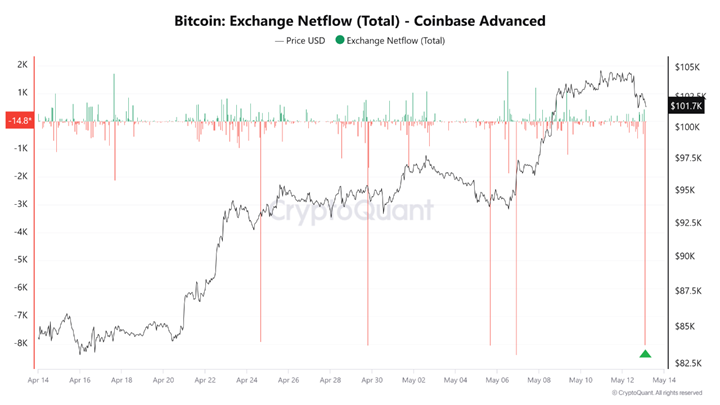
Source: https://cryptoquant.com/ | @amr0taha
Fundamental catalysts have bolstered this technical backdrop. On May 7, Ethereum activated its Pectra upgrade, rolling out 11 key improvement proposals that expand blob data capacity for layer-2 scaling, raise the validator cap to 2 048 ETH, and introduce smart-account functionality. These enhancements address both developer and institutional needs, laying groundwork for improved staking, user experience, and scaling—factors likely to underpin further price appreciation.
U.S. Treasury Yields Instability
U.S. Treasury yields have risen sharply over the past week as markets recalibrate expectations for inflation persistence and tighter monetary policy. The benchmark 10-year yield climbed back above 4.5 percent—its highest level since February—on stronger-than-expected labor and consumer-price data, underscoring investor concern that the Federal Reserve may keep policy restrictive for longer than previously anticipated. At the same time, President Trump’s executive order to align U.S. drug prices with the lowest international benchmarks introduces additional fiscal pressure by potentially reducing federal revenues, while his announcement of a $600 billion Saudi investment pledge highlights large-scale financing needs that could necessitate increased Treasury issuance. Together, these developments have elevated term premia and driven borrowing costs higher across mortgages, corporate debt and government funding.
In the coming weeks, bond markets are likely to oscillate within an elevated range as participants digest incoming economic releases and policy signals. Should May’s inflation or payroll reports surprise to the upside, yields may test 4.7–5.0 percent, further straining rate-sensitive sectors such as housing and high-yield credit. Conversely, any indication of slowing growth or a dovish shift in forthcoming Federal Open Market Committee minutes could see yields pull back toward the 4.3–4.4 percent area. Key variables to monitor include demand at Treasury auctions, nuance in Fed communications on balance-sheet runoff, and fresh commentary on fiscal plans out of Washington—all of which will determine whether this bout of rising yields represents a durable repricing or merely a transient adjustment ahead of renewed safe-haven flows.
Mark Your Calendars
- May 15, 2025: Initial Jobless Claims for the week ending May 10 released at 8:30 AM ET
Forecast: 226,000 | Previous: 228,000 - May 15, 2025: Core Producer Price Index (Core PPI) for April published at 8:30 AM ET
Forecast: 0.3% | Previous: -0.1% - May 15, 2025: Fed Chairman Jerome Powell delivers speech at 8:40 AM ET
Token Unlock
- May 16, 2025: Arbitrum (ARB) unlocks 92.63 M ARB ($38.72 M; 1.95 % of market cap)
- May 16, 2025: Avalanche (AVAX) unlocks 1.67 M AVAX ($40.29 M; 0.40 % of market cap)
- May 16, 2025: Finetune (FTN) unlocks 20.00 M FTN ($87.60 M; 4.66 % of market cap)
- May 20, 2025: Pyth Network (PYTH) unlocks 2.13 M PYTH ($363.92 M; 58.62 % of circulating supply)