Trump’s Tariff Freeze Sparks Biggest S&P Surge Since 2008.
10th April 2025 • 11 mins read
This Week’s Recap
- Grayscale files for Solana ETF on NYSE, excluding staking amid Trump’s crypto-friendly push: Grayscale Investments has filed an S-1 form with the U.S. Securities and Exchange Commission to convert its Solana Trust into an exchange-traded fund (ETF) on NYSE Arca. The ETF will track Solana’s price without participating in staking, aligning with the current regulatory environment. This move follows increased interest in alternative cryptocurrencies amid the Trump administration’s favorable stance toward digital assets. Reuters
- PayPal and Venmo to support Solana and Chainlink transfers: PayPal announced the expansion of its cryptocurrency offerings to include Solana (SOL) and Chainlink (LINK). Users of both PayPal and Venmo in the U.S. will soon be able to buy, hold, sell, and transfer these cryptocurrencies directly within their accounts, enhancing the platforms’ digital currency capabilities. CoinDesk
- Stablecoin market cap reaches $234.6B with $30.9B increase; Tether’s USDT supply hits $66.72B: The stablecoin market has achieved a new record high, with total market capitalization surpassing $234 billion. Tether’s USDT supply has grown to $66.72 billion, reflecting the increasing demand for stable digital assets.
- Altcoin volumes become more concentrated, signaling potential final major rally: Recent analyses indicate that the top 10 altcoins now account for 64% of total trading volume, suggesting that investors are focusing on a select group of cryptocurrencies. This trend may point to a forthcoming, possibly last, significant rally in the altcoin market.
- First Digital redeems $26M after FDUSD depeg, dismisses Sun insolvency claims: Following Tron founder Justin Sun’s allegations of insolvency, First Digital Trust redeemed nearly $26 million in stablecoin withdrawals after its FDUSD token briefly lost its US dollar peg. The firm refuted Sun’s claims, asserting its solvency and accusing Sun and Techteryx of attempting to deflect blame from their own management issues.
- OFAC delists Tornado Cash; victory in sanctions case remains uncertain: The U.S. Treasury’s Office of Foreign Assets Control (OFAC) has removed Tornado Cash from its sanctions list, following a Fifth Circuit Court ruling that deemed the initial sanctions exceeded OFAC’s authority. Despite this delisting, the Treasury Department maintains its commitment to monitor and disrupt illicit cyber activities, leaving the long-term implications of the court’s decision uncertain.
- SEC to reassess Biden-era crypto guidance amid regulatory shakeup: The U.S. Securities and Exchange Commission (SEC) is reviewing previous cryptocurrency-related guidance to align with current priorities. This reassessment aims to ease regulatory pressure on the digital assets sector and may lead to new regulatory frameworks. CoinDesk AInvest+6CoinDesk+6Yahoo Finance+6
- Solo Bitcoin miners winning more blocks recently: Individual Bitcoin miners, known as solo miners, have been successfully mining blocks more frequently. This trend has sparked discussions about the decentralization of the Bitcoin network and the potential for solo miners to compete with larger mining pools. Decrypt
- BlackRock’s BUIDL fund bridges crypto and traditional finance: BlackRock has launched the USD Institutional Digital Liquidity Fund (BUIDL), a tokenized money market fund on the Ethereum blockchain. BUIDL offers investors stable tokens valued at $1 each, accruing interest on-chain, and invests in cash, U.S. Treasury bills, and repurchase agreements. This initiative signifies a major step in integrating traditional financial assets with blockchain technology.
- Nearly 400,000 FTX users risk losing $2.5 billion in repayments: Approximately 392,000 creditors of the bankrupt cryptocurrency exchange FTX have yet to complete the mandatory Know Your Customer (KYC) verification process. These users risk forfeiting a combined $2.5 billion in repayments if they fail to meet the extended June 1 deadline. Claims under $50,000 account for about $655 million, while those exceeding $50,000 total approximately $1.9 billion.
- Stablecoins emerge as a top investment focus for crypto venture capitalists: Venture capital firms are increasingly investing in stablecoin projects, recognizing them as a significant success in the cryptocurrency sector. This trend underscores the growing importance of stablecoins in the digital economy. The Block
- Changpeng Zhao appointed as strategic advisor to Pakistan’s Crypto Council: Former Binance CEO Changpeng Zhao has been named a strategic advisor to the Pakistan Crypto Council (PCC). In this role, Zhao will provide guidance on cryptocurrency regulation, infrastructure, and adoption, supporting Pakistan’s efforts to integrate blockchain technology into its financial system.
- Hong Kong allows licensed platforms to offer crypto staking services: The Securities and Futures Commission (SFC) of Hong Kong has introduced new guidelines permitting licensed Virtual Asset Trading Platforms (VATPs) and authorized virtual asset funds to offer staking services. These platforms must retain full control of client assets and disclose all associated risks, including potential vulnerabilities like blockchain errors and hacking. This move contrasts with Singapore’s ban on retail staking and the U.S. SEC’s restrictive stance. CoinDesk crypto.news+5CoinDesk+5Techpression+5
- US SEC declares certain US Dollar stablecoins like USDT and USDC are not securities: The U.S. Securities and Exchange Commission’s Division of Corporation Finance issued guidance stating that certain stablecoins designed to maintain a stable value relative to the U.S. Dollar, backed by low-risk, liquid assets, and redeemable on a one-to-one basis, do not constitute securities under federal law. This clarification provides regulatory certainty for issuers and users of such stablecoins. SEC Statement
- Tether considers launching a U.S.-only stablecoin amid evolving regulations: Tether, the issuer of the world’s largest stablecoin USDT, is contemplating the creation of a stablecoin specifically for the U.S. market. This initiative aligns with anticipated regulatory frameworks under President Donald Trump’s administration, which aims to position the U.S. as a leader in the crypto sector. Financial Times CoinDesk+2Axios+2Axios+2
- Ripple to acquire prime broker Hidden Road for $1.25B to enhance stablecoin offerings: Ripple has announced its intention to purchase multi-asset prime brokerage firm Hidden Road for $1.25 billion. This strategic move aims to bolster Ripple’s presence in traditional finance and enhance the utility of its U.S. dollar-pegged stablecoin, RLUSD, by integrating Hidden Road’s extensive institutional client network.
- BlackRock partners with Anchorage Digital for Bitcoin and Ethereum ETF custody: BlackRock has selected Anchorage Digital Bank N.A., the only U.S. federally chartered digital asset bank, to provide custody services for its iShares Bitcoin Trust ETF (IBIT). This partnership aims to enhance the security and operational resilience of BlackRock’s cryptocurrency holdings. Cointelegraph+2crypto.news+2American Banker+2
- Galaxy Digital gains SEC approval for Nasdaq listing, expected in May: Galaxy Digital has received approval from the U.S. Securities and Exchange Commission (SEC) for its reorganization and intends to list its shares on the Nasdaq under the ticker symbol “GLXY.” A shareholder meeting is scheduled for May 9, with the listing anticipated to occur shortly thereafter, pending final approvals.
U.S. Tariffs and Escalating Trade Disputes
Trump’s announcement of a 90-day pause on new tariffs for most countries brought immediate relief to global markets. This temporary suspension removes a major overhang and gives investors a window of stability. With macroeconomic uncertainty momentarily lifted, risk assets surged and liquidity conditions improved. The market responded swiftly. The S&P 500 jumped 9.52 percent in its largest daily gain since 2008, the Nasdaq rallied over 12 percent, and the Dow climbed nearly 8 percent. Every major sector in the S&P 500 closed higher, with technology stocks gaining more than 14 percent.
The rally came after four consecutive days of losses that marked the steepest selloff since the pandemic era. Trump’s decision to exempt many countries from immediate tariffs while simultaneously raising the levy on Chinese imports to 125 percent was seen as a calculated attempt to calm global tensions while continuing to pressure Beijing. Although the policy shift offers a short-term reprieve, uncertainty remains about what follows after the 90-day period, leaving room for further volatility.
This rebound illustrates how deeply tied investor sentiment has become to policy shifts. The CBOE Volatility Index fell sharply from session highs, and Goldman Sachs retracted its recession forecast, restoring its earlier growth expectations for 2025. However, market strategists remain cautious. Some view this as a relief rally rather than a reversal, especially given the pace and unpredictability of recent policy changes.
For crypto markets, the implications are twofold. On one hand, reduced uncertainty supports broader risk appetite and could renew inflows into digital assets. On the other hand, the volatile policy environment serves as a reminder of crypto’s value as an alternative to centralized financial systems. As global coordination unravels and fiat policies shift abruptly, some investors are likely to rotate toward decentralized stores of value. The coming weeks will be critical in determining whether this bounce turns into sustained momentum or proves to be a temporary reaction.
A full timeline of the tariff escalation and its market impact follows below.
U.S. Tariff Escalation Timeline
- Feb 1: U.S. imposes 25% tariffs on Canadian and Mexican imports, along with 10% tariffs on Canadian oil and energy.
- Feb 1: Canada retaliates with 25% tariffs on approximately $30B of U.S. goods; Mexico follows with similar measures.
- Feb 3: A one-month delay is negotiated; the tariff implementation start date shifts to March 4.
- Mar 4: Tariffs take effect; the S&P 500 experiences a drop of approximately 1.8%.
- Mar 10: Canada expands tariffs to cover around $155B of U.S. goods.
- Mar 12: No global U.S. tariffs on steel/aluminum are confirmed, but auto tariffs are on the horizon.
- Apr 2: The U.S. announces a 10% baseline tariff on most imports plus 1%-40% reciprocal tariffs on 57 countries.
- Apr 3: A 25% auto import tariff is signaled; the Dow slides by nearly 1,000 points while the S&P 500 falls around 2.4%.
- Apr 4: China enacts a 34% tariff on U.S. goods (effective Apr 10), restricts rare earth exports, and blacklists key U.S. firms.
- Apr 5: The U.S. implements the 10% baseline tariff globally, exempting USMCA partners.
- Apr 9: The U.S. temporarily pauses tariffs on over 75 countries for a 90-day negotiation window while raising China tariffs to 125%; the S&P 500 rebounds approximately 9.5%.
- Apr 10: China follows up with an 84% tariff on U.S. imports and lodges a WTO complaint.
Markets Slide, and Recession Concerns
Investor sentiment remains cautious despite the recent rebound. In the weeks leading up to the tariff pause, markets experienced intense selling pressure. The S&P 500 declined nearly 10 percent in just two trading days, marking its sharpest drop since the pandemic period. Although the rally following Trump’s announcement provided near-term relief, the broader market tone remains uncertain as participants continue to assess the full impact of recent policy shifts.
Central banks have begun to acknowledge the changing macro landscape. On April 4, Federal Reserve Chair Jerome Powell highlighted the difficult balance between rising inflation and slowing economic growth. Minneapolis Fed President Neel Kashkari supported holding rates steady, citing elevated volatility and tightening financial conditions.
On April 9, Goldman Sachs withdrew its recession forecast just over an hour after issuing it. The firm initially projected a 65 percent chance of a U.S. recession due to newly implemented tariffs, but reversed course following Trump’s announcement of a 90-day pause on reciprocal duties. The about-face underscores how sensitive forecasts remain to evolving trade policy. Meanwhile, other institutions like Vanguard continue to flag risks, maintaining subdued GDP expectations below 1 percent for 2025. While recession risks remain elevated, the relief rally and temporary tariff freeze have opened a window for recalibration—though the road ahead still hinges on clarity in global trade dynamics.
The Global M2-Bitcoin Correlation Still Holds
Raoul Pal maintains that Bitcoin remains a high-beta play on global liquidity, and the long-standing correlation between Bitcoin’s price and Global M2 money supply (with a 12-week lag) is still intact. The latest chart reaffirms his thesis as M2 expands, Bitcoin follows, delayed but directionally aligned.
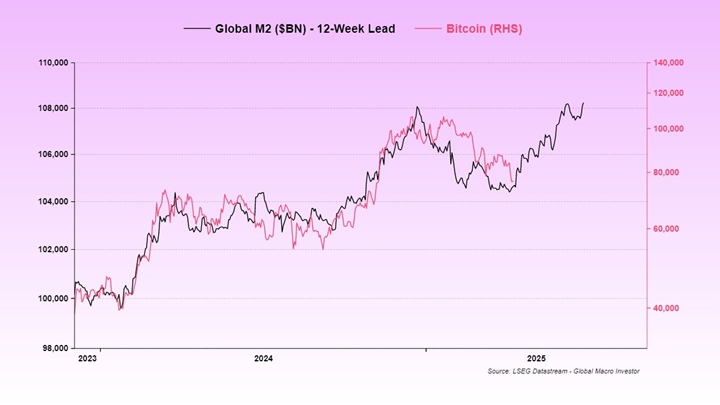
Source: LSEG Datastream
Despite periods of noise and short-term decoupling, the relationship has reasserted itself. The recent uptick in global M2, driven by easing financial conditions and renewed liquidity injections, is now being reflected in Bitcoin’s upward momentum. Pal sees this as strong confirmation that macro liquidity remains the dominant driver of Bitcoin price cycles, and that Bitcoin’s trajectory remains on track to follow the projected M2 path—potentially toward $120K in 2025.
In his view, this validates the framework that tracking liquidity leads—particularly M2—is the clearest macro signal for crypto investors. As long as central banks are expanding balance sheets and liquidity is rising, the Bitcoin bull case remains structurally supported.
Why the PBOC Might Devalue the CNY
Arthur Hayes suggests that the People’s Bank of China (PBOC) could be motivated to devalue the Chinese Yuan (CNY) in April 2025 as part of a strategic response to escalating external economic pressures, particularly amid rising U.S.-China trade tensions and new tariffs. A weaker CNY would enhance the competitiveness of Chinese exports by reducing their prices in international markets—a move reminiscent of the 2015 devaluation, which aimed to rebalance an economy increasingly pressured by a strong U.S. dollar.
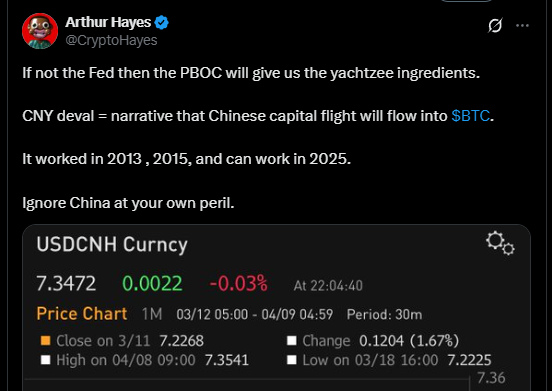
Source: https://x.com/CryptoHayes/status/1909427649157775851
In the current environment, where the USD/CNY rate spiked to 7.3472 on April 7, the PBOC might opt for a controlled devaluation. This could be implemented through adjustments to the daily reference rate, reduced foreign exchange interventions, or other monetary tools such as interest rate changes and liquidity injections. The process may also be facilitated by leveraging the digital yuan to more effectively transmit policy changes.
However, this strategy carries significant risks that could influence Bitcoin’s trajectory. A devaluation of the CNY may trigger capital flight, as Chinese investors seek to protect their wealth by moving funds abroad—a pattern seen during previous episodes in 2013, 2015, and 2019. According to Bybit CEO Ben Zhou, cryptocurrencies like Bitcoin could benefit from such capital flight, as they provide a means to bypass strict capital controls, potentially driving up demand and prices.
On the other hand, if the PBOC responds with tighter capital controls or aggressive interventions using its digital yuan or foreign reserve sales, the devaluation could be less pronounced. This would likely curb capital flight and reduce the inflow of funds into Bitcoin. Moreover, competition from traditional safe-haven assets like gold and an overall risk-off sentiment in global markets might limit Bitcoin’s attractiveness, potentially leading to market volatility and sell-offs.
Overall, while a devaluation of the CNY could initially bolster Bitcoin demand as a safe-haven asset, the accompanying risks and potential policy responses add layers of uncertainty that investors must carefully navigate.
Bitcoin Market Analysis
Over the past seven days, Bitcoin has been markedly more volatile than in recent weeks, driven by shifting macroeconomic dynamics and high-impact geopolitical developments. Price action reacted sharply to policy announcements, resulting in swift sell-offs followed by equally aggressive rebounds. This heightened volatility has created clearer support and resistance zones while forcing traders to reassess prevailing trends. The increased price swings have also opened up short-term opportunities, particularly for those watching key technical signals around the $75K level.
Early in the week, global trade tensions came to the fore when President Trump announced new tariffs on over 75 countries. This announcement sent risk assets, including Bitcoin, on a downward trajectory, with prices dipping into critical support levels. However, a pivotal policy reversal later in the week—a 90-day suspension of these tariffs—catalyzed a rebound, reflecting the market’s sensitivity to geopolitical developments. This backdrop of uncertainty is counterbalanced by robust institutional interest, underscored by the recent establishment of the U.S. Strategic Bitcoin Reserve, which reinforces Bitcoin’s long-term value proposition despite near-term volatility.
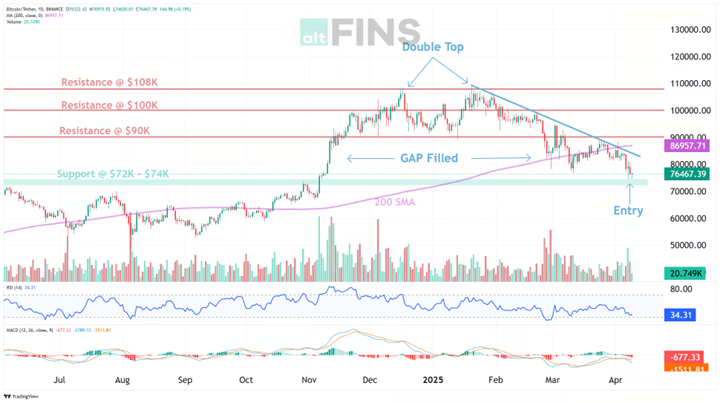
Source: https://altfins.com/technical-analysis
Price action remains technically weak, with Bitcoin now trading below its 200-day Simple Moving Average (SMA). This level, previously acting as a long-term support, has flipped into resistance—confirming the continuation of a strong downtrend across all major timeframes. Attempts to reclaim the 200 SMA have failed, further validating the current bearish market structure.
A sharp drop into the $74,900 zone earlier this week coincided with the announcement of sweeping U.S. tariffs, which triggered a risk-off move across global markets. Bitcoin, often responsive to macro-level shocks, followed suit. Yet following a reversal in tone from U.S. leadership—a 90-day tariff suspension—Bitcoin rebounded sharply. This reaction shows how closely technical structure and macro sentiment are now intertwined in driving near-term market behavior.
One of the most notable signals this week is the emergence of a bullish RSI divergence. While Bitcoin made a new low, the Relative Strength Index (RSI) did not, suggesting that the intensity of selling pressure is fading. This divergence is a classic signal that a short-term reversal could be on the horizon. Meanwhile, the MACD line remains below the signal line, confirming the ongoing bearish momentum, but histogram bars have started to rise, hinting that downward momentum may be losing steam.
Adding further context, the gap created between $74K and $90K during the November post-election breakout has now been mostly filled. Historically, filled gaps tend to act as zones of consolidation or reversal, reinforcing the importance of the $75K area as a potential bounce zone. Price is currently neutral in terms of momentum indicators, with RSI hovering between 30 and 70—neither oversold nor overbought.
Resistance now sits overhead near $83K and $90K, with significant selling pressure expected at those levels unless broader sentiment shifts. On the downside, if the $75K support gives way, the next critical support lies near $60K.
A tactical long setup exists around $75K, supported by bullish divergence on RSI, a bottoming MACD histogram, and the psychological strength of a filled gap zone. The upside target for this setup is $83K, offering a ~10% reward relative to risk, assuming the current support holds. A decisive close below $75K, however, would invalidate this thesis and shift focus to lower support around $60K. Given the prevailing downtrend and macro uncertainty, tight risk management remains essential.
Ethereum Market Analysis Report
Market Overview
Ethereum has been significantly more volatile over the past seven days, breaking to new local lows and reacting swiftly to shifts in macroeconomic sentiment. Price action has been aggressive in both directions, reflecting not only technical structure but also broader regulatory and market expectations. From a steep drop to $1,418 to a swift recovery toward $1,600, ETH’s behavior highlights the uncertainty and opportunity present in the current environment.
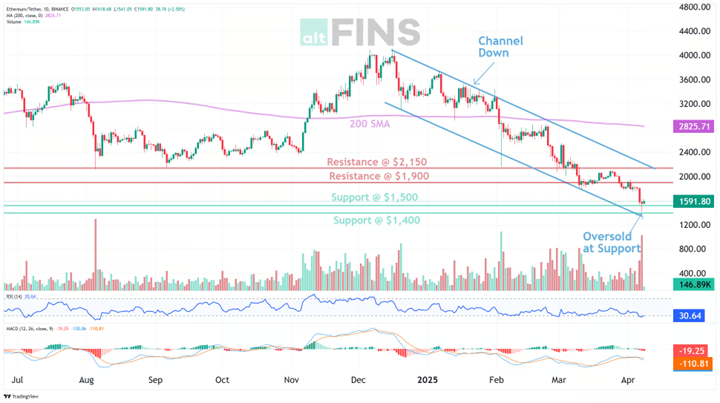
https://altfins.com/technical-analysis
Ethereum continues to trade in a well-defined Channel Down pattern, confirming the strength of the prevailing downtrend across all timeframes. Price remains below its 200-day Simple Moving Average (SMA), with no meaningful attempts to reclaim this level so far. The downtrend has been reinforced by the breakdown to a new 52-week low at $1,418, a level not seen since October 2023. From its December 2024 high near $4,000, ETH is now down roughly 65%, reflecting sustained selling pressure across both retail and institutional segments.
The short-, medium-, and long-term trends are all classified as strongly bearish, and the pattern structure suggests continuation unless a breakout occurs. Currently, ETH remains contained within the descending channel, with each bounce being sold into. However, this structure also sets the stage for a potential breakout trade. If ETH were to break through the upper boundary of the channel with strong volume, it could signal the start of a trend reversal—or at minimum, a short-term recovery rally.
Momentum indicators are beginning to hint at inflection. The MACD line remains below the signal line, but the MACD histogram bars are rising, indicating that bearish momentum may be bottoming out. This shift is occurring as RSI-14 remains neutral, neither overbought nor oversold, allowing room for a potential move in either direction.
The price zone between $1,500 and $1,580 is acting as short-term support, while the next key resistance lies at $2,150, with a secondary ceiling near $2,400. These levels are likely to serve as key decision points for traders once a breakout or rejection occurs.
Importantly, while technicals remain weak, a major macro catalyst looms: if U.S. regulators greenlight Ethereum spot ETFs with staking enabled, it could transform the demand profile for ETH in 2025. This would introduce passive institutional flows and reinforce ETH’s yield-bearing appeal—something currently absent from the ETF debate. Though speculative, this narrative is increasingly priced into long-term investor expectations.
The immediate trade setup is defined by the Channel Down pattern. Traders anticipating continued weakness may look to sell bounces within the channel, while those waiting for a trend reversal will focus on the breakout level. A confirmed breakout above the descending resistance line, especially with increased volume, could target $2,150–$2,400 in the near term. Until then, ETH remains vulnerable to further downside, with a breakdown below $1,500 possibly opening the door toward $1,300–$1,200.
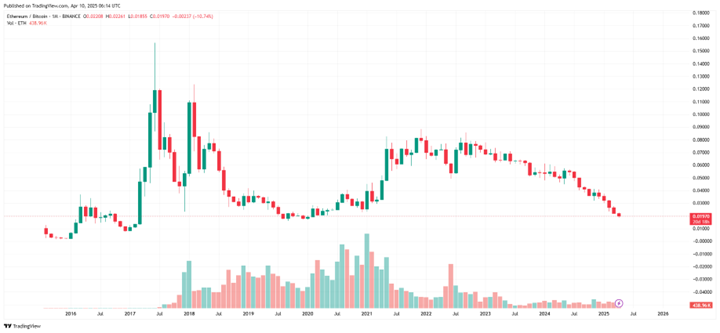
Source: https://www.tradingview.com/
Looking at the ETH/BTC monthly chart, the pair is hovering near a critical long-term support zone around 0.0197 BTC, a level that previously marked macro bottoms in 2016 and 2019. The steep multi-month downtrend, coupled with emerging volume activity, hints at possible capitulation and early accumulation. ETH has now retraced over 70% from its 2021 peak against BTC, suggesting potential for mean reversion after years of underperformance. While no clear bullish reversal pattern has formed yet, the combination of historical support, volume uptick, and oversold conditions raises the probability that ETH/BTC is approaching a cycle bottom.
Mark Your Calendars
Token Unlock
- April 13, 2025:
- APT: $52.48m worth of tokens unlocking (1.87% of circulating supply)
- April 14, 2025:
- AXS: $21.82m worth of tokens unlocking (5.67% of circulating supply)
- April 15, 2025:
- STRK: $17.07m worth of tokens unlocking (4.37% of circulating supply)