Six Days of Buying Carried Crypto Through a Rough Month
Key Numbers:
Bitcoin $84,104.44 (7.07%) Ethereum $2,682.04 (8.72%)
1-month return
Total Crypto Market Cap $2.88T (8.05%)
2026 returns
Bitcoin -4.28% Ethereum -10.07% Gold -3.89%
Nasdaq 15.57% S&P 500 11.77%
September 2026 Crypto State of the Market Report
This Month’s Highlights
- Bitcoin rose 7.07% in September and ended at $84,104. Ether rose 8.72% to $2,682. The S&P 500 slipped 0.45% and gold dropped 6.90%.
- It was a hard month for markets. Oil jumped from about $90 a barrel at the end of August to $130.80 on September 15, the interest rate on 10-year US government bonds climbed from 4.75% to 5.26%, and the Federal Reserve raised interest rates on September 16. Crypto rose anyway.
- Money flowing into US Bitcoin funds explains most of the gain, and almost all of it arrived in six trading days in late September.
- On September 15 the Senate voted down the Clarity Act, the bill meant to set crypto’s rules, by 49 to 50. Two days later the SEC said US stocks could trade on blockchains under a five-year exemption.
- Traders betting on a price fall had to buy back in, which started a short squeeze of $648 million and pushed Bitcoin above $85,000 on September 21. By the last two trading days, money flowing into the funds had shrunk to $31 million and $66 million.
- Thieves took $320 million from Blockstream’s Liquid Network on September 6 and $387.5 million from Bitget on September 24.
- Stablecoins, the dollar-linked coins of crypto, grew 1.3% to $311.2 billion. Money held in DeFi apps rose 10.7% to $94.8 billion, mostly because coin prices rose.
- Tokenised stocks, blockchain versions of company shares, reached $3.23 billion and 4.10 million holders, up 15.03% and 64.52% in 30 days.
How September Unfolded
September was the hardest month of the year for markets, and crypto still finished higher. US strikes near the Strait of Hormuz, a key oil shipping route, opened the month, and oil rose by more than a quarter. The interest rate on 10-year US bonds climbed by half a percentage point to its highest level since 2007. A surprise jump in US hiring on September 4 convinced investors that the Fed would raise rates, and it did. Bitcoin fell to $75,384 on the night of September 15, ended the month at $84,104, and beat both stocks and gold.
US Bitcoin funds took in $2.80 billion in September. Of that, $2.82 billion arrived across six trading days, from September 18 to 25, while the other 14 days together lost $22 million. Ether funds took in $834 million in the same six days, and traders betting on a fall were forced to buy back at $85,000. Daily inflows then shrank to $31 million and $66 million. Gold fell as interest rates rose, which is normal because gold pays nothing and bonds were paying more. Bitcoin pays nothing either, and it rose.
So September ends with an open question. A short burst of buying and a squeeze carried the market through a rough month. Congress then shut the door on crypto’s rulebook, while agencies opened side doors that will take months to matter. Interest rates were still climbing on the last day. October has to show whether ordinary buyers show up once the squeeze is over.
Performance Table
| Asset | Month-end observation | September 2026 return | 2026 YTD return |
| Bitcoin | $84,104.44 | +7.07% | -4.28% |
| Ethereum | $2,682.04 | +8.72% | -10.07% |
| Total Crypto Market Cap | ~$2.88T | +8.05% | -9.86% |
| COMEX gold futures (GC=F) | $4,172.30 | -6.90% | -3.89% |
| Nasdaq Composite (^IXIC) | 26,861.06 | +1.86% | +15.57% |
| S&P 500 (^GSPC) | 7,651.54 | -0.45% | +11.77% |
Source: CoinGecko snapshots at 12:00 a.m. Philippine time immediately after August 31 and September 30 for BTC and ETH; CoinGecko global market-cap snapshots taken about 01:20 UTC on September 1 and October 1 for total crypto market cap; Yahoo Finance exchange closes for COMEX gold futures, the Nasdaq Composite and the S&P 500. Crypto and US-market observations occur at different times.
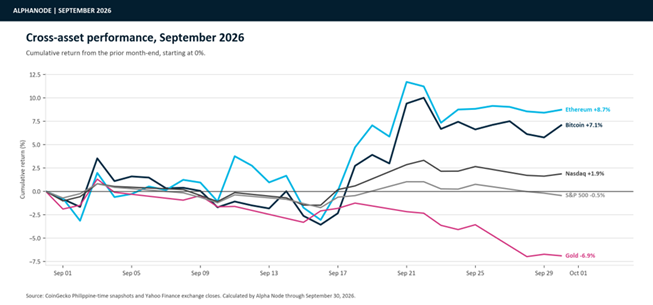
Source: CoinGecko Philippine-time snapshots and Yahoo Finance exchange closes. Calculated by Alpha Node through September 30, 2026.
The month opened with a shock. US strikes on Iranian targets near the Strait of Hormuz pushed oil to $96 a barrel on September 1, and Bitcoin fell below $77,000 as $100 million of bets were wiped out in an hour. A weaker dollar lifted Bitcoin to $81,322 on September 3, and the funds took in $731 million, the most in a day since January. A day later, US employers added 162,000 jobs, nearly three times the forecast of about 56,000, and traders who had bet on a rise lost more than $200 million in 15 minutes. Investors put the odds of a September rate hike at 53%.
Oil then took over. It passed $100 on September 3 and $120 on September 10. On September 9 the Treasury tripled the amount of long-term bonds it would buy back, aiming to keep the bond market working smoothly, but the 10-year rate still rose the next day. Prices excluding food and energy rose 0.3% in August, reported on September 11, a sign that higher fuel costs were spreading. By September 15 the 10-year rate touched 5.00% and oil peaked at $130.80. That afternoon the Clarity Act failed 49 to 50. Traders lost $570 million on bets on a rise, Bitcoin funds had their biggest one-day outflow since June, and Bitcoin touched its monthly low.
The turn came before the Fed spoke. The Fed raised rates on September 16 with no one voting against, and Bitcoin barely moved. Regulators then stepped in where Congress had failed. The SEC’s exemption arrived on September 17, the CFTC filed its own crypto rules with the White House the next day, and Japan’s central bank raised its rate to 1.25%. Bitcoin passed $80,000 on September 18 as funds took in $433 million. On Monday, September 21, funds took in $999 million and the squeeze pushed Bitcoin above $85,000. Iran hinted it could reopen Hormuz, oil dropped toward $115, and Bitcoin reached its monthly high of $87,158 early on September 23.
The rest of the month was a standoff. The 10-year rate rose above 5.10% on September 23 and reached 5.26% by September 29, the dollar hit its strongest level of the month, and oil bounced back above $120 on September 24. Bitget lost $387.5 million that evening. Bitcoin stayed between $83,000 and $84,500 for the last six days, and money flowing into the funds faded almost every day. On September 30 a report showed the Fed’s preferred inflation measure cooling more than economists expected, and investors stopped expecting another rate hike in October.
Bitcoin Market Analysis
Bitcoin started the month at $78,554 and ended at $84,104. The path matters more than the end points. For the first 17 days its daily closes stayed between $75,700 and $81,300. After touching $75,384 on September 15, it gained about $10,700 in six days. The highest price of the month was $87,158 on September 23.
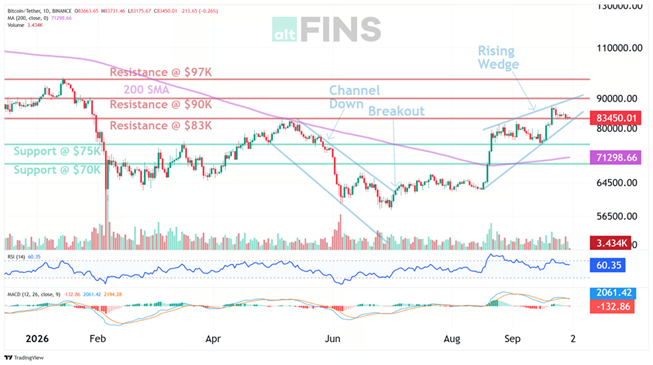
Source: altFins, Bitcoin technical analysis chart (daily candles, 200-day average, support and resistance), fetched October 1, 2026 at 00:49 UTC. Original provider chart reproduced without alteration; the last daily candle was still forming.
Who is actually doing the buying is the big question, and the chart below shows the answer: outflows through mid-month, then a burst of large inflows. Taken over the whole month, the money that came in equals 2.6% of everything the funds hold, and September 21 alone was the ninth-largest day ever recorded.
Some of the buying was forced. By September 21 traders had $156 billion of bets open on Bitcoin, and many of them were betting on a fall. When the price crossed $85,000, those traders had to buy Bitcoin back to close their bets, and each forced purchase pushed the price higher. About $648 million of those bets were closed on September 21 and more than $1 billion within the following day. That kind of buying ends once the bets are gone, and from September 23 the daily moves stayed within $1,100.
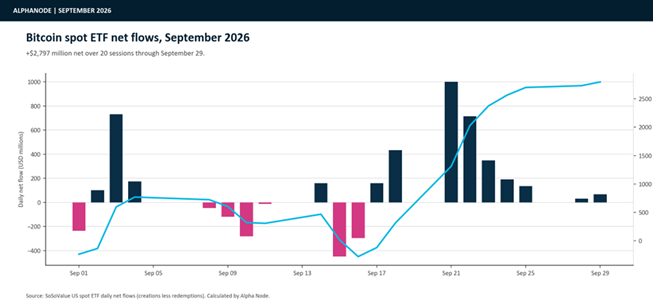
Source: SoSoValue US spot ETF summary-history API through September 29, 2026. Chart calculated by Alpha Node.
The altFins chart above shows the setup. Bitcoin broke out of a long downtrend in the summer and climbed back above its 200-day average price, and it now moves inside a rising channel that altFins labels a rising wedge. On September 8 its short-term average price rose above its long-term one, a pattern traders read as a buy signal. The analysts at altFins treat $83,000, a level that had capped the price before, as a floor now, with $90,000 and $97,000 as the next ceilings and $75,000 and $70,000 as floors below. One caution: two common price gauges suggested the climb had run hot and was losing speed.
Companies that buy Bitcoin for their treasuries are a smaller force than the headlines suggest. They bought only 5,900 Bitcoin in three months. In September Strategy bought 950 Bitcoin for $76 million on September 21 and 1,665 more at month end, and Strive passed 27,000 Bitcoin, all small beside the funds. JPMorgan estimates that it costs miners about $85,000 to produce one Bitcoin, so a price above that level may slow miners’ selling.
The next test is simple. Bitcoin ended the month about $3,000 below its September high and about 33% below its October 2025 record, and the money flowing into the funds each day is now about a tenth of the late-September pace. If Bitcoin holds above $81,000 while money keeps coming in, the market has absorbed the squeeze. If it closes below $75,000, the month’s low, the idea that the funds are carrying the price gets harder to believe, because the first half of September showed what happens without that buying.
Ethereum Market Analysis
Bitmine, a company that buys Ether, now owns 4.9% of all Ether and spent September moving toward 5%. It bought 53,500 ETH on September 1, 28,000 on September 8, 27,180 on September 14 and 27,562 on September 21. More than 5 million of its Ether is staked, meaning locked up to earn rewards, which it expects to bring in $334 million a year. One buyer with a target, steady income and a 65-week buying streak behaves differently from funds that follow the market. It is the closest thing Ether has to a patient buyer.
Ether rose 8.72% against Bitcoin’s 7.07%. One Ether bought 0.0314 Bitcoin at the start of the month and 0.0319 at the end. Its lowest price was $2,371 on September 2 and its highest $2,782 on September 21. It ended the month at $2,682 after finishing August at $2,467.
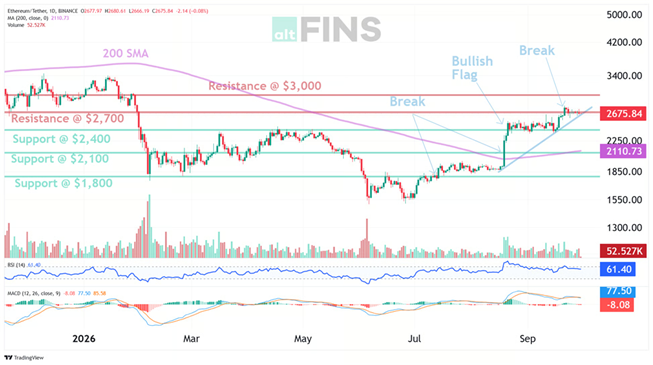
Source: altFins, Ethereum technical analysis chart (daily candles, 200-day average, support and resistance), fetched October 1, 2026 at 00:49 UTC. Original provider chart reproduced without alteration; the last daily candle was still forming.
Ether funds took in $892 million through September 29, equal to 5.0% of the $17.79 billion they hold. Bitcoin funds took in $2.80 billion, which was 2.6% of what they hold. So Ether got twice the push relative to its size, though smaller funds swing more easily. Of the total, $834 million arrived between September 18 and 25, and the last two days added $17 million and then lost $2.8 million. What matters now is whether the buying lasts.
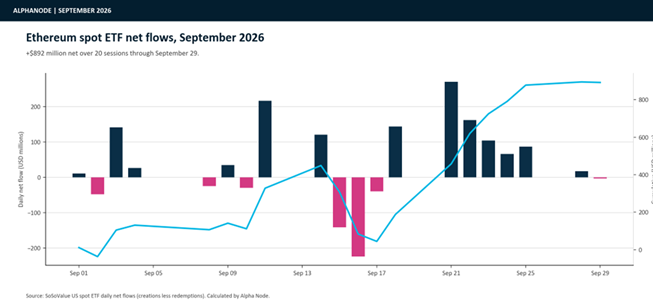
Source: SoSoValue US spot ETF summary-history API through September 29, 2026. Chart calculated by Alpha Node.
Ethereum’s next big upgrade, Glamsterdam, passed a practice run that raised how much activity the test network could handle, and it goes live on a test network on October 6. Developers also set a 2029 deadline to protect the network from future quantum computers. Neither moves the price this month. Both affect how much of the world’s payments and trading Ethereum can keep.
Ethereum now has well-funded rivals. Circle, which issues the USDC stablecoin, launched its own blockchain, Arc, with BlackRock and Visa helping to run it. Solana made its network faster and let each transaction carry more data. Ether’s long-term value depends on whether tokenised assets and stablecoins keep paying fees on Ethereum instead of moving to chains built for them.
The chart above shows Ether holding above its 200-day average price after a breakout, with $2,700 as the ceiling it keeps testing. Ether needs to rise above $2,782, its September high, to show it is stronger than Bitcoin, and it needs to stay above $2,400. The analysts at altFins see $2,700 as a ceiling with $3,000 next, and $2,400 and $2,100 as floors. A fall below $2,400 together with money leaving the funds would undercut the idea that Bitmine and the funds give Ether a firmer base than Bitcoin has.
Tokenised Stocks Got a Rulebook
On September 17, two days after the Clarity Act died, the SEC issued an innovation exemption that lets blockchain versions of US stocks trade more freely for five years, until September 17, 2031. It excuses approved trading venues from registering as stock exchanges, and it excuses the firms that supply money to the trading pools from registering as dealers. The rules limit how big this can get. A venue can list up to 75 big-company stocks and 250 others, with limits on how much trading each group can take on (0.25% for the first, 2.5% for the second), and it must pause for three months if it goes over. A company has 30 days to object if someone lists its shares without asking. Law firm analyses note that the token must give the same dividend, voting and payout rights as the real share.
The product already existed. On October 1, rwa.xyz counted $3.23 billion of tokenised stocks, up 15.03% in 30 days, with 4.10 million holders, up 64.52%, and 3.34 million active wallets, up 122.22%. The chart climbs almost straight up from early 2026.
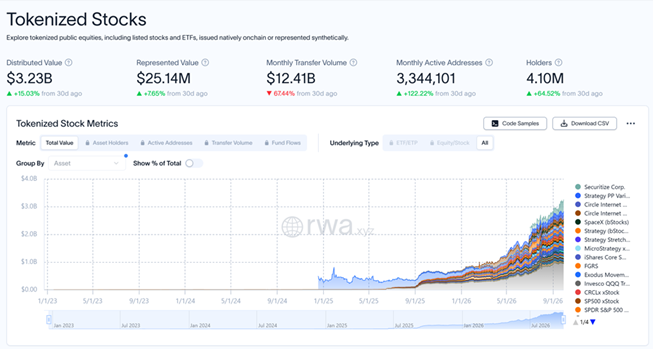
Source: rwa.xyz, Tokenized Stocks, distributed value and holder metrics, captured October 1, 2026. Original provider screenshot, cropped.
Everyone who reaches customers moved within weeks. Nasdaq put $100 million into Kraken’s parent company, Payward, valuing it at $21 billion, and the London Stock Exchange agreed with Payward to put 100 UK stocks on a blockchain. NYSE and Blockchain.com announced a platform for 44 million crypto accounts. When Robinhood sold stock tokens, AMC’s chief executive made a legal threat and called them fake shares, and Robinhood refused to stop. The SEC’s rule that companies can object within 30 days is its answer to that fight.
The exemption has limits. It covers only approved venues and capped trading, only tokens of US-listed stocks, it expires in five years, and it leaves Congress’s bigger questions open. Analysts see early winners in Coinbase, Robinhood and Circle, because they already handle storage and settlement. Whether crypto coins linked to this trend will benefit is unproven.
Hot Wallets Failed Again
The month’s two biggest thefts had the same weakness: a few keys protected very large amounts of money. On September 6 an attacker used a bug in Blockstream’s Liquid Network, a Bitcoin side network, to create fake tokens and cash them in for about 4,000 Bitcoin, around $320 million, using 11 of the network’s 15 approved signers. The attacker returned 3,400 Bitcoin once the bug was fixed and kept about 598. Blockstream refused to pay a ransom demand for the rest, and parts of the network stayed switched off even after it restarted.
Bitget’s loss was larger. Money began leaving at 6:31 p.m. UTC on September 24 across Ether, stablecoins and several other coins. Bitget’s chief executive said the attacker broke into a backend system that runs its wallets and faked transaction data. Bitget’s own protection fund covered the loss. The case showed how little can be frozen once money is stolen. Circle and Tether froze one wallet holding about $318,000, THORChain refused a request to block the thief, and Near Intents stopped only about $50 million of attempted swaps.
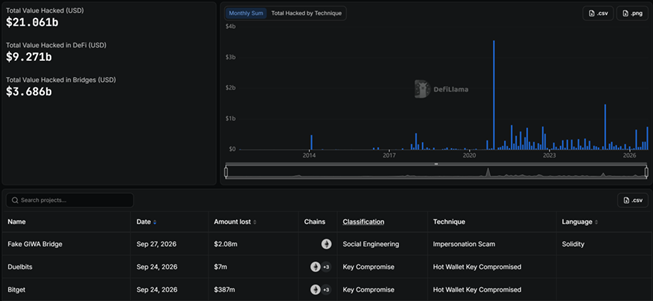
Source: DefiLlama, Hacks: Overview, monthly sum of value hacked and most recent incident list, captured October 1, 2026. Original provider screenshot, cropped.
Smaller cases fit the same pattern. The Cronos network reversed two hours of its own history to recover $111 million, though attackers still kept $9.19 million. Crypto software firm Haruko reported an attack that hit 15 clients, and a third wave of thefts from Coldcard hardware wallets moved about $7.7 million in Bitcoin. Prices barely reacted. Bitcoin slipped from $79,700 to $78,800 over three days after the Liquid theft and moved less than 1% after Bitget, so markets treated both as company failures, not as a problem with Bitcoin itself. Getting money back depended on thieves choosing to cooperate, which is a weak base for banks and big funds.
Macro Watch
Oil set the tone. It ended August near $90 a barrel, jumped to $96 on September 1 after US strikes near the Strait of Hormuz, passed $120 on September 10, and kept climbing after a Saudi oil pipeline was shut on September 11. It peaked at $130.80 on September 15 and was still 27% higher on September 29 than at the end of August. Higher fuel costs flowed straight into prices. Gasoline rose 3.9% in August and made up more than a third of the month’s price increase, leaving US inflation at 3.4% over the past year. Prices excluding food and energy rose 0.3% on the month.
Strong hiring then removed any reason for the Fed to wait. Employers added 162,000 jobs in August against forecasts near 56,000, unemployment stayed at 4.1%, and wage growth slowed to 3.1%. Investors went from expecting rate cuts to expecting a hike. The Fed raised its main rate to a range of 3.75% to 4.00% on September 16 with no one voting against, and its members’ middle forecast pointed to one more increase this year. Chair Kevin Warsh said inflation had been too high for too long.
Bond rates climbed with it. The 10-year US bond rate is what the government pays to borrow for ten years, and it guides mortgages and loans across the economy. It rose from 4.75% on August 31 to 5.26% on September 29. The Treasury’s bigger bond buyback did not hold rates down, because the 10-year rate rose the day after it began. The dollar gained about 1.5% against a broad group of currencies from August 31 to September 25, and Japan’s central bank raised its rate to 1.25%, the highest in 31 years, adding to global pressure.
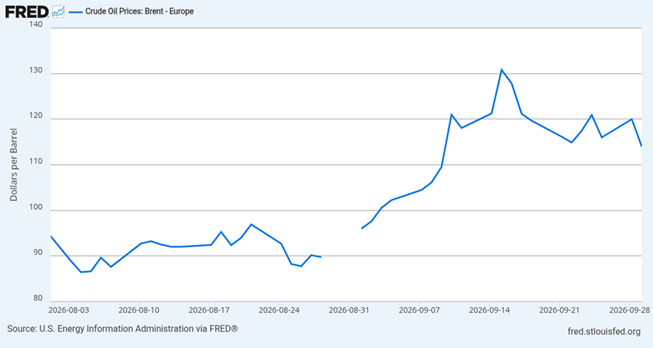
Source: U.S. Energy Information Administration via FRED, Crude Oil Prices: Brent – Europe, daily, retrieved October 1, 2026. Original FRED chart reproduced without alteration.
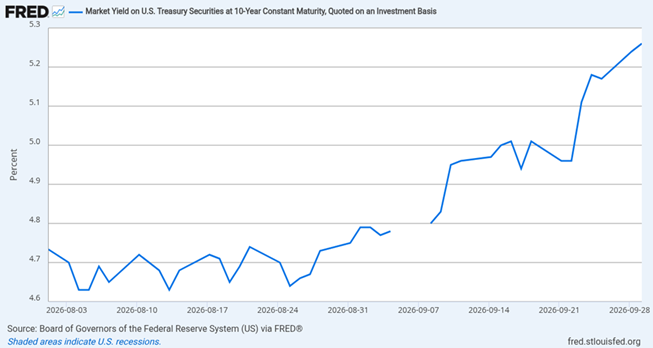
Source: Board of Governors of the Federal Reserve System via FRED, Market Yield on U.S. Treasury Securities at 10-Year Constant Maturity, daily, retrieved October 1, 2026. Original FRED chart reproduced without alteration.
Higher interest rates make assets that pay nothing less attractive, because safe bonds pay more. Gold followed that rule and lost 6.9% as rates and the dollar rose. Bitcoin did not. It gained 7.07% even with a stronger dollar, so fund buying and the squeeze outweighed the usual pull of higher rates. Traders had also been paying to bet on lower prices, which suggests the rate shock was already built into the price and did not set off a new wave of selling.
The month ended with some relief. August inflation in the Fed’s preferred gauge was 3.4% overall and 3.0% excluding food and energy, down from 3.7% and 3.3% in July, and the second figure came in below the 3.3% forecast. Expectations for an October hike fell. But oil, bond rates and the dollar had not eased, so the relief rests on one report. Inflation data due October 14 and the Fed’s decision on October 28 will show whether price pressure is peaking or just pausing.
Market Structure
Forced selling explains why September’s moves were sharp in both directions. When traders borrow to make big bets, an exchange closes their position automatically if losses eat through their money. That is called a liquidation, and it pushes prices further in the same direction. The Clarity Act’s failure triggered $570 million of liquidations on September 15 and 16. The squeeze on September 21 and 22 forced out $648 million of bets on a fall, and more than $1 billion within 24 hours. August 19 was much bigger, near $3 billion, so September’s shake-outs were moderate.
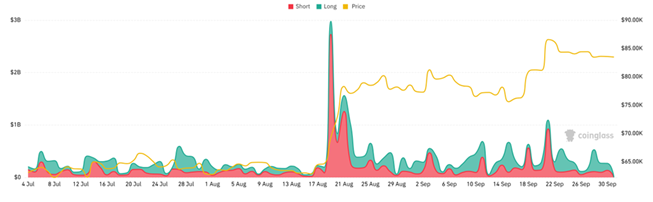
Source: CoinGlass, Bitcoin Price vs. Cryptocurrency Liquidation, daily long and short liquidations against Bitcoin price, July 4 to September 30, 2026. Original provider chart reproduced without alteration; the final day is partial.
Stablecoins, crypto coins pegged to the dollar, grew only 1.3% in the month, small next to Bitcoin’s gain. That growth shows how many dollars sit on blockchains ready to be used, not how many have been put to work in risky bets. The money deposited in DeFi apps, which lend and trade without a bank, grew faster than Ether’s price rose, so most of that increase is simply higher coin prices, and it is hard to say how much is new deposits.
More coins joined the rally while the weakest dropped out. Zcash reached $1,000 on September 4, hit its highest price since 2016 on September 7 and pulled in $500 million through a new fund. XRP funds took in money 11 days in a row, Solana funds set a record, and Glassnode, a data firm, said investors were moving into smaller coins as Bitcoin’s share of the whole market stalled below 60%. At the other end, BitMEX shut down after 11 years, CoinEx said it would close, and Bitwise began closing its Dogecoin fund after it gathered only about $688,000.
The big players were consolidating too. Binance bought a $100 million stake in Circle as part of a five-year USDC deal and, within a day, was reported to be under a federal sanctions probe. Gemini’s shares were down 80% from their stock-market debut price. By the end of the month there were more products at the top and fewer survivors below.
Sector Performance
Sectors rose broadly, and that is the first thing the chart shows. Seventeen of the 20 groups of coins beat both Bitcoin and Ether over the same 30 days, and only prediction markets fell outright, while real-world assets and tokenised stocks barely moved. When Bitcoin funds took in nearly a billion dollars in a day and traders betting on a fall were forced to buy, money tended to spill from the biggest coins into smaller ones. Glassnode noticed that shift late in the month, as Bitcoin’s share of the whole market stalled below 60%. The chart shows the typical (middle) coin among the top 25 in each group.
AI is at the top, but a large part of that is NEAR. The coin belongs to both the AI and data-storage groups, and it surged when Bitwise launched the first US fund that holds it, because a fund gives a coin a whole new set of buyers. The rest of the AI group also rose. Render, Bittensor and Internet Computer each gained 30% to 40% in a month crowded with AI news, from Nvidia’s $12.9 billion purchase of Hugging Face to talk of a $1.4 trillion value for OpenAI.
Privacy and zero knowledge, a privacy technology, are really one story: Zcash. The coin passed $1,000 on September 4, pulled about $500 million into a new Zcash fund within days, and held a holder vote to speed up its blocks. Monero, the other large privacy coin, rose only about 5%. So this is one coin’s fund-driven rally. Zcash is also counted in the zero-knowledge group, which is why both groups rise together.
DeFi and exchange coins rose because the smaller names did, while the biggest barely moved. Hyperliquid, the largest exchange coin, gained under 10%. Uniswap, Aerodrome, Jupiter and PancakeSwap gained 39% to 74%. Aave rose on talk of a coin burn, in the same weeks it began accepting tokenised stocks as loan collateral. Ethena gained about 78% as it started backing its dollar coin with tokenised stocks, and Standard Chartered ended the month predicting more than 600% upside. Coins that run on Ethereum’s add-on networks followed. Arbitrum rose 85% as Robinhood’s new chain added revenue for its community fund and Standard Chartered set a $10 target.
Three groups lagged, each for its own reason. Prediction markets are almost one coin, Rain, which fell 27%, in a rough month for legal news. New York sued to block Polymarket, Kalshi lost an appeal, and a European regulator questioned both, even as Polymarket raised $1 billion. The tokenised-asset groups look flat for a different reason. Several coins in the real-world-asset group are built to hold a steady price, including tokenised Treasury bonds and dollar-earning coins that did not move, and the gold coin fell 7% along with gold. Tokenised stocks follow the shares they represent, so their month followed those shares and not a crypto rally. The number of people holding tokenised stocks grew 64.52% in 30 days, which shows the product working but says nothing about what owning a coin in that sector earns.
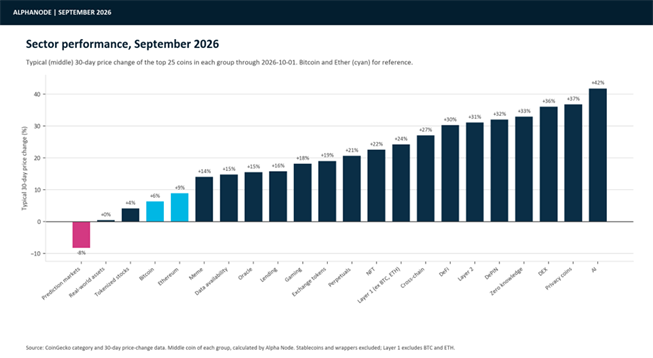
Source: CoinGecko category and 30-day price-change data retrieved October 1, 2026. Median token return of each sector’s top 25 tokens, calculated by Alpha Node.
Regulatory Developments
Congress, the agencies and foreign regulators move on separate timetables, and September pulled them apart. Congress stalled over ethics rules for officials who hold crypto and over whether the bill would take power from state regulators. A White House ethics compromise and a letter from 17 state attorneys general failed to win the 60 Senate votes the bill needed to move forward. The next day the House Ways and Means Committee approved a crypto tax bill by 38 to 5. A committee vote is only a first step. The full House, the Senate and the president still have to sign off.
Agencies moved faster. The SEC’s stock-token exemption, described above, is the biggest step. The CFTC sent its crypto rules to the White House for review, the first step toward a public proposal and later a final rule. The Federal Reserve proposed rules for the GENIUS Act, the stablecoin law, including a two-day window for issuers to pay holders back, and the SEC published FAQ guidance on token buybacks and network upgrades. Hester Peirce, the SEC commissioner who has been crypto’s steadiest ally there, leaves on October 2.
Banks also opened up. The OCC, the national bank regulator, gave OpenReserve conditional approval to form a national bank, followed by Revolut and Bastion. Conditional means the bank still needs money, systems and a final review before it can take deposits. Abroad, Australia’s licensing deadline passed on September 30 with penalties from October 1, Singapore proposed that stablecoin issuers hold 100% in reserve, and the UK opened applications for rules that start in October 2027.
Fairshake, a crypto political group, committed $30 million against Senator Sherrod Brown after the vote, and analysts argued the defeat helped offshore hubs. None of September’s agency actions is final.
Mark Your Calendars
Economic Data Releases:
- October 2, 2026 (Friday), 8:30 a.m. ET: US jobs report for September. Another surprise would bring back talk of a rate hike and show whether the 10-year bond rate can stay above 5%.
- October 14, 2026 (Wednesday), 8:30 a.m. ET: Consumer prices for September. Fuel drove August, so a drop in gasoline would show whether inflation is peaking.
- October 15, 2026 (Thursday), 8:30 a.m. ET: Wholesale prices for September. They show whether higher business costs are being passed on to shoppers.
- October 27-28, 2026 (Tuesday-Wednesday): Fed meeting, with the decision on October 28. The rate hike the Fed signalled for this year comes up for a decision.
- October 29, 2026 (Thursday), 8:30 a.m. ET: First estimate of US economic growth for July to September, plus income and spending for September. They show how much the oil shock hurt shoppers.
Token Unlocks
- October 2, 2026 (Friday): Ethena unlocks about $10.75 million of ENA, equal to 0.45% of released supply. The amount is small compared with daily trading.
- October 2, 2026 (Friday): DoubleZero unlocks about $386.09 million of 2Z, equal to 188.18% of released supply. The release is nearly twice the number of coins already trading, so the price could swing.
- October 6, 2026 (Tuesday): Hyperliquid has a scheduled HYPE unlock near $898.85 million, equal to 2.32% of released supply. Reports say part of the team’s share is being sold privately to one buyer, so what reaches exchanges matters more than the headline figure.
Other Dates
- October 6, 2026: Ethereum’s Glamsterdam upgrade starts on a test network.
- October 9, 2026: The XRP Ledger upgrade called Batch is now planned, after support among its operators slipped below the 80% it needs.
Wrap-Up
September showed that crypto can take a hit from higher interest rates and oil. What it did not show is that buyers return once the squeeze is over, and a short burst of buying carried most of the gain. Congress closed one route for crypto’s rules and the SEC opened another, which will take months to build.
October has one job: to show that regular buyers come back and that bond rates stop climbing. The market has proved it can absorb pressure. It has not yet shown it can keep growing under it.